-
-

Asvestis team!
-
Dashboard
WHO WE ARE?
Asvestis supports the #EUvsVirus and is committed to providing innovative solutions during the period we are going through. Asvestis is a company specializing in inter-vehicle communications systems and mobilizes its skills in artificial intelligence and entrepreneurial to better address the crisis we are living and the next to come. The Asvestis team is made up of 4 people:
• BORDEAU Clément: Project initiator, front - backend developer, data analyst
• RONNE Gauthier: Developer, backend developer and data analyst
• SALMON Thierry: User interface designer
• HANRION Baptiste: Project manager
We are a young team of engineers, creative and dynamic, sensitive to current events. This is an unprecedented crisis for the majority of the world's population and many questions remain unanswered to date.
When will the lockdown end ?
What lockdown strategy to follow?
To answer this, the Asvestis team is developing a prediction model able to follow the evolution of the virus over time, and its impact on populations.
PREDITTORE
The "Predittore" project in Italian or "Predictor" in English aims to follow the evolution of the virus over time and in particular to predict the date of the lockdown end for a large part of the countries affected by covid-19. The prediction model depends on information provided by governments. The closer the data provided to reality (number of confirmed cases, number of deaths, number of patients cured) and updated regularly the more reliable the mathematical model is.
MATHEMATICAL MODEL
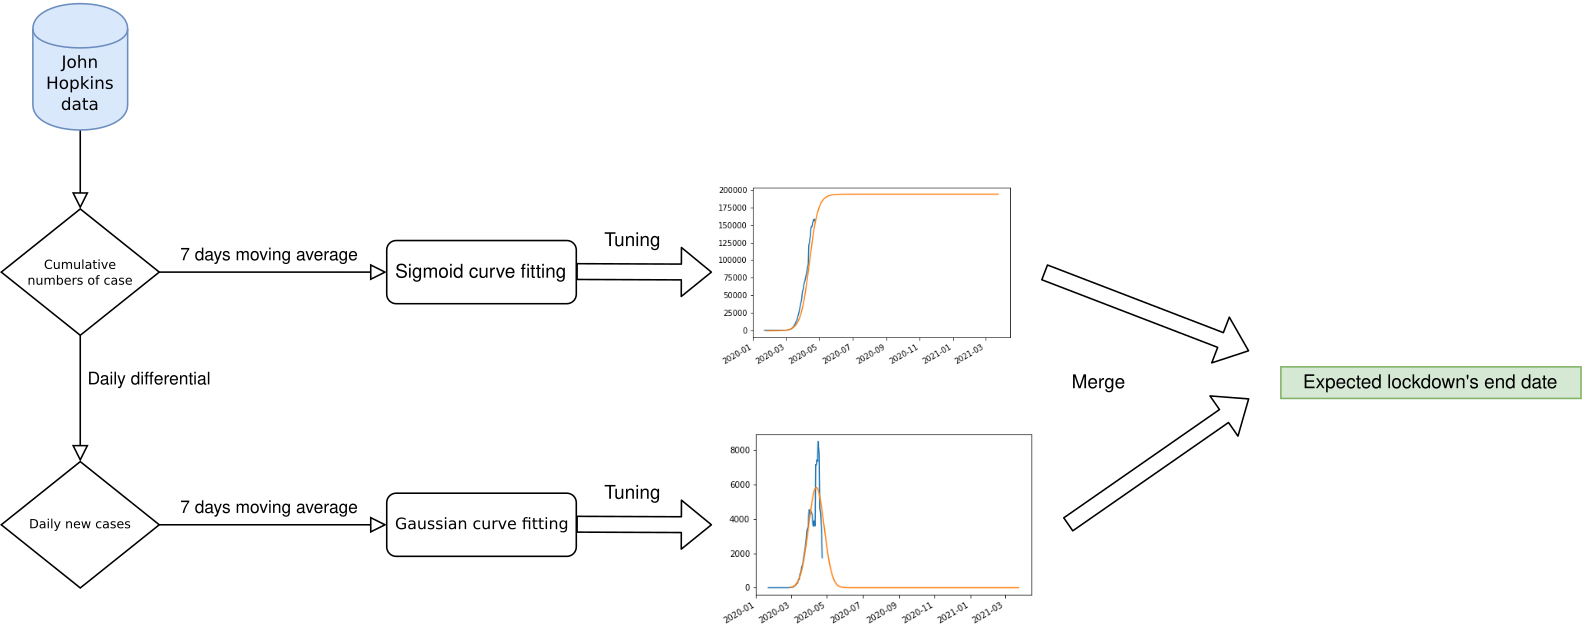
The program retrieves data provided by John Hopkins University published on GitHub. This data is in csv format, so using the Pandas library in python we extract and format this data. We therefore obtain for each country, the number of confirmed cases, deaths and treated. Then we plot the overall trends, the 7-day rolling average, the daily trend and the moving average of the 7-day daily figures. To make a prediction of the evolution of the number of new cases and the date of release from confinement, we make a Gaussian stick to the evolution via a Gaussian regression.
THE IMPACT OF OUR PROJECT ON THIS CRISIS
Covid-19 allowed us to set up this model which will also be applicable to future pandemics.
By knowing in advance the number of days of lockdown, the whole economy of the country will be able to organize itself with confidence. The political powers will be able to react more quickly and more efficiently. In this way, the number of deaths can be greatly reduced.
When government announce “lockdown until further notice”, people are helpless because they don’t have any idea of what will happen. Stores are quickly stormed and population panics. Safety instruction are absolutely not respected, only survival counts. By providing a specific date for lockdown’s end the behavior of some people can change dramatically. Citizens will know how long they will be locked up, they will be able to organize themselves rationally and security measures will be better respected.
WEBSITE

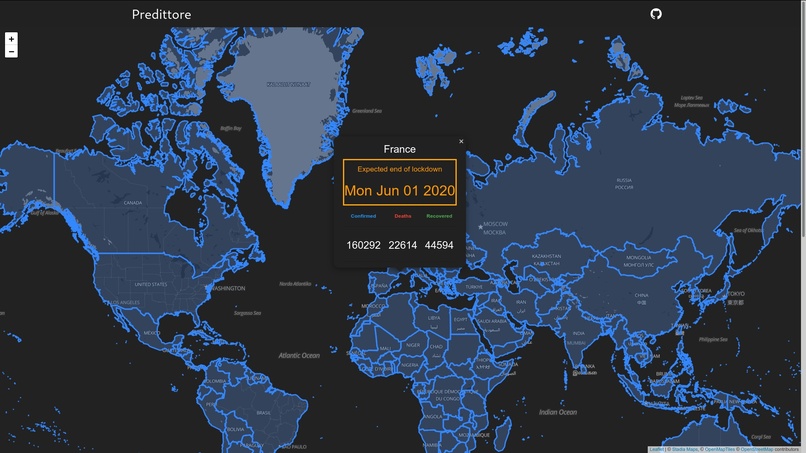
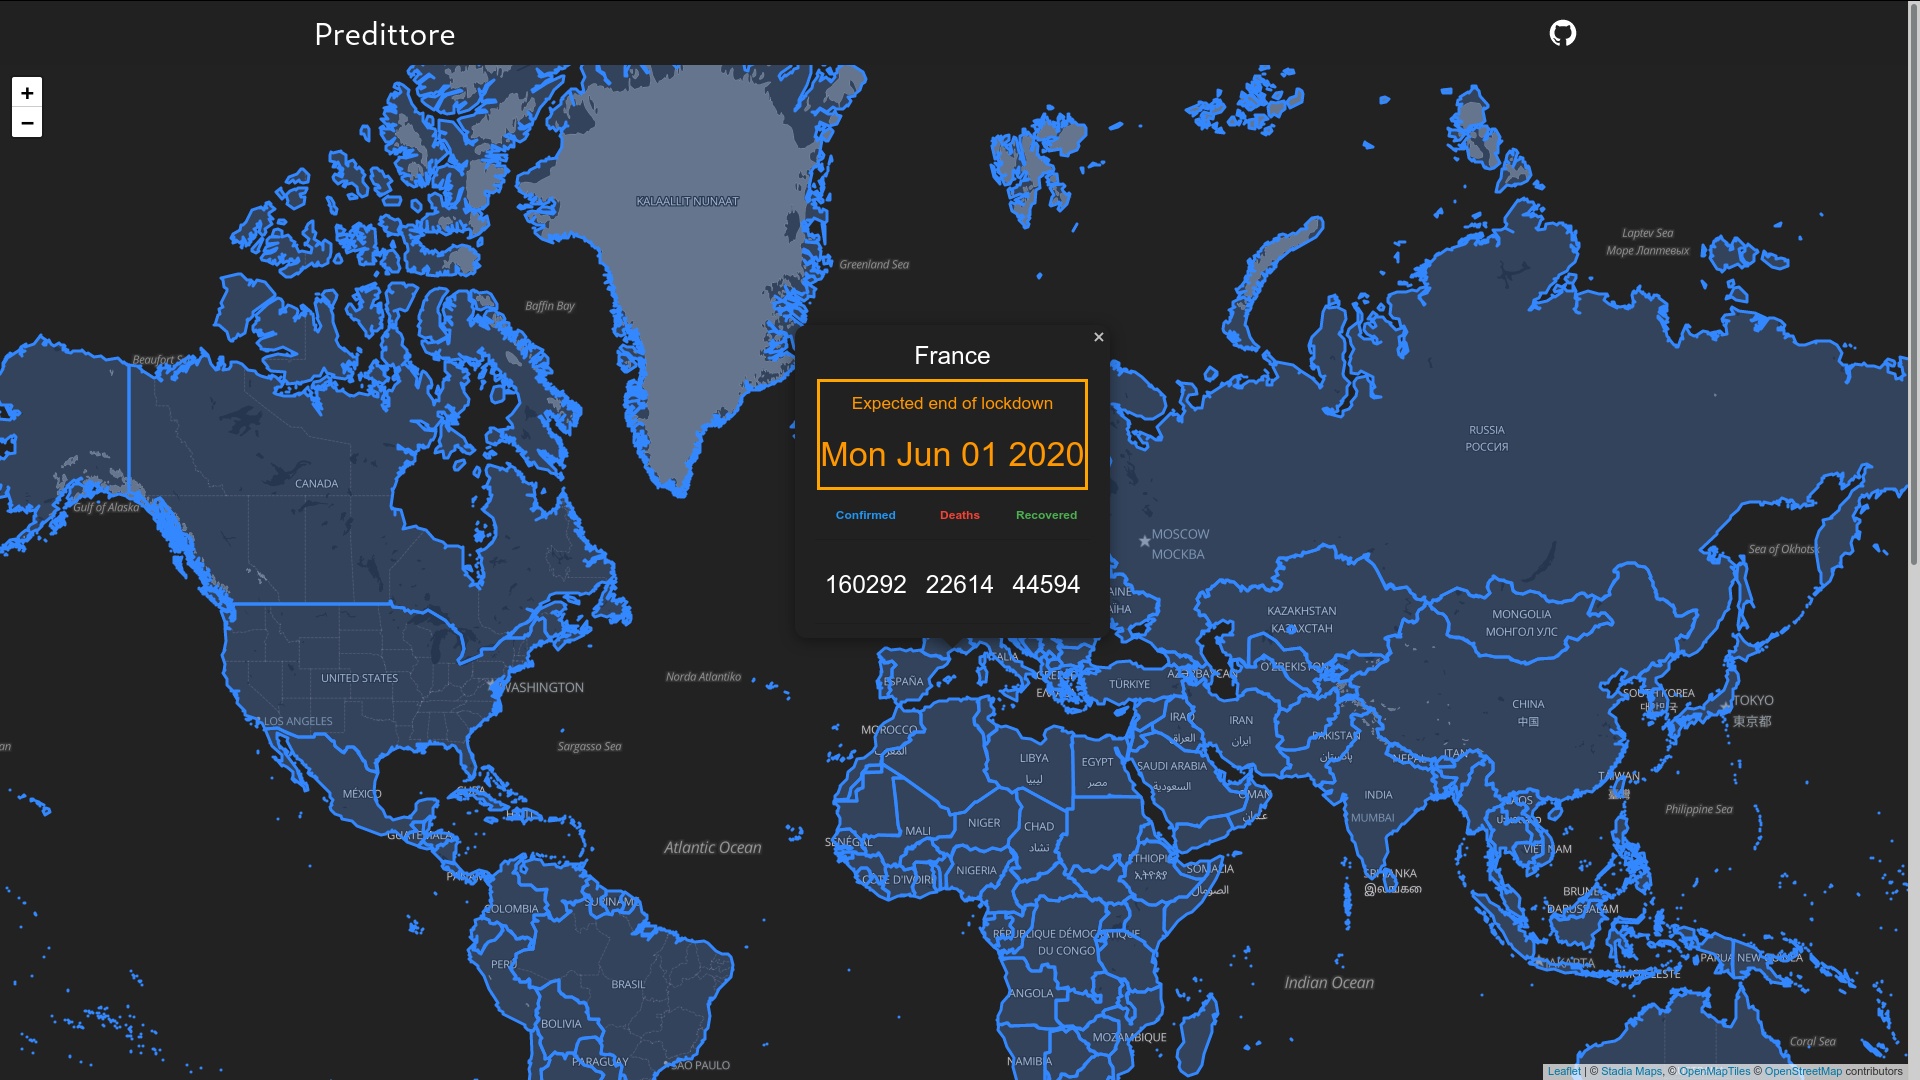
The results generated by our prediction model will be directly accessible on the website that we are developing. The website will be interactive and intuitive to easily inform and reassure the world's population. Users will be able to follow the evolution of the pandemic over time, to know when the peak is crossed. They will be able to know the date of the lockdown end as well as the impact of the lockdown strategies implemented by the various governments on the results of the prediction model. The home page of the website is the world map. You just need to move your mouse over a country to instantly know the date of the lockdown end. The background color of a country turns orange as soon as the computer mouse is over it.
By clicking on a country, the user will have access to all the information for that country only if the government communicates correctly.
Once the user clicks, a zoom is made on the selected country. A page appears as follows: the right part corresponds to the map of the selected country and the left part indicates the date of the lockdown end, the number of deaths, the number of patients cured and the number of confirmed cases. Also, it is possible to access to the curves and to country’s news.
We can read on the curve the evolution of the pandemic peak, the lockdown end, the number of confirmed cases, the number of deaths and the number of cases cured. By clicking on the news, you will be able to access to the actuality related to the country's health crisis. We are working to make these results accessible on a regional scale.
A home page is available. Thanks to this, it is possible to access world news on the covid-19, the user can return to the map to select a new country, to contact us via our email address and to sign in. Accounts can be created for governments. They will have detailed access to our calculations and to all the parameters on which we have based ourselves. Accounts may be allocated at the request of the government.
We think that it will take 2 weeks to finalize the project with a successful website and a precise prediction model. The website will be public. The objective is to provide concrete and rapid responses to better address and manage the current pandemic, which continues to spread around the world, and future health crises.
HACKATHON #EUVSVIRUS
This hackathon will allow us to code our prediction model. This model will therefore include:
- The evolution of the number of confirmed cases
- The evolution of the number of deaths
- Cured patients
- Lockdown strategy
- A precise date indicating the lockdown end
In addition, we will develop our way of communicating about our project, we will provide a reliability study on our model and we will implement a new way of learning about the pandemic evolution update.


Log in or sign up for Devpost to join the conversation.