-
logo
-
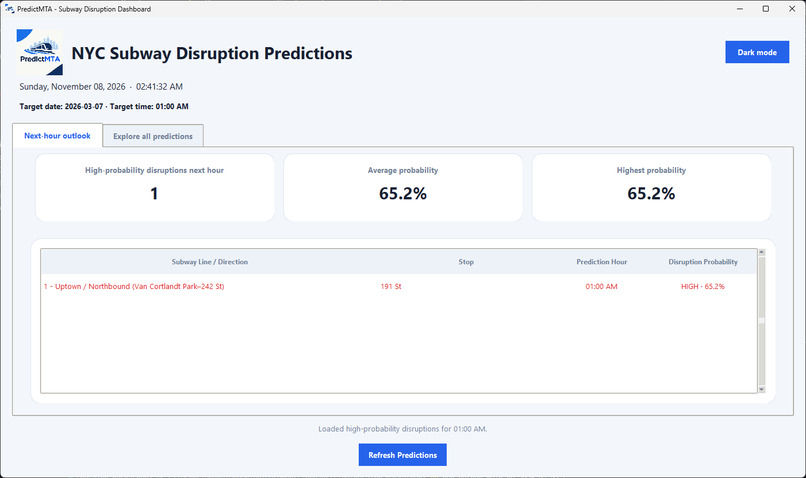
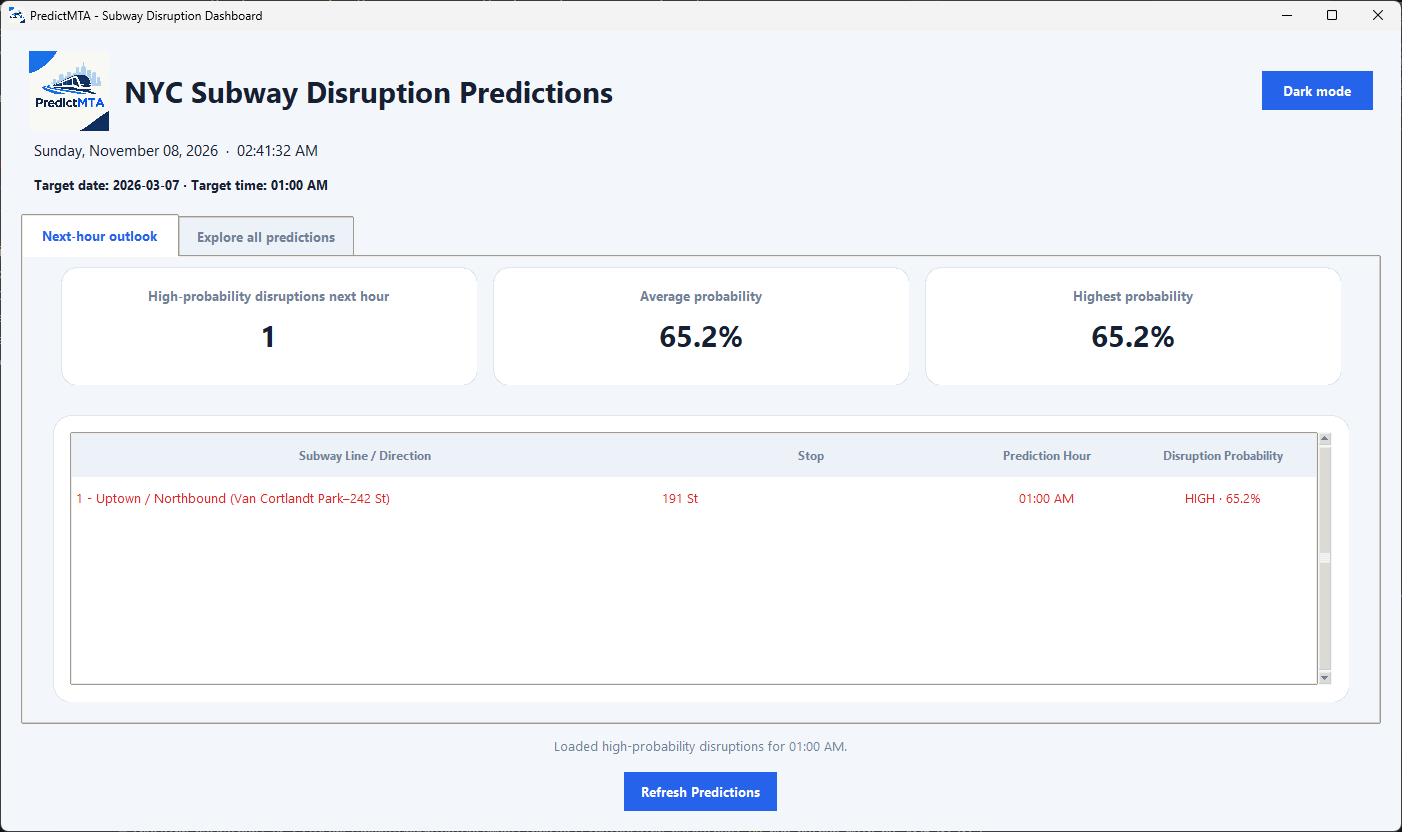
main dashboard
-
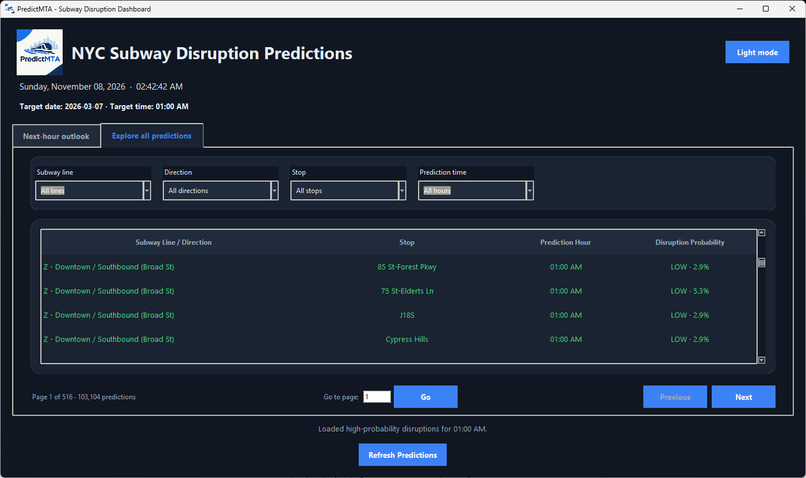
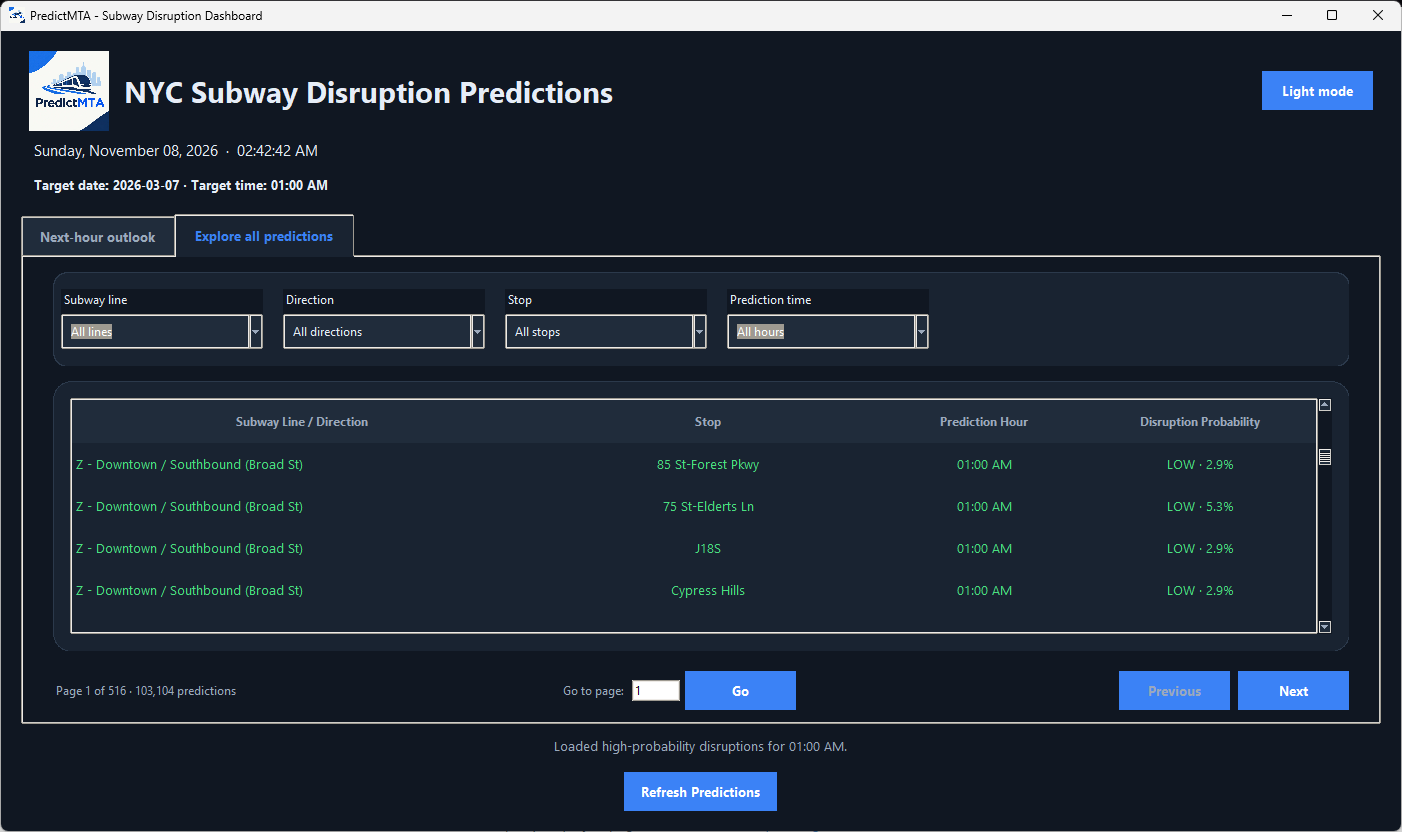
all data (filter/sort by line/direction/stop/time) + dark mode
-
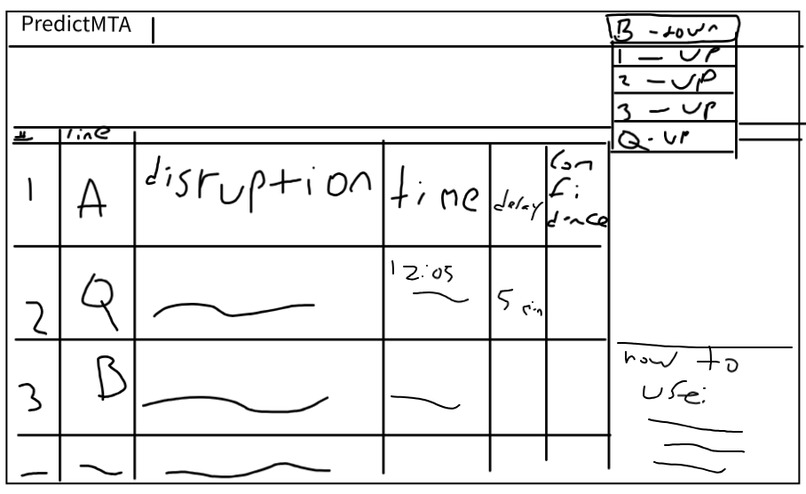
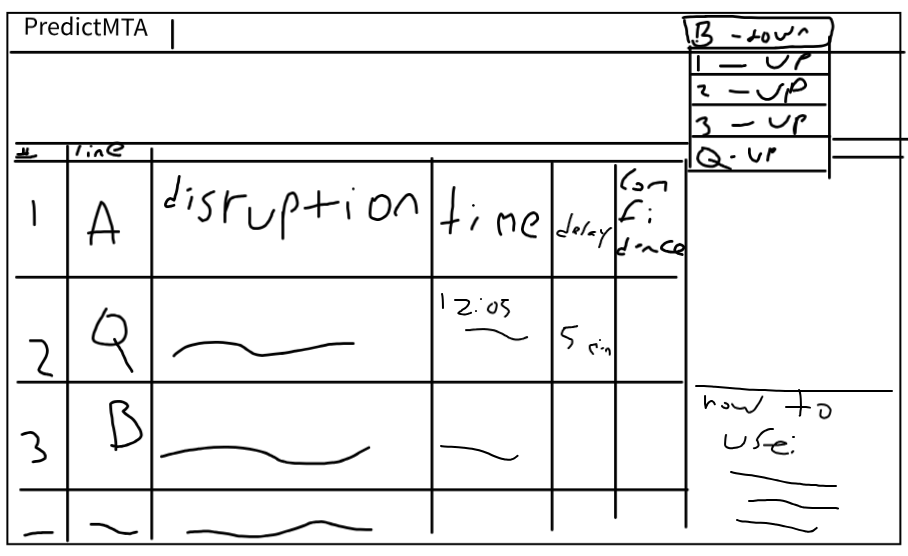
mockup draft
-
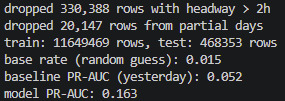
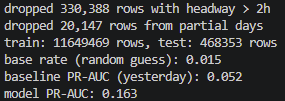
training results
Inspiration
When thinking about the category of public infrastructure, a clear example came to mind: NYC's MTA subway system. It can be unpredictable, and the digital arrival board only tells you the estimated arrival of the next few trains, but that's only when you've arrived at the station. We wanted to see if we could use the history of train gaps could be used to see whether a train is likely to be delayed, so you could either leave earlier or switch to a different train.
What it does
PredictMTA estimates how likely each subway line and direction is to have a disruption in a given hour. This lets the rider see which lines could take longer for a commute. A disruption is defined as an hour when the longest wait between trains exceeds what's normal for that line, hour, and day type. The model is trained on previous data from a third-party website that archives its data straight from the MTA's API. The model uses patterns from the previous day, day type, and hour to predict the next day's probability of disruption.
How we built it
We divided the pipeline into four parts:
- Processing: We used trip-level data from subwaydata.nyc, a third-party archive that records MTA's real-time feed (MTA's own API has no history). Each day is a .csv and is fetched straight from the URL based on given date parameters. Each day's stops are combined to compute headway, the gap since the previous train at the same stop/direction. Then it groups them into 5-minute bins and saves each day as a Parquet file. Then all the days are combined into one big Parquet file. The data has no disruption labels, so we defined an hour as disrupted when its longest gap is at least 2.5x normal for that stop/hour/day type, and at least 10 minutes longer.
- Training: We first clean the data by dropping gaps that are longer than two hours to account for overnight service which don't count as a disruption. The rows with partial data were also dropped. "Normal" is defined as the median longest gap over the year. The bins are grouped into one row per line, direction, stop, date and hour. We summarize the hours such as average, longest gaps, and number of trains. The model is the fed data of the previous days. The last 14 days are held back as a test set and everything before them is for training. The LightGBM is the model we chose and it builds multiple small decision trees and corrects mistakes of previous trees. The model is scored based on the area under the precision-recall curve.
- Predicting: The latest day's (usually the day before) dataset is downloaded and run through the same processing as part 1. It is then run through the classifier, outputting a disruption probability for every hour at every line, direction, and stop.
- Displaying: A Tkinter dashboard with a main tab as the next-hour outlook for disruptions, and another tab with all predicted data, with filters and sorting for line, direction, stop, and hour. Probabilities are grouped as Low (<0.25), Moderate (0.25>), High (0.5>). Targeted dates and times can be chosen as parameters when running main.py.
Challenges we ran into
- Leaving campus prevented us from accessing the GPUs provided by the hackathon, and using CISCO didn't work either.
- It's difficult to do real-time because the MTA API doesn't hold its data; it simply sends out updates every 5 minutes. We would have to record and archive the data ourselves to use it.
- The data doesn't have any labels by default that say a disruption happened.
- Disruptions are rare, and causes are unknown, so accuracy can be misleading.
- Time constraints. This project was a lot more complex than we originally thought it would be. We had to give up a lot of features (in What's Next section) in favor of finishing an MVP on time.
- Frontend.
Accomplishments that we're proud of
- The entire pipeline runs on laptops without GPUs.
- Defining and labeling our data for our own use (disruptions).
- Anyone can run the dashboard with a single command, using the included model.
- Model trained on about 11.6 million rows of stops x hours, covering a full year of MTA data (2025-11-01, 2026-11-01)
- After testing 468,353 rows of stops x hours, the model reached a precision-recall AUC of 0.163, about 11x better than randomly guessing and about 3x better than guessing based on the day before. (See training results image)
What we learned
- Machine learning isn't only based on the algorithm, but the data plays a huge role in it as well.
- Area under the precision-recall curve can be a better metric than accuracy in the case of rare events.
- Simple models like LightGBM can be strong on tabular data and don't need a GPU.
- Real-world data is messy, and you have to clean it up to use it.
What's next for PredictMTA
Data
- Train on larger amounts of data.
- Add weather data (Ref below) and intertwine it with disruptions.
- Add MTA data (Ref below) on crime, incidents, and disruptions, by where and when. Together with weather, this can explain why a predicted disruption happens, instead of just when.
- Track individual trains. Link disruptions to each train's ID so trains tied to more disruptions raise their predicted risk, in addition to the model of the train, which the MTA API/NY database should provide.
Real-time
- Use MTA API for live data. Fetch the updates every 5 minutes and temporarily queue them in memory.
User Features:
- Recommend alternate routes when incidents are predicted.
- Let users favorite lines/stops, moving them to the top of lists/displays.
- Add line/stop information and schedules, using files like routes.txt
- Turn app into a web app (ex., with FastAPI), for easier accessibility and practicality for users.
Other Transport:
- Add other modes of MTA transport: Bus, LIRR, railroad. They have data and APIs, so it is possible.
Broader Application
- The overall idea has other applications outside of the MTA and for other infrastructure.
- We could predict incidents and prepare accordingly or find alternate routes with maps in case of an incident on one route
- For example: We could predict an influx of patients to hospitals or map routing traffic based on events such as concerts.
Future Resources:
Weather Data:
https://www.ncdc.noaa.gov/cdo-web/search
MTA Data:
https://data.ny.gov/Transportation/MTA-Subway-Trains-Delayed-Beginning-2020/9zbp-wz3y/about_data, https://data.ny.gov/Transportation/MTA-Subway-4-to-5-Minute-Late-Arriving-Trains-Begi/x7nj-r656/about_data, https://data.ny.gov/Transportation/MTA-Subway-Delay-Causing-Incidents-Beginning-2020/g937-7k7c/about_data, https://data.ny.gov/Transportation/MTA-Subway-Major-Incidents-Beginning-2015/ereg-mcvp/about_data, https://data.ny.gov/Transportation/MTA-Daily-Ridership-and-Traffic-Beginning-2020/sayj-mze2/about_data
Real-time:
https://raw.githubusercontent.com/OneBusAway/onebusaway-gtfs-realtime-api/master/src/main/proto/com/google/transit/realtime/gtfs-realtime-NYCT.proto, https://raw.githubusercontent.com/OneBusAway/onebusaway-gtfs-realtime-api/master/src/main/proto/com/google/transit/realtime/gtfs-realtime-service-status.proto, https://raw.githubusercontent.com/OneBusAway/onebusaway-gtfs-realtime-api/master/src/main/proto/com/google/transit/realtime/gtfs-realtime-MTARR.proto
Resources Used
- https://subwaydata.nyc: Unofficial third-party archive of MTA API.
- Stop/routes come from MTA's data (gtfs_subway.zip).
