-
-
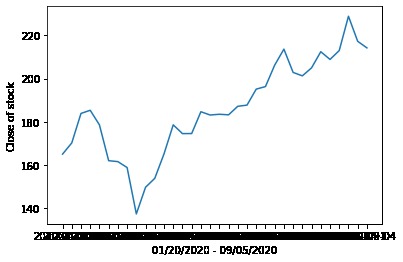
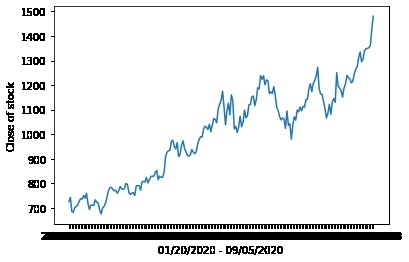
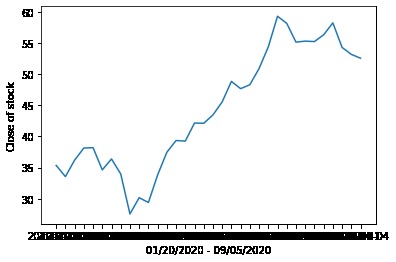
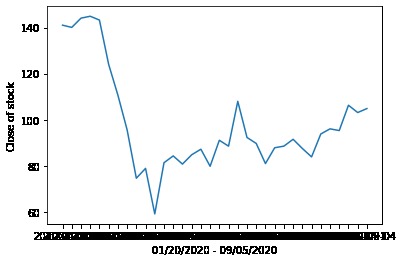
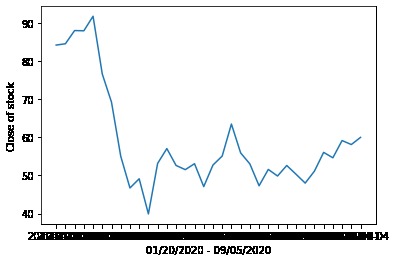
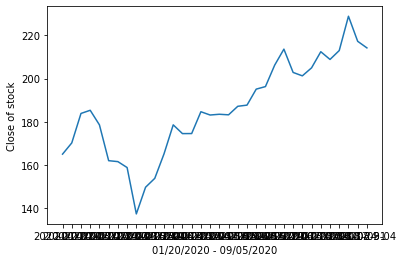
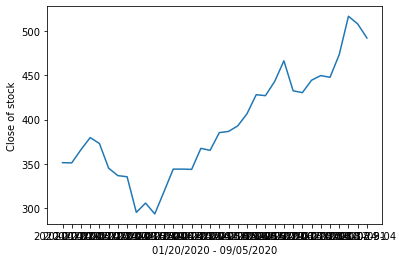
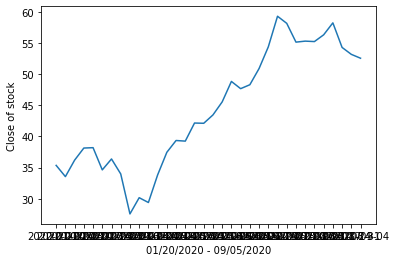
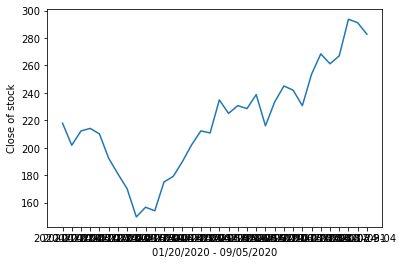
Microsoft Actual Stock Values (01/20/2020 - 09/05/2020)
-
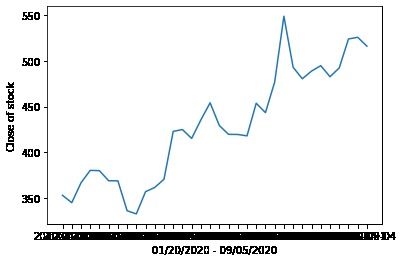
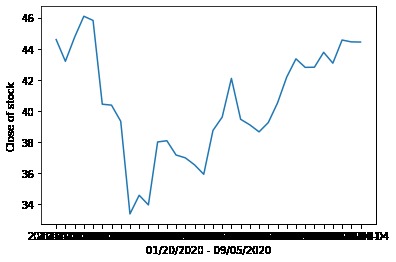
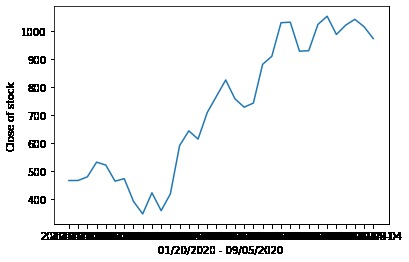
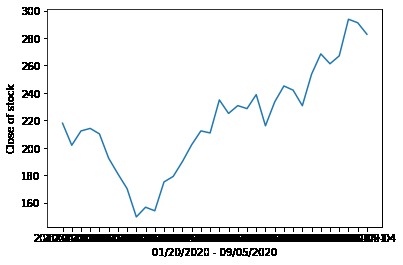
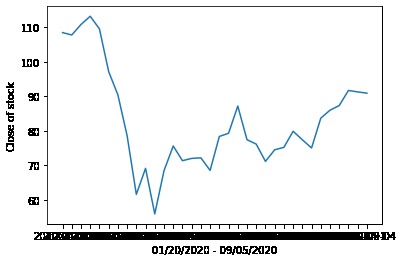
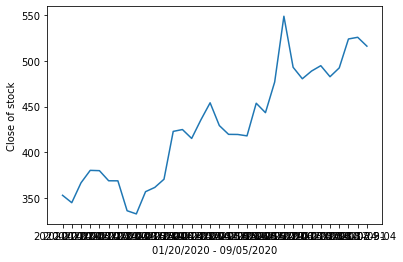
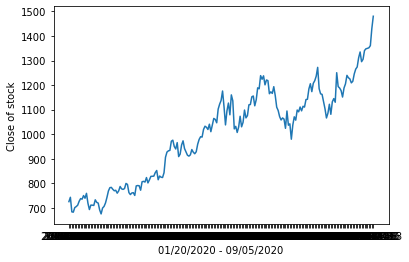
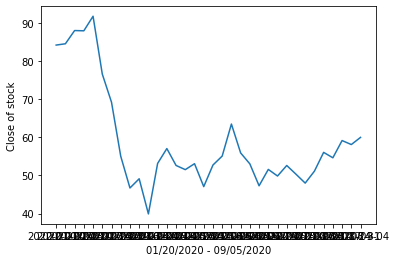
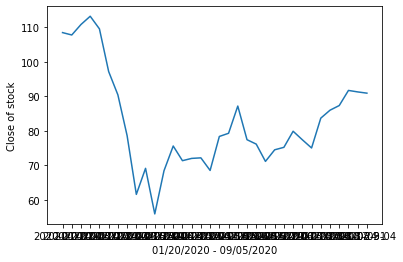
Netflix Actual Stock Values (01/20/2020 - 09/05/2020)
-
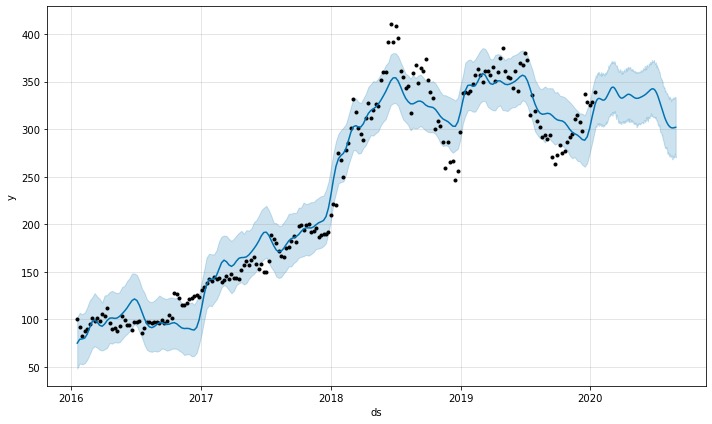
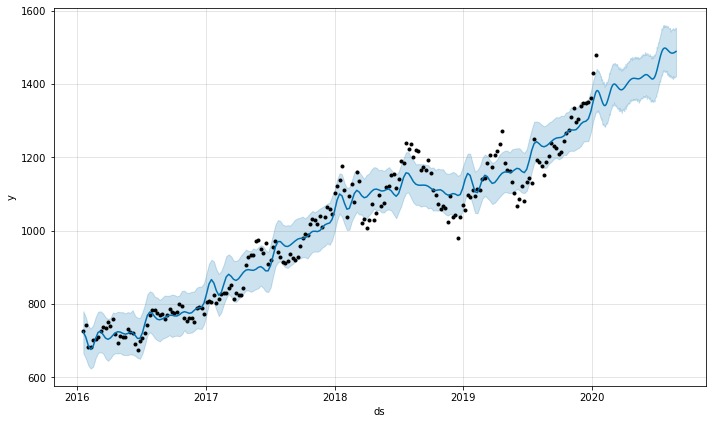
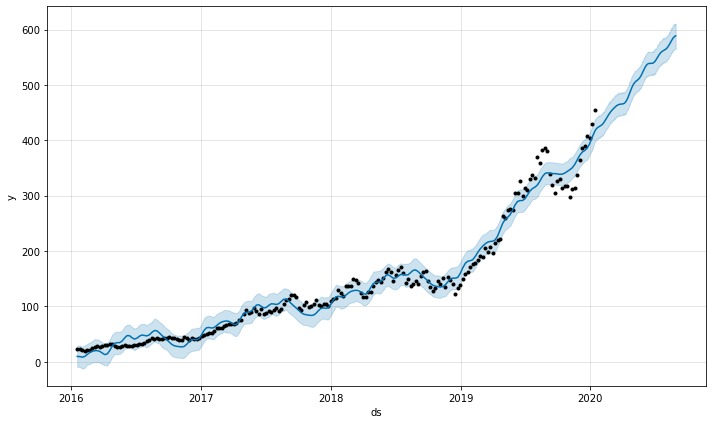
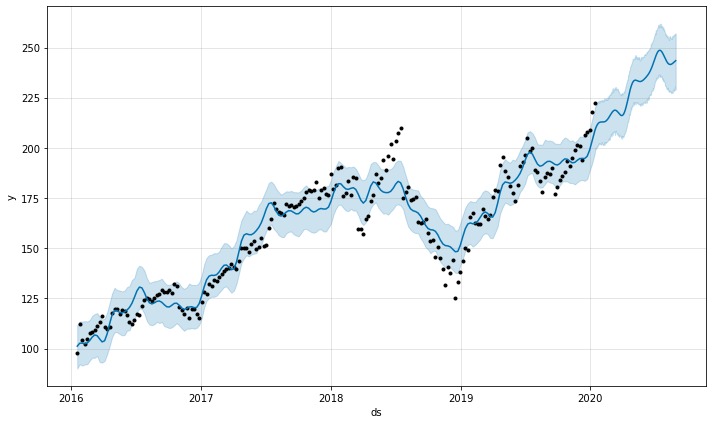
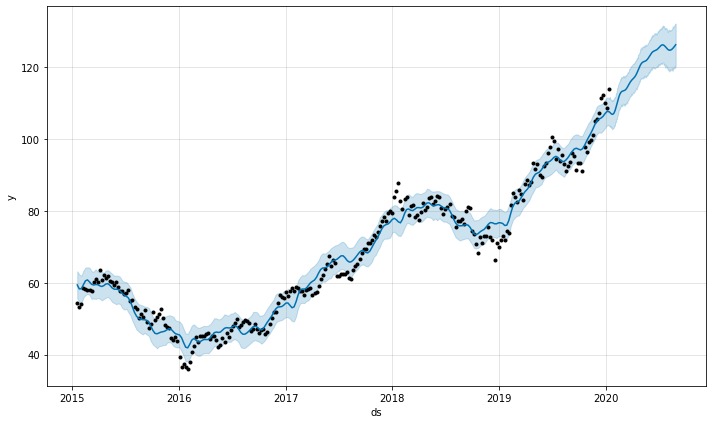
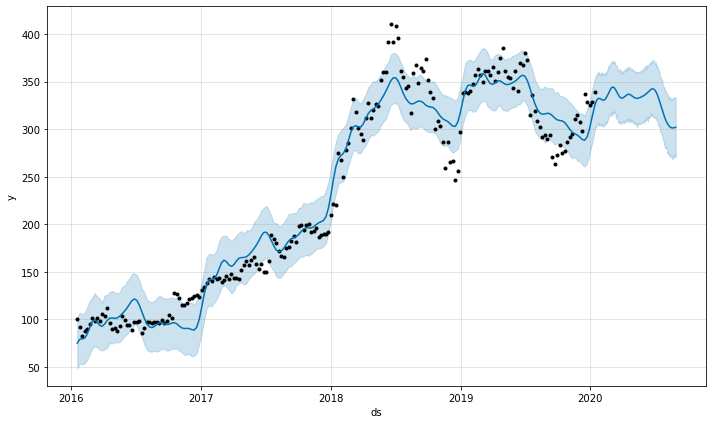
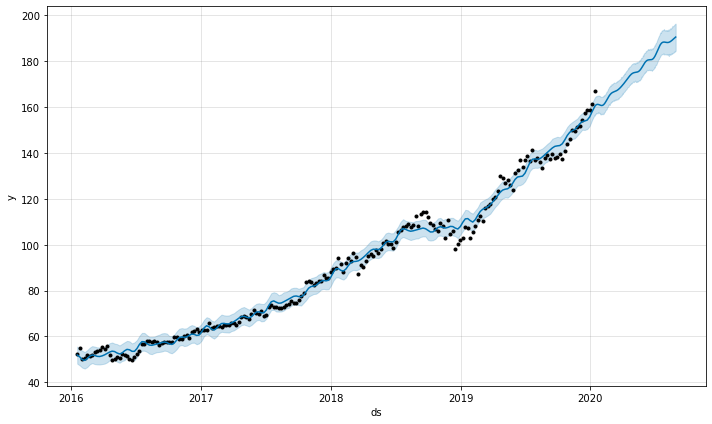
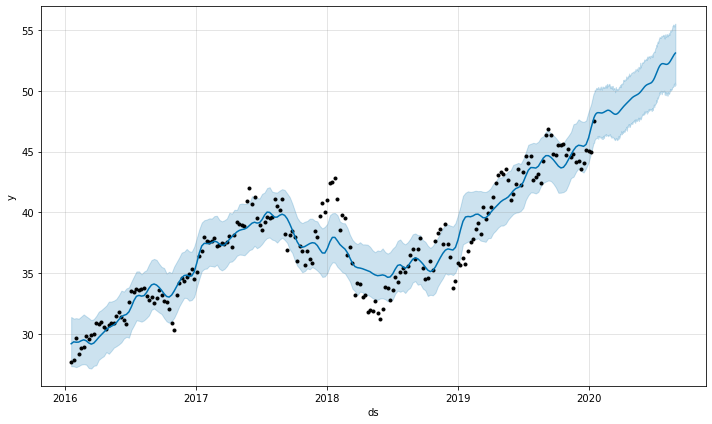
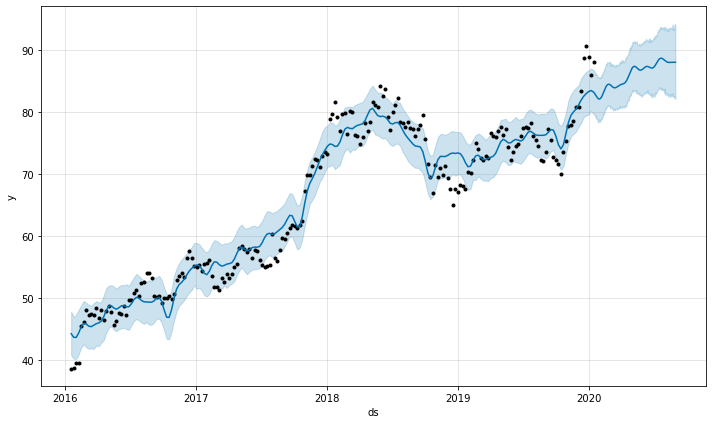
Netflix Predicitve Stock Values - Media
-

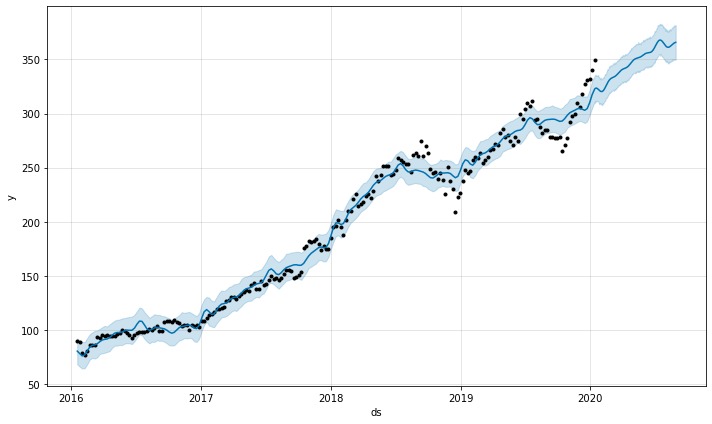
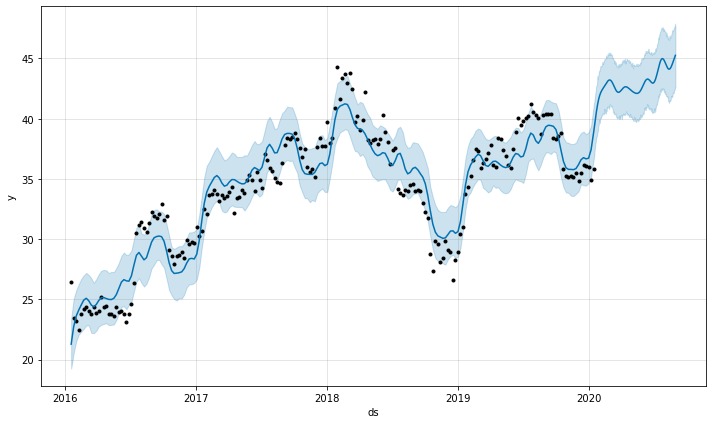
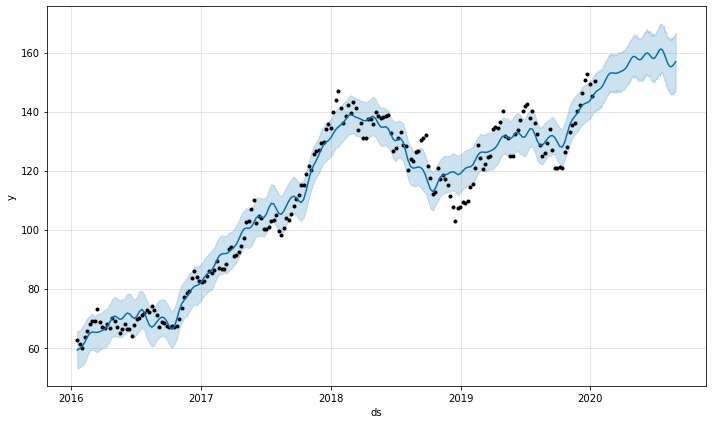
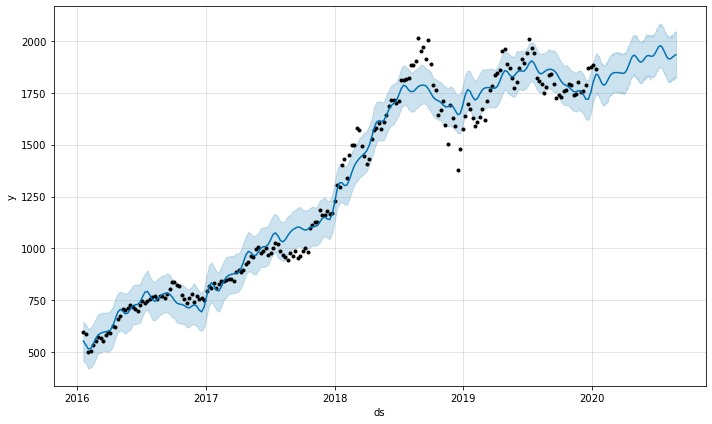
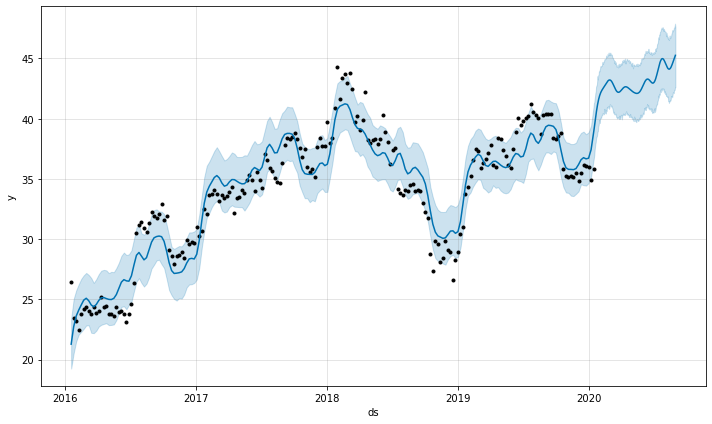
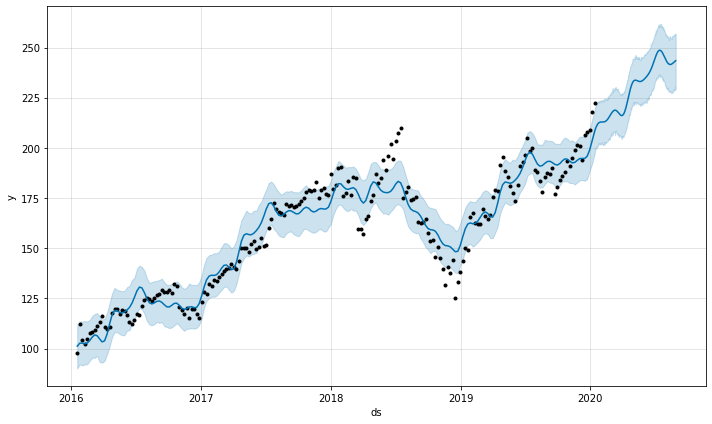
Microsoft Predictive Stock Values - Technology
-
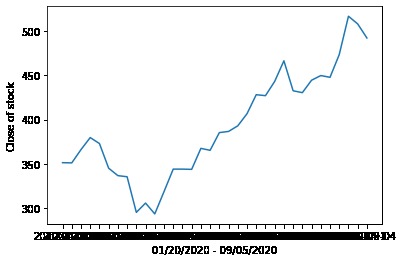
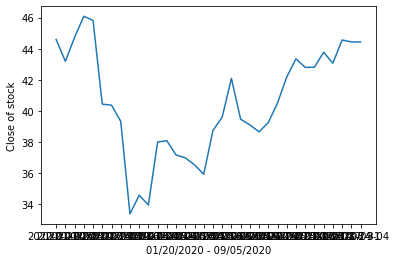
Adobe Actual
-
Adobe Predictive - Media
-
Alphabet Actual
-
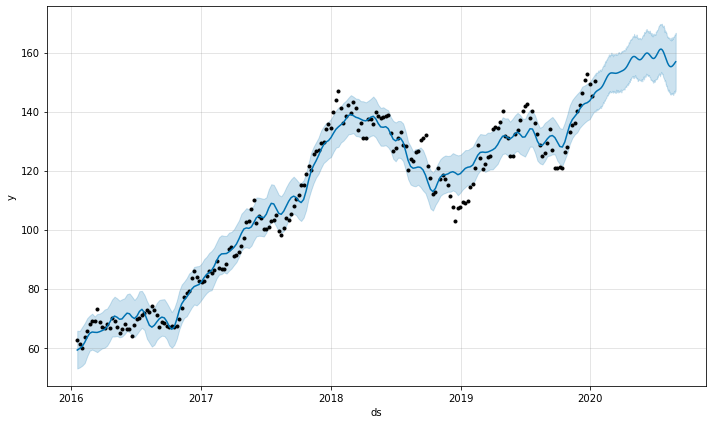
Alphabet Predictive - Technology
-
Comcast Actual
-

Comcast Predictive - Media
-
Ebay Actual
-
Ebay Predictive - E-commerce
-
Shopify Actual
-
Shopify Predictive - E-commerce
-
Marriott Actual
-
Marriott Predictive - Hospitality
-
Facebook Actual
-
Facebook Predictive - Technology
-
Hyatt Actual
-

Hyatt Predictive - Hospitality
-
Hilton Actual
-
Hilton Predictive - Hospitality
-
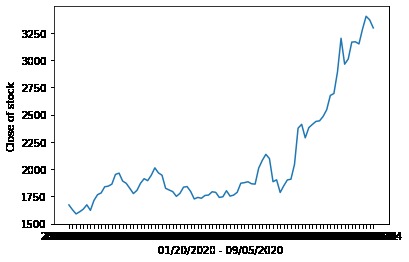
Amazon Actual
-
Amazon Predicitve - E-commerce


Inspiration
When I initially started off investing in the stock market a few months back, I did not know a thing about what affected their growth or loss. Admittedly, I did lose some money because of my over enthusiasm as well as my lack of knowledge about how things worked. I then grew curious to know how real world professionals predicted stock values. In my search, I was introduced to the pandas library and Facebook prophet, as well as python as a programming language which was conducive to statistical analysis. I learnt the basics of how stocks could be predicted in the future based on historical values, and I grew inspired to learn more about predictive modelling.
What it does
This project computes the difference between how Covid-19 has impacted stocks based on comparing predictive modelling from when the first case of Coronavirus was reported in the USA to present day against actual stock values across the same time period. I accessed the stock data through csv files from Yahoo Finance which was then read across pandas library's data frames. Facebook prophet was then used to model the predicitive behavior and pyplots were used to model the actual values. These values could be compared to each other by comparing their respective graphs. A single data point (5th September 2020) was then taken to compute the difference as a rate measure between predictive and actual stock values to determine the positive or negative impact the virus brought about on the stock I further went on to compare it across different industry sectors. I did this by taking some of the top 3 companies across each sector( Technology, Media and Communications, Hospitality, E-commerce) and analyzed whether the average impact across each sector corroborated with intuition and common sense. I found out to no surprise that, e-commerce and media and communications were impacted positively due to increasing virtual content as well as limited mobility. Technology was stable for the most part. It was obvious that due to limited travelling, the hospitality sector was strongly negatively impacted.
How I built it
On Jupyter Notebooks, I used python as my language for this analysis. I used panda library and its data frames to read the csv files. Facebook Prophet interacted with the panda data frames to model a predictive behavior. Matplotlib's pyplot were used to plot the actual data sets. These were then compared to each other to compute my desired value.
Challenges I ran into
I was not able to import interactive plots as well as represent my data in a more effective and efficient manner. I would like to change how I represent my data by plotting my predictive vs actual stock values on a single graph.
Accomplishments that I'm proud of
I'm proud that I was able to learn the basics of Time series forecasting through independent study, and use this knowledge on my first ever hackathon. I didn't realize that data science was so interactive and engaging.
What I learned
I learnt the basics of Facebook prophet and panda library as well as how python can be used not just for algorithmic coding, like I had been taught in class till now (I'm a freshman), but also for various other purposes like statistical modelling.
What's next for Predictive vs Actual Stock Value Analysis due to covid-19
I wish to build upon my knowledge to perform complex statistical analysis on a wide variety of different topics such as r^2 value, correlation, mode, median etc-. I also wish to work more extensively with plots to graph my data in a neat manner.

Log in or sign up for Devpost to join the conversation.