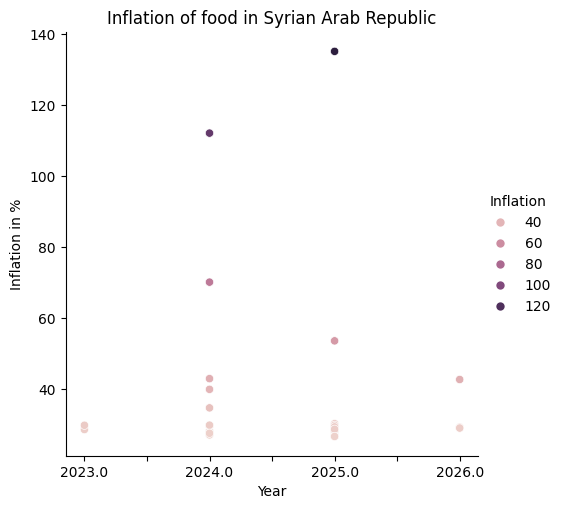
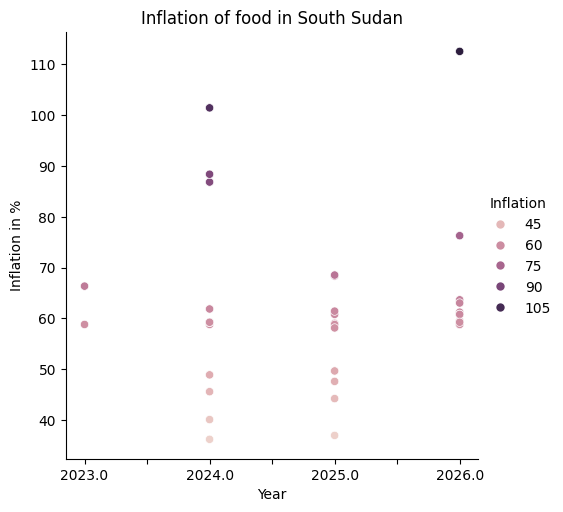
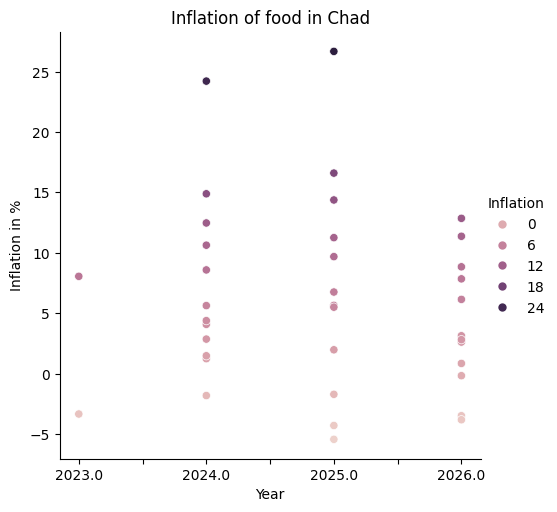
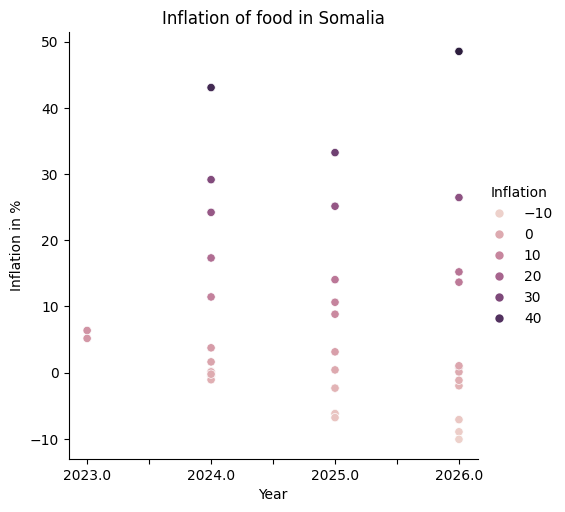
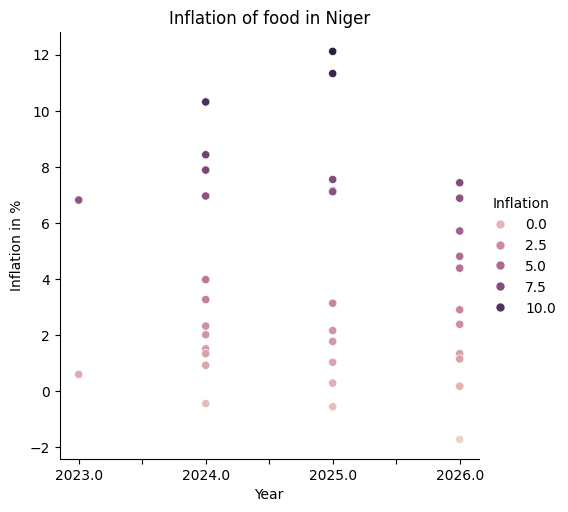
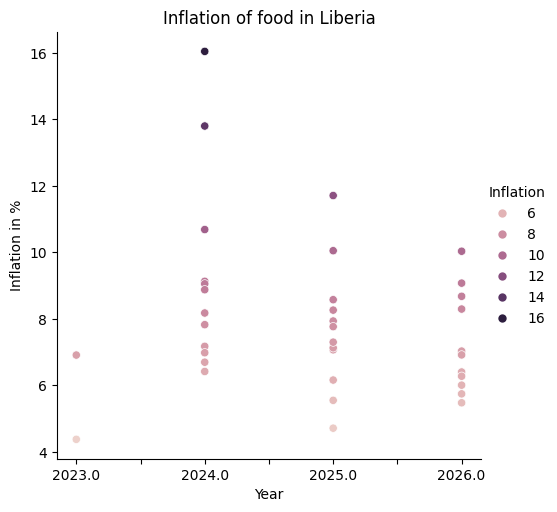
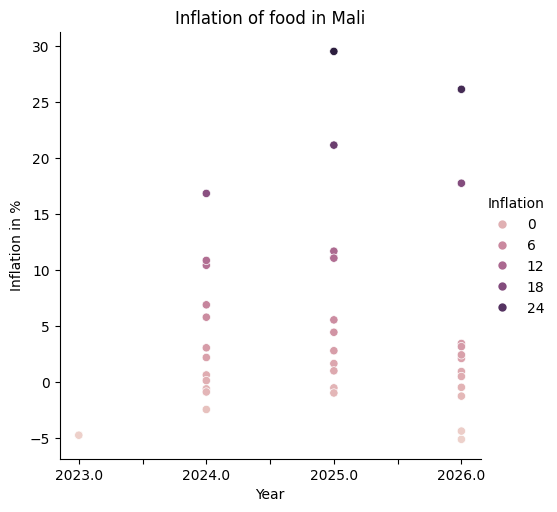
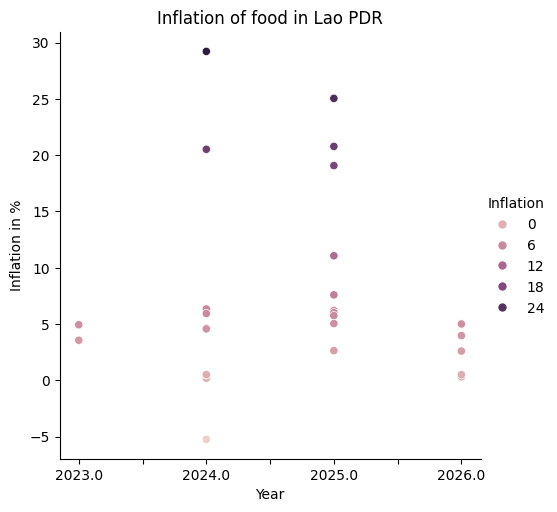
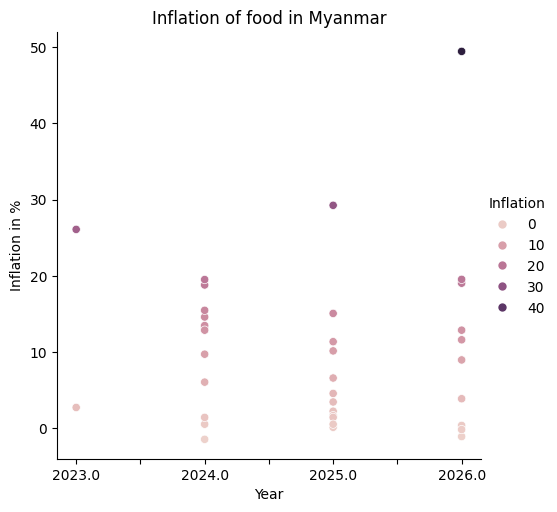
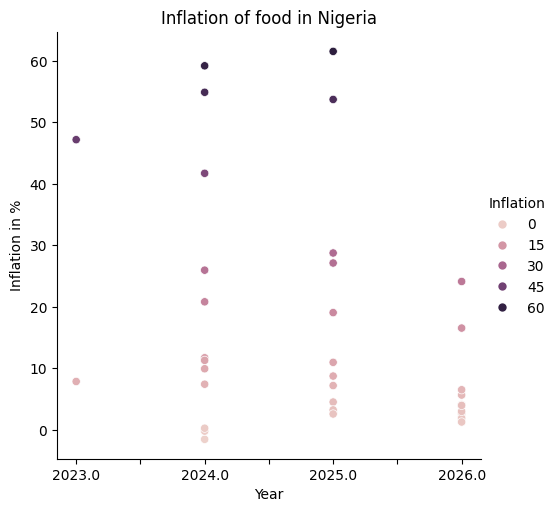
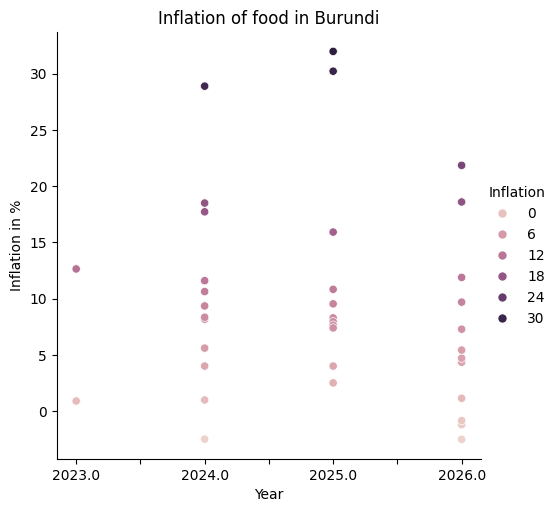
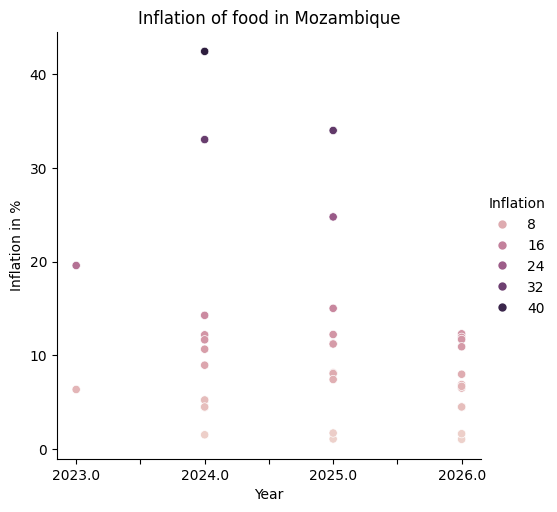
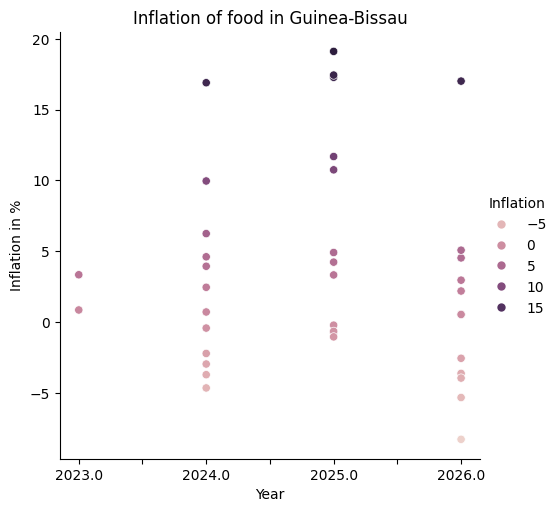
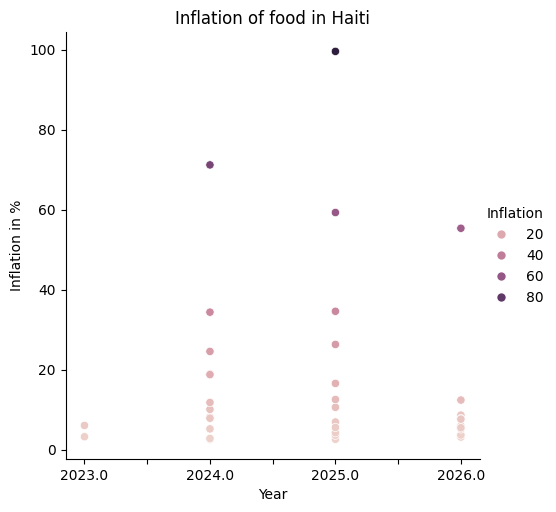
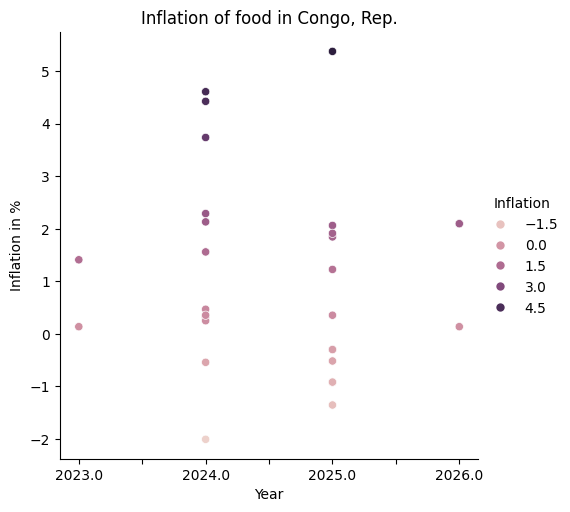
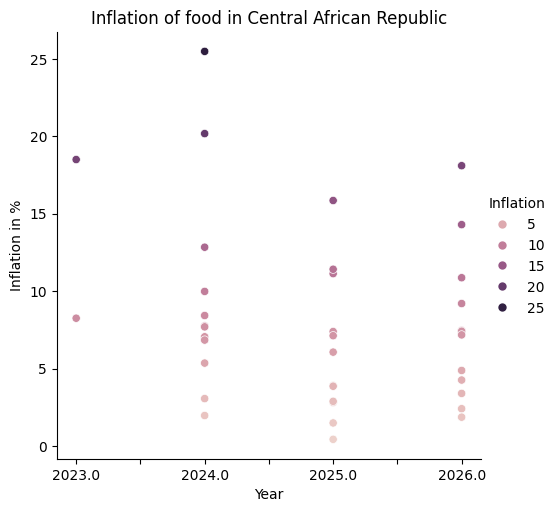
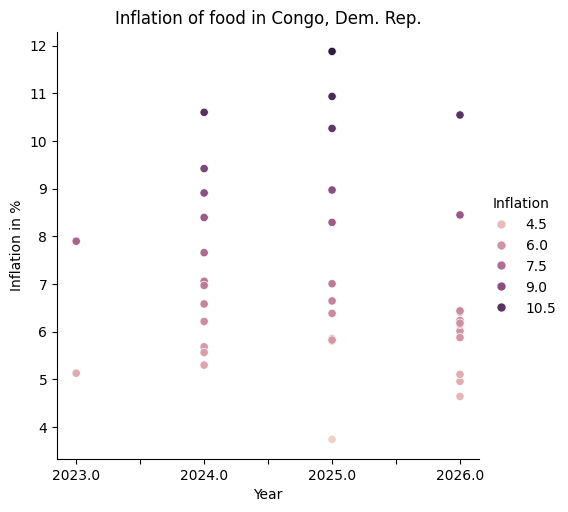
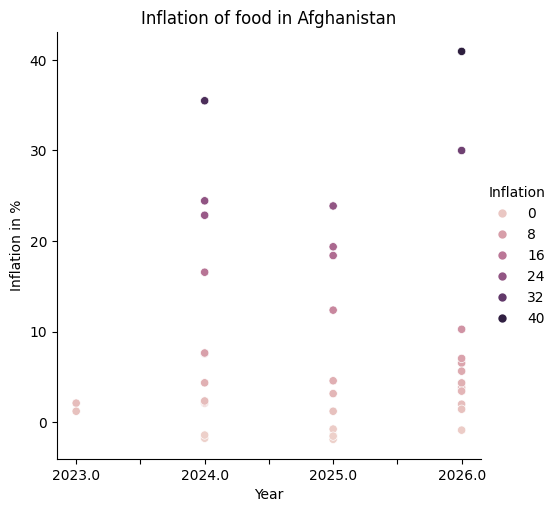
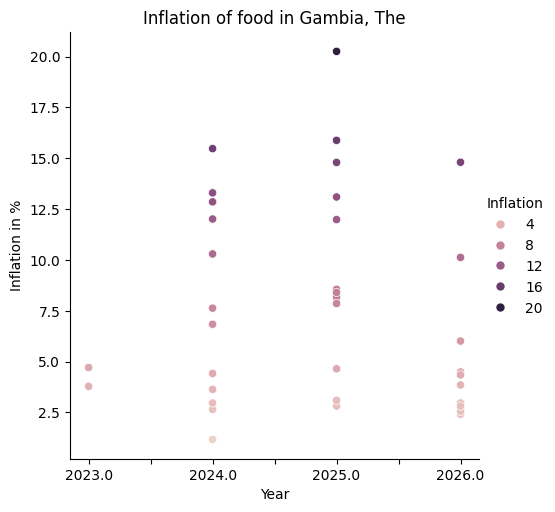
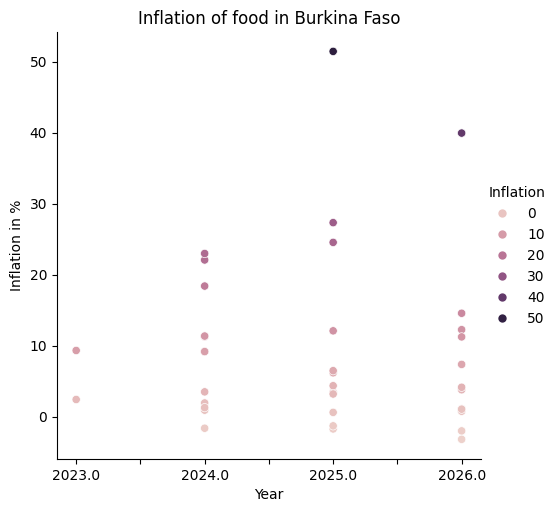
Once we were given the topic of food, we immediately wanted to create our project around machine learning since we were both exposed to it in the past. We spent the first 2 hours finding a dataset that would fit our project. Once we did that, we started creating the model on Google Collab. We used libraries such as Pandas, Seaborn, Numpy, Scikit learn to visualize the data and create our graphs. The final model will output a scatterplot showing what the percentage of inflation will be in a certain country for the next 3 years. The model is able to provide data on inflation for over 20 countries in Africa, The Middle East, and Asia. As a result this can help countries plan better for budgeting and citizens prepare better for food price inflation.
Also, after hearing our guest speaker talk about his experiences, we were very motivated


Log in or sign up for Devpost to join the conversation.