Motivation
Houston has a wealth of data from its 311 records (full span is from November 2011 to present); however, most of the analyses done to date have been focused on descriptive dashboards, or immediate issue resolution. There is an opportunity to use Houston's 311 data to incorporate predictive analytics into city resource planning -- and to prepare for potential issues, before they happen.
 Examples of research questions:
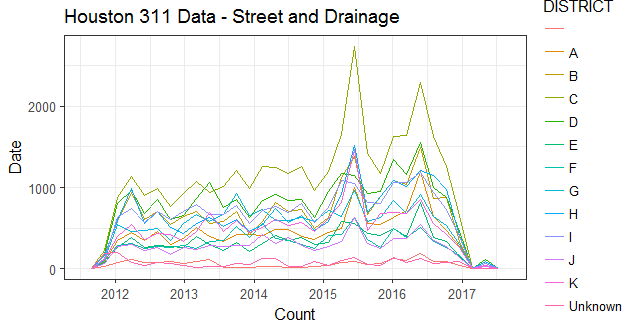
- How do special events (such as the SuperBowl) impact street and drainage-related requests?
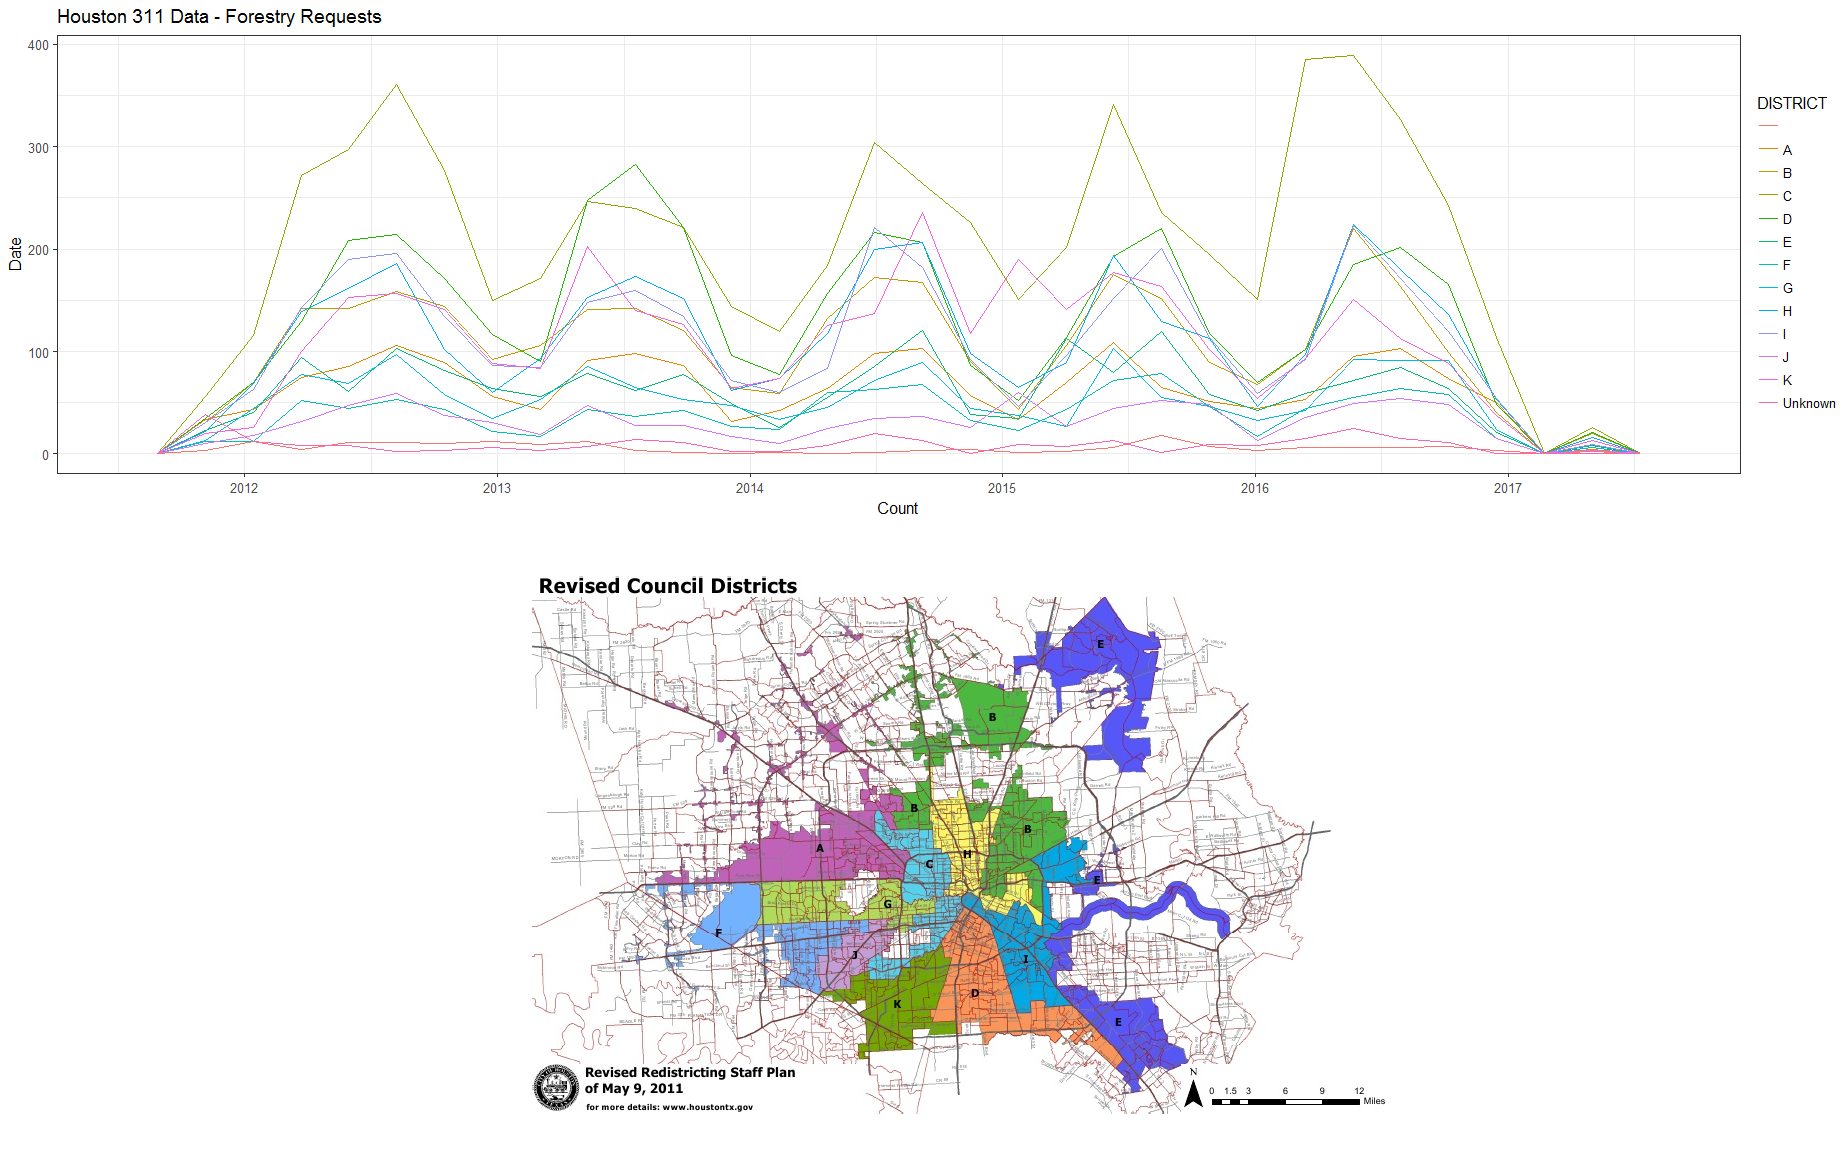
- How does seasonality impact forestry and greenspace 311 requests?
- How many workers should we employ in a given month? Should this number change throughout the year?
- If you'd like to have your 311 request serviced quickly, what is the optimal day of the week to report it?
- Which method of 311 reporting (phone, in-person, email, etc.) is most effective?
- Are some neighborhoods' issues more quickly resolved than others?
- Is there a correlation between water main breakages and animal nuisance reports?
- Is there a recurrence of infrastructure-related issues in a given neighborhood?
- How should those recurrences inform decisions about updates to water and sewage systems?
- How can 311 requests inform policy makers and local politicians about their constituents' issues?
What it does
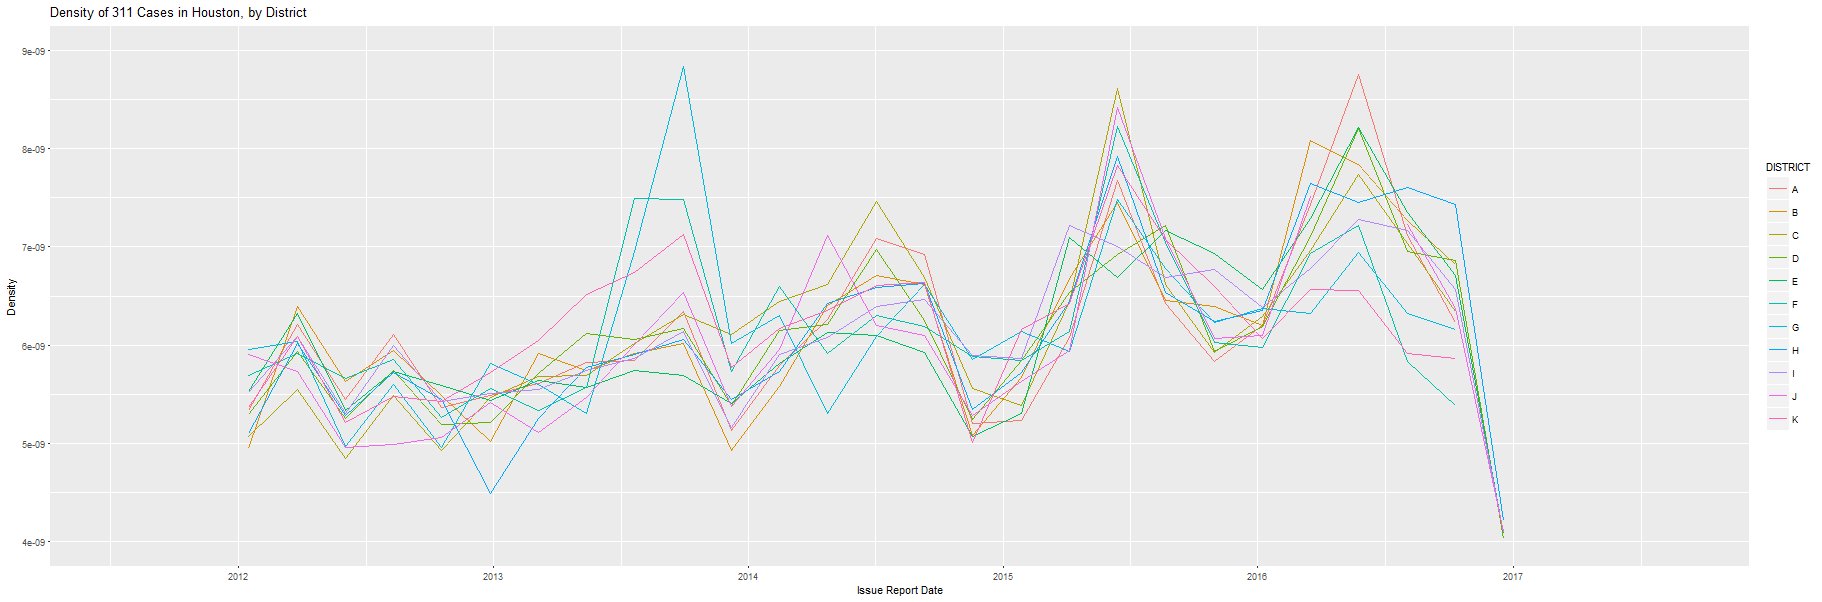
This project is focused on exploratory data analysis for predictive modeling on Houston's 311 data. The predictive model will estimate time to resolution for a number of city issues, and anticipate additional resource needs due to seasonality, special events, and weather. The output from this model can also be used to track endemic, service-related issues in certain neighborhoods, and can be used to inform policy makers and local politicians about their constituents' issues.
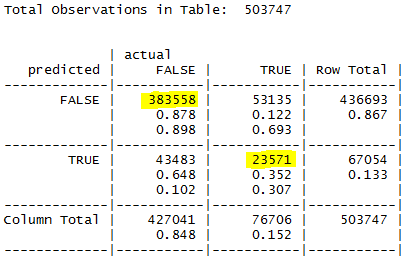
A first, untuned pass using Naive Bayes was implemented during this hackathon, to determine likelihood of overdue issue resolution (based on 28 features including neighborhood; day of week the request was issued; type of request; and servicing department).
How I built it
The visualizations were developed using RStudio as a development environment.
Packages include the following:
ggmap : map visualizations and geospatial analysis
ggplot2 : data visualization
dplyr : sane data manipulation
lubridate : time series data and analysis
Challenges I ran into
- Zip codes: not easily obtained, decided to pivot to neighborhoods.
- Data cleaning tasks
- Removal of NA values, and incomplete records
- Creation of additional features for machine learning
What's next for Predictive Analytics for Smarter Houston City Services
Next step: a free workshop on machine learning for 311 data resolution times using Azure ML Studio. https://www.eventbrite.com/e/getting-started-with-azure-machine-learning-studio-tickets-34577913470
This workshop will be the first step in creating a dashboard for smarter, predictive Houston city service analytics.
Built With
- dplyr
- ggmap
- ggplot2
- lubridate
- r
- rstudio


Log in or sign up for Devpost to join the conversation.