Inspiration
Prediction markets have exploded in popularity, trading millions daily on everything from elections to sports. But with that growth comes risk - market manipulation, coordinated betting, and insider trading can trap unsuspecting traders. I wanted to build a tool that democratizes market intelligence, helping everyday traders spot red flags before placing bets.
What it does
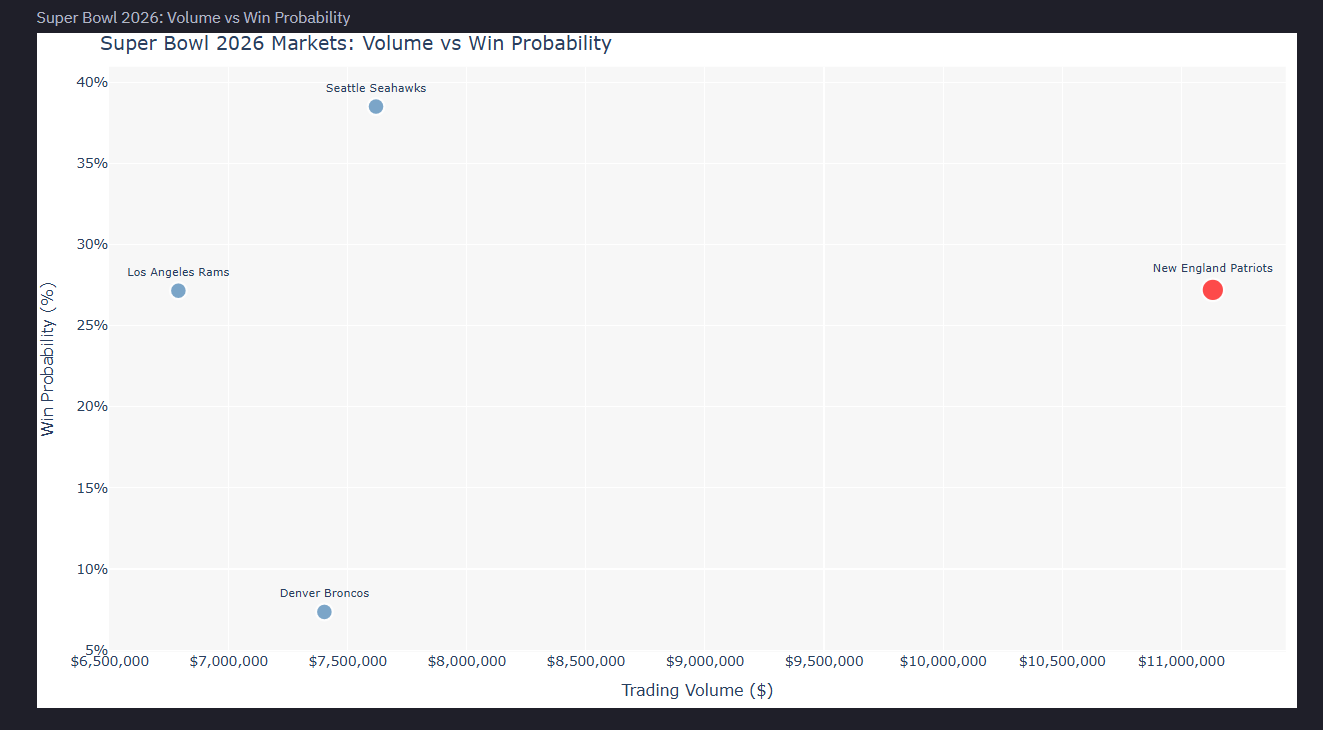
An interactive dashboard that analyzes the top 20 most active Polymarket prediction markets, using statistical methods to identify anomalous trading patterns. The tool calculates volume z-scores, risk scores, and visualizes the relationship between trading volume and win probability.
How we built it
- Data Collection: Used Polymarket's public CLOB API to fetch real-time market data
- Statistical Analysis: Calculated mean, standard deviation, and z-scores for volume anomaly detection
- Risk Scoring: Built a composite risk score (0-100) based on volume deviation, liquidity ratios, and probability mismatches
- Visualization: Created interactive scatter plots and detailed market breakdowns
- Dashboard: Leveraged Hex's App Builder to turn analysis into an interactive tool with team selection and real-time updates
Challenges we ran into
- Data Structure Complexity: Polymarket's API returns deeply nested JSON with inconsistent fields. I had to carefully parse and flatten the data.
- Finding the Signal: With 20 markets, identifying which metrics actually indicate manipulation required testing multiple approaches.
- Balancing Interactivity: Making the dashboard interactive without overwhelming users with too many options.
- Statistical Validity: Ensuring my anomaly detection thresholds (2σ) were statistically sound and not generating false positives.
Accomplishments that we're proud of
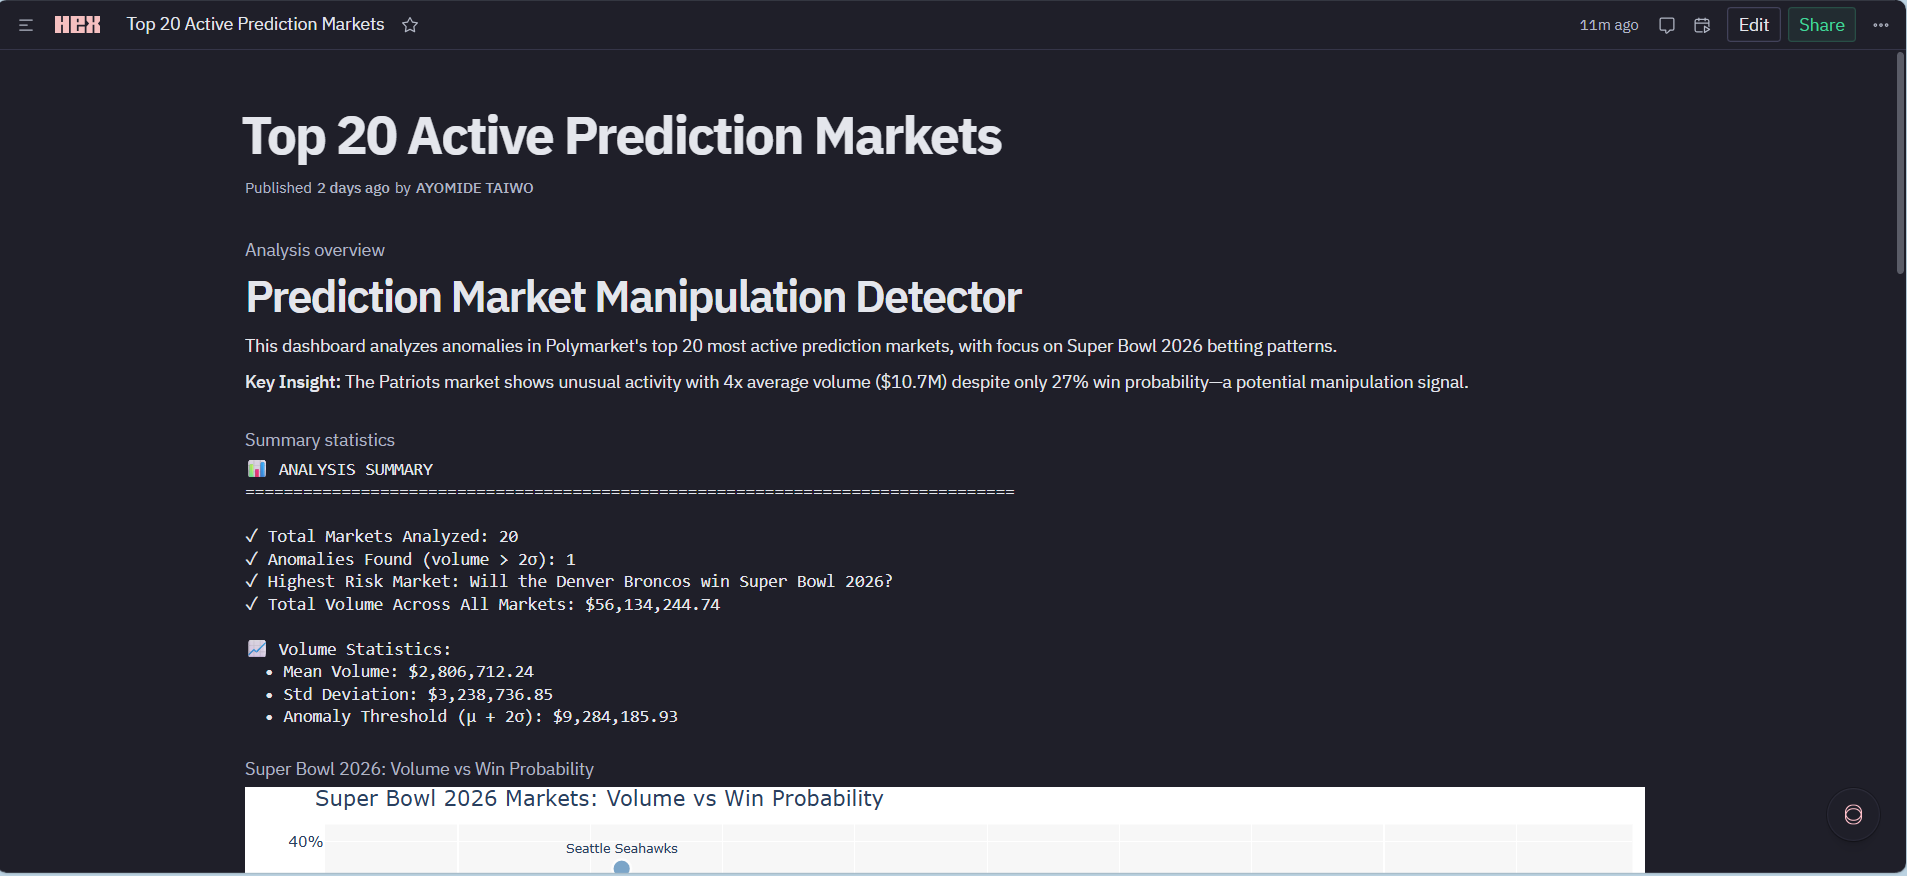
1. Found a Real Anomaly I didn't just create pretty visualizations - I discovered an actual suspicious pattern in live market data. The Patriots market anomaly (4× volume, 2.57σ above mean) is statistically significant and genuinely newsworthy.
2. Built End-to-End in Hours From zero to a fully functional, interactive dashboard analyzing $56M in live trading data - all in a single hackathon sprint. Hex's tools made rapid iteration possible.
3. Made Complex Analysis Accessible Transformed statistical anomaly detection (z-scores, standard deviations, risk modeling) into an intuitive interface that anyone can understand and use - no PhD required.
4. Created Actionable Intelligence This isn't just analysis for analysis' sake. Traders can actually use this tool right now to avoid risky markets. The 79.4 risk score on the Patriots market is a clear warning signal.
5. Leveraged AI Effectively Used Hex's AI assistant not as a crutch, but as a force multiplier - allowing me to focus on insights and storytelling while automating the tedious coding work.
6. Professional Polish Clean UI, interactive elements, proper statistical methodology, and compelling data storytelling. This feels like a production tool, not a hackathon hack.
What we learned
- How to work with prediction market APIs and complex nested JSON structures
- Statistical anomaly detection techniques for financial data
- The power of Hex's AI assistant for rapid prototyping and iteration
- How to tell a compelling data story through interactive visualizations
- The importance of making complex analysis accessible to non-technical users
What's next for Prediction Market Manipulation Detector
- Expand to analyze all Polymarket markets, not just top 20
- Add historical trend analysis to track manipulation over time
- Implement real-time alerts for new anomalies
- Create a manipulation probability model using machine learning
- Add social sentiment analysis from Twitter/Reddit for correlation

Log in or sign up for Devpost to join the conversation.