Inspiration:
Prediction markets contain valuable signals about public belief, risk, and future outcomes, but the data is often large, complex, and difficult to analyze.
This project was inspired by the need to make prediction market intelligence easy to explore, visualize, and understand through an interactive dashboard.
What it does:
Prediction Market Intelligence is a web-based analytics dashboard that allows users to:
- Explore prediction market events across multiple categories
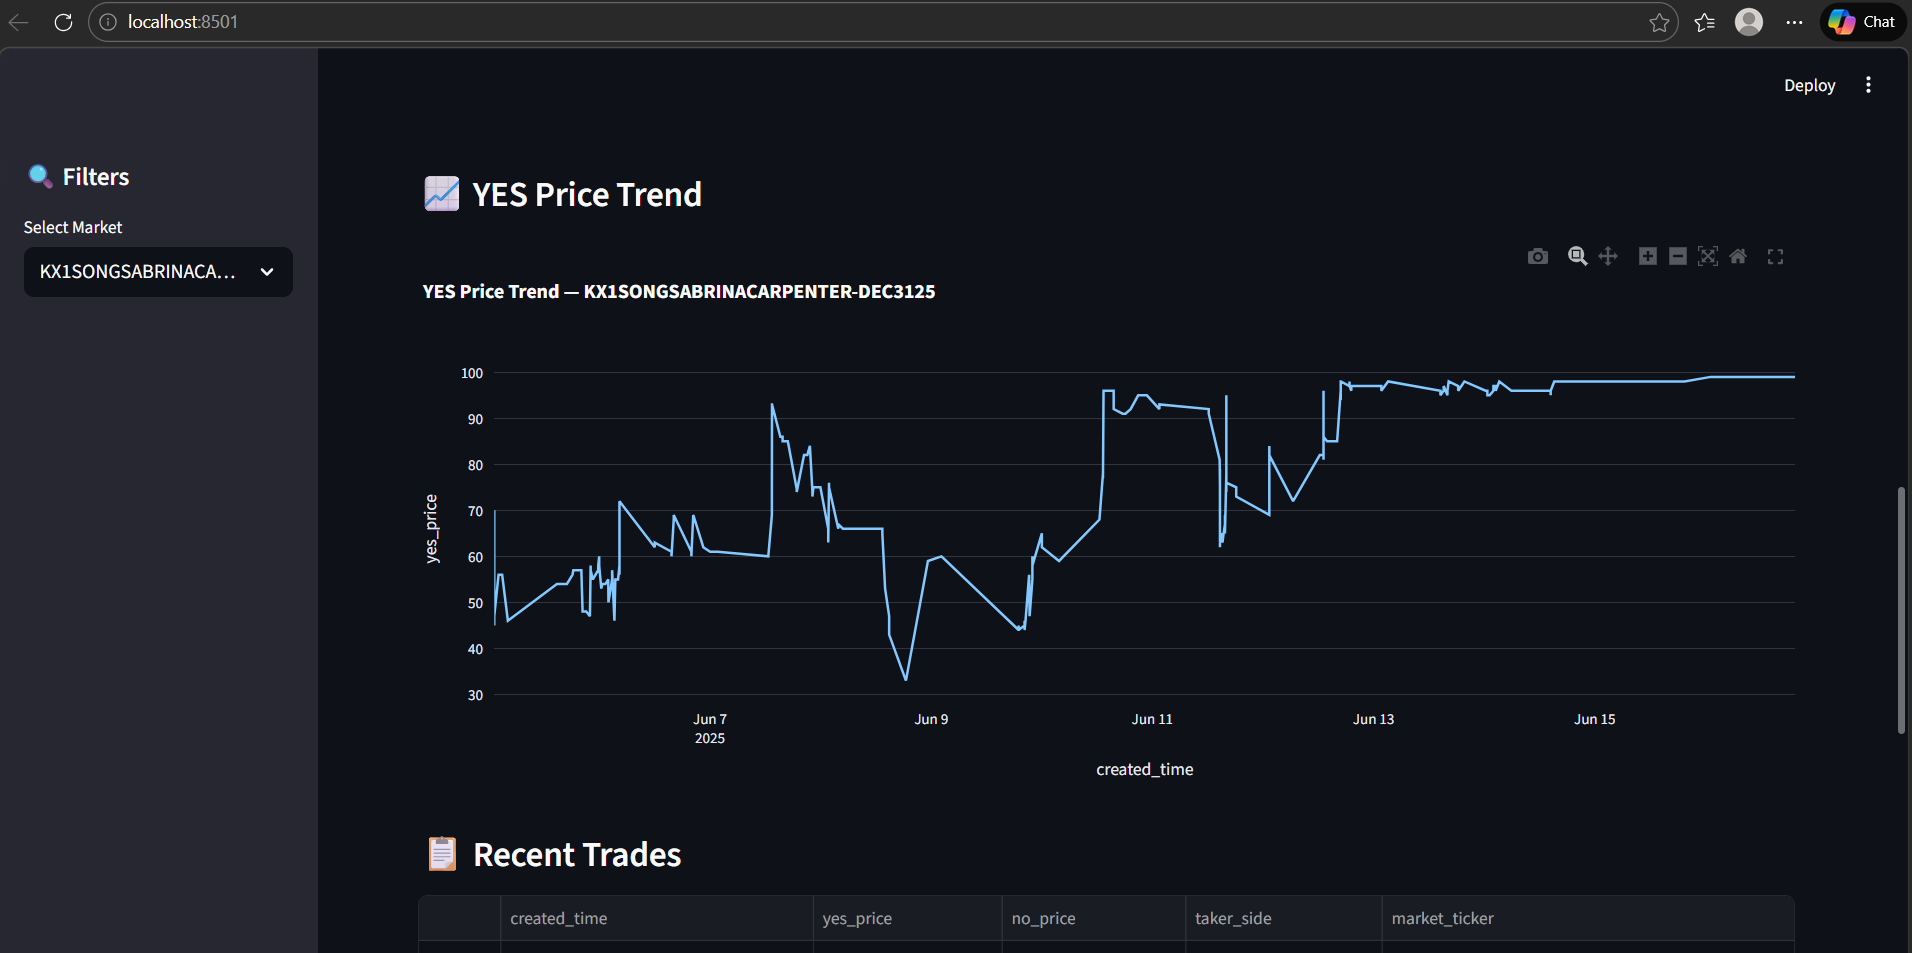
- Analyze YES/NO price distributions
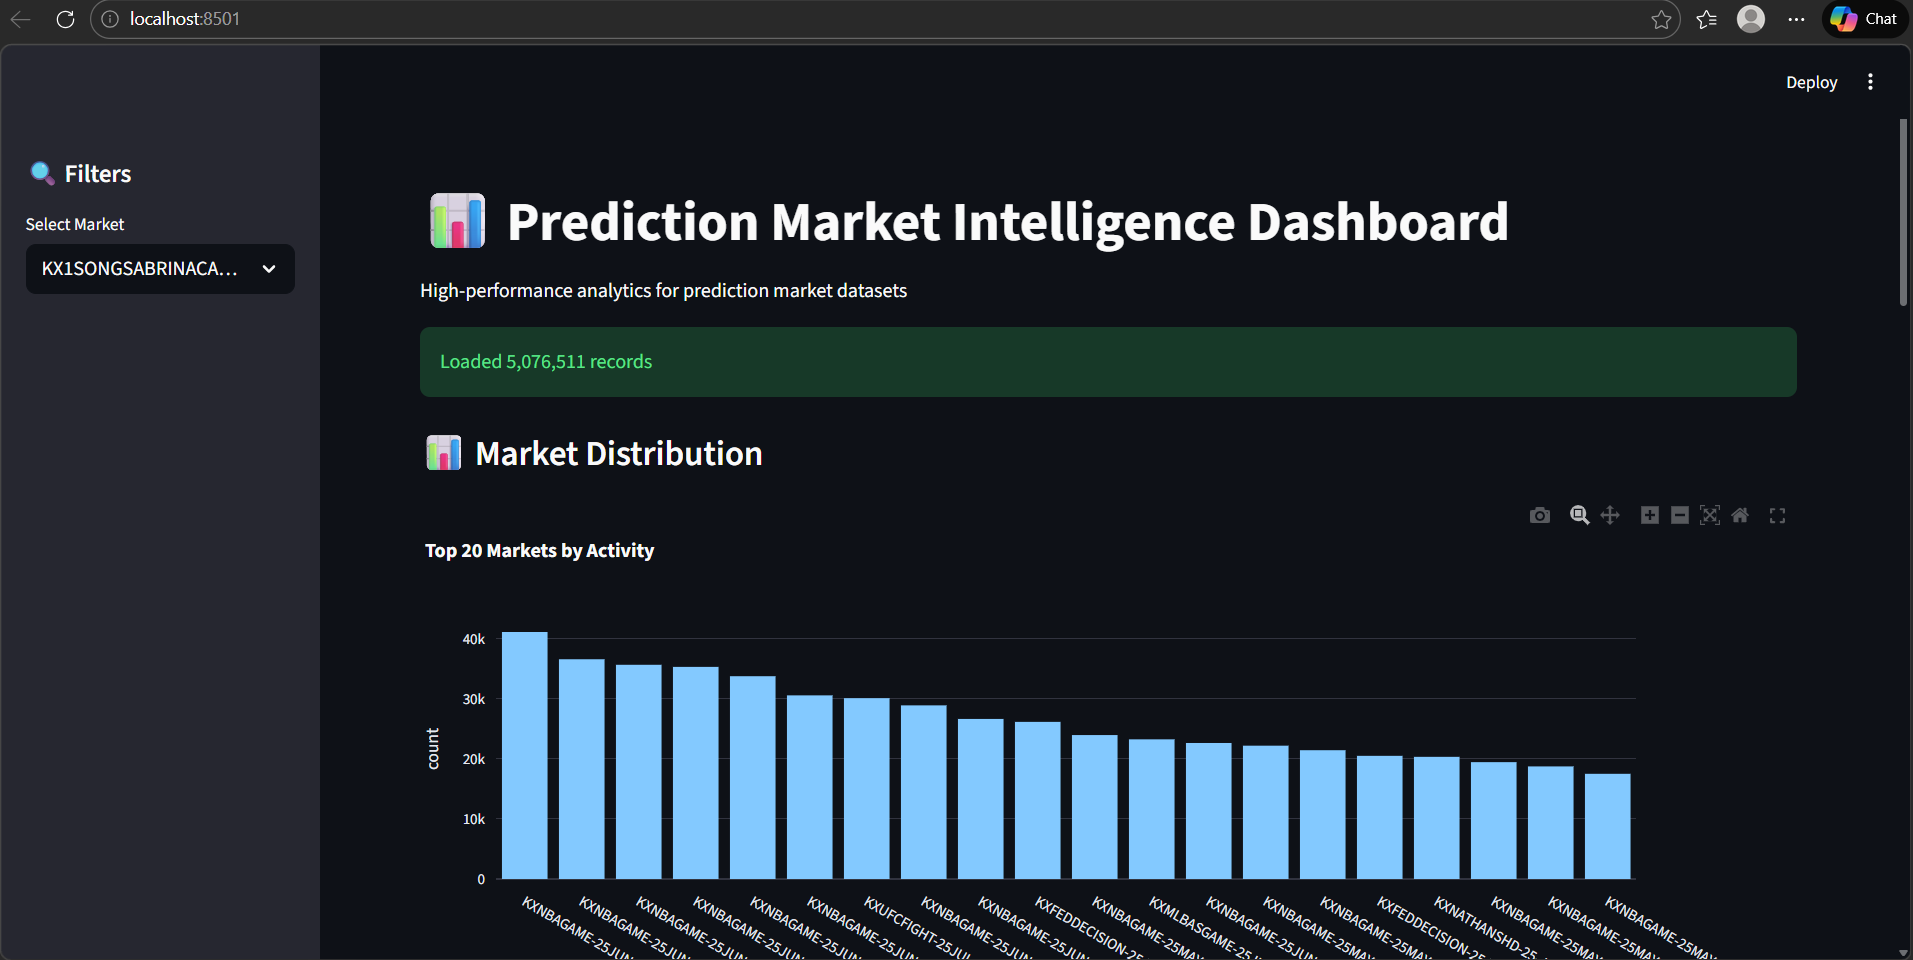
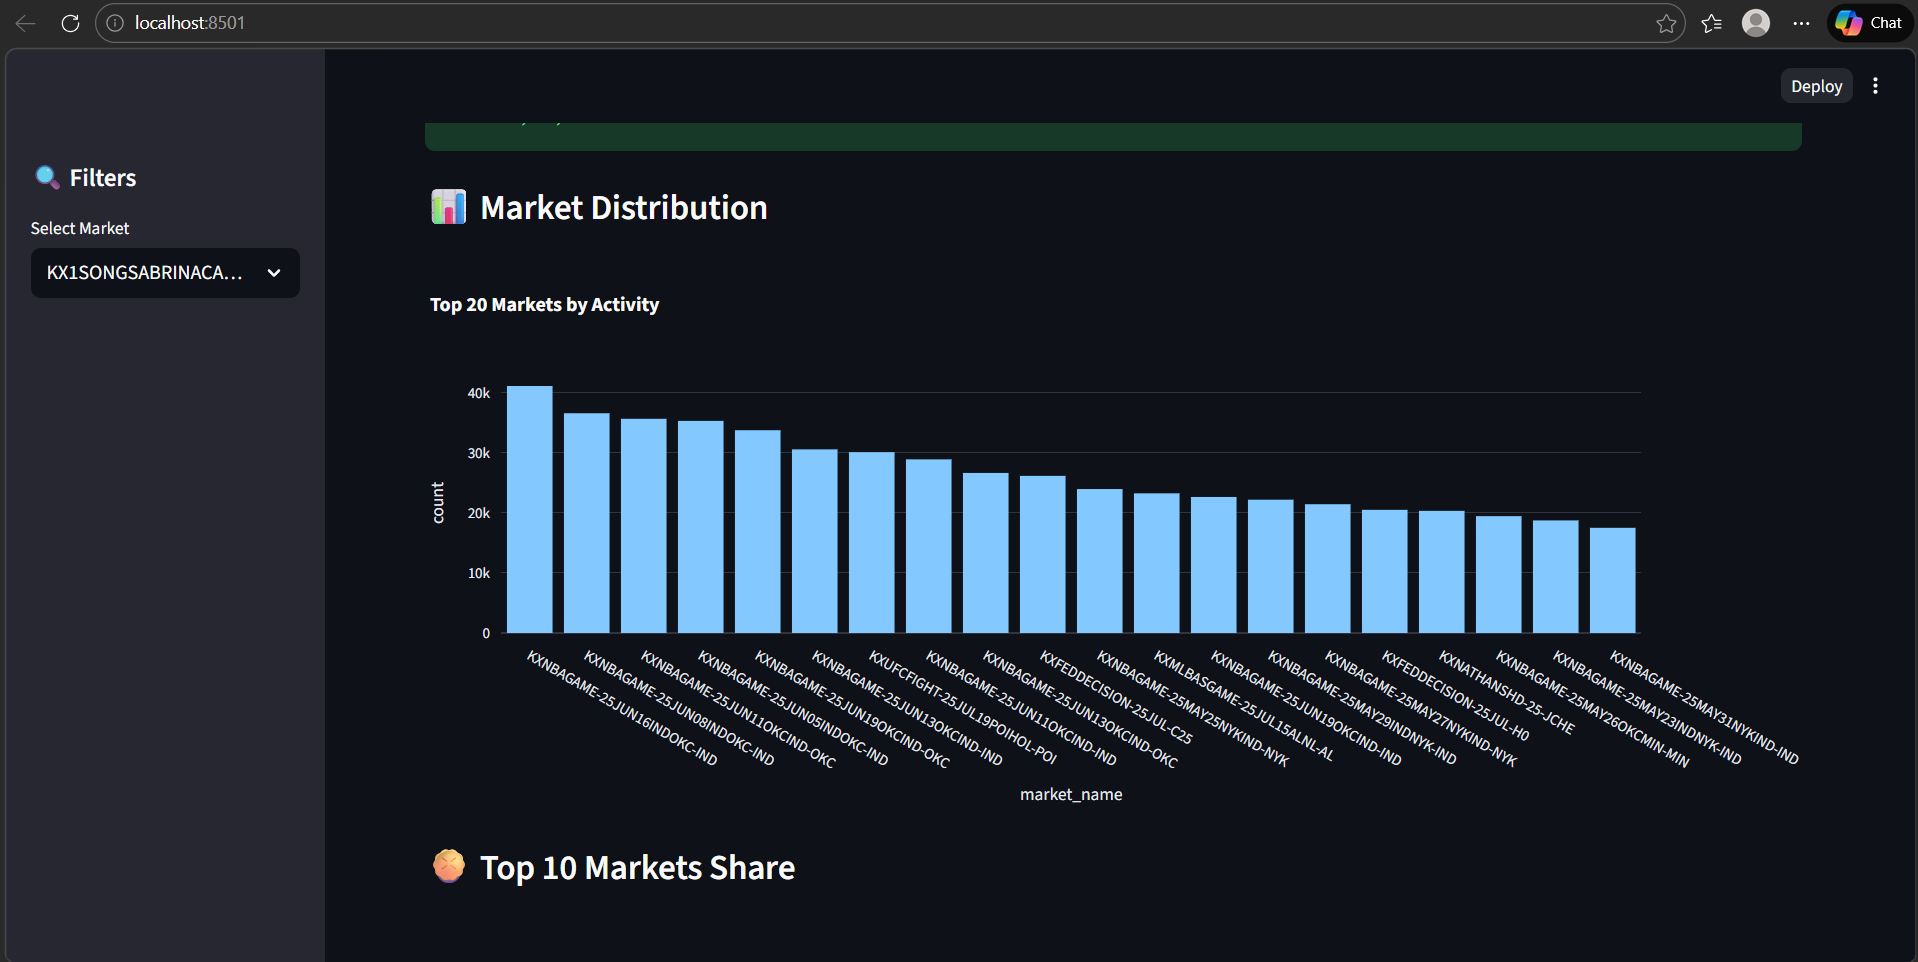
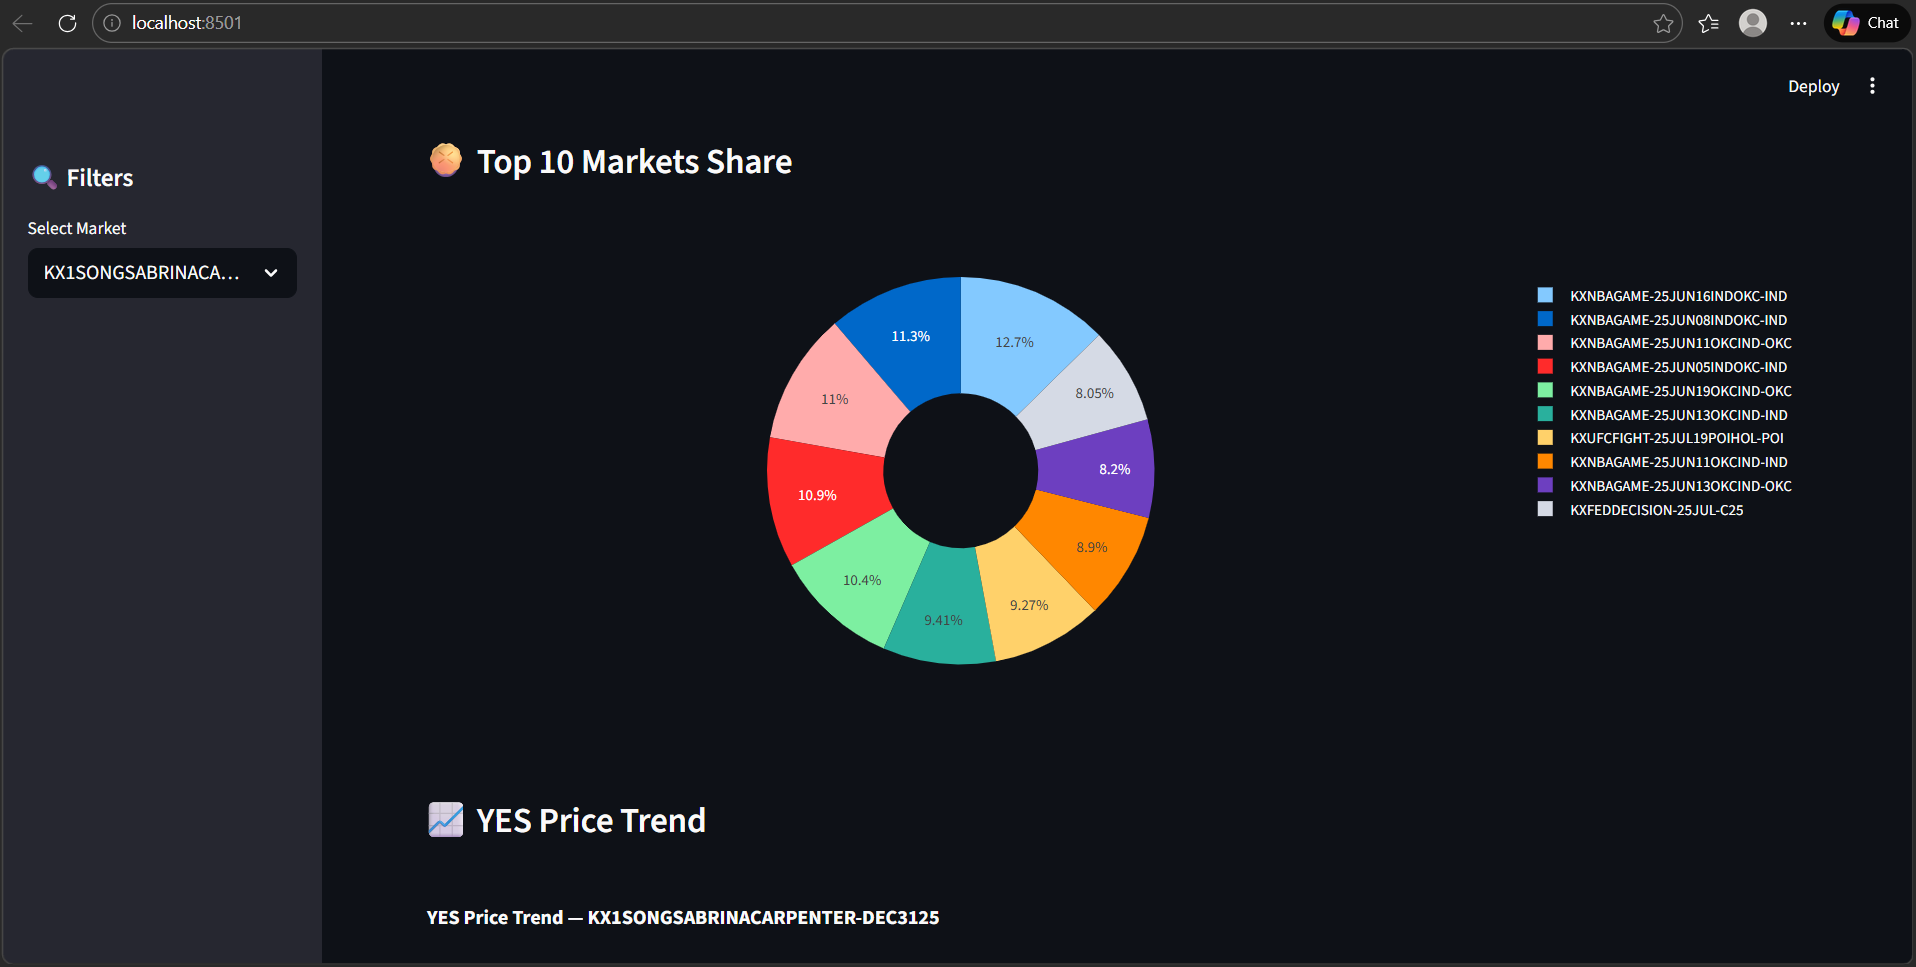
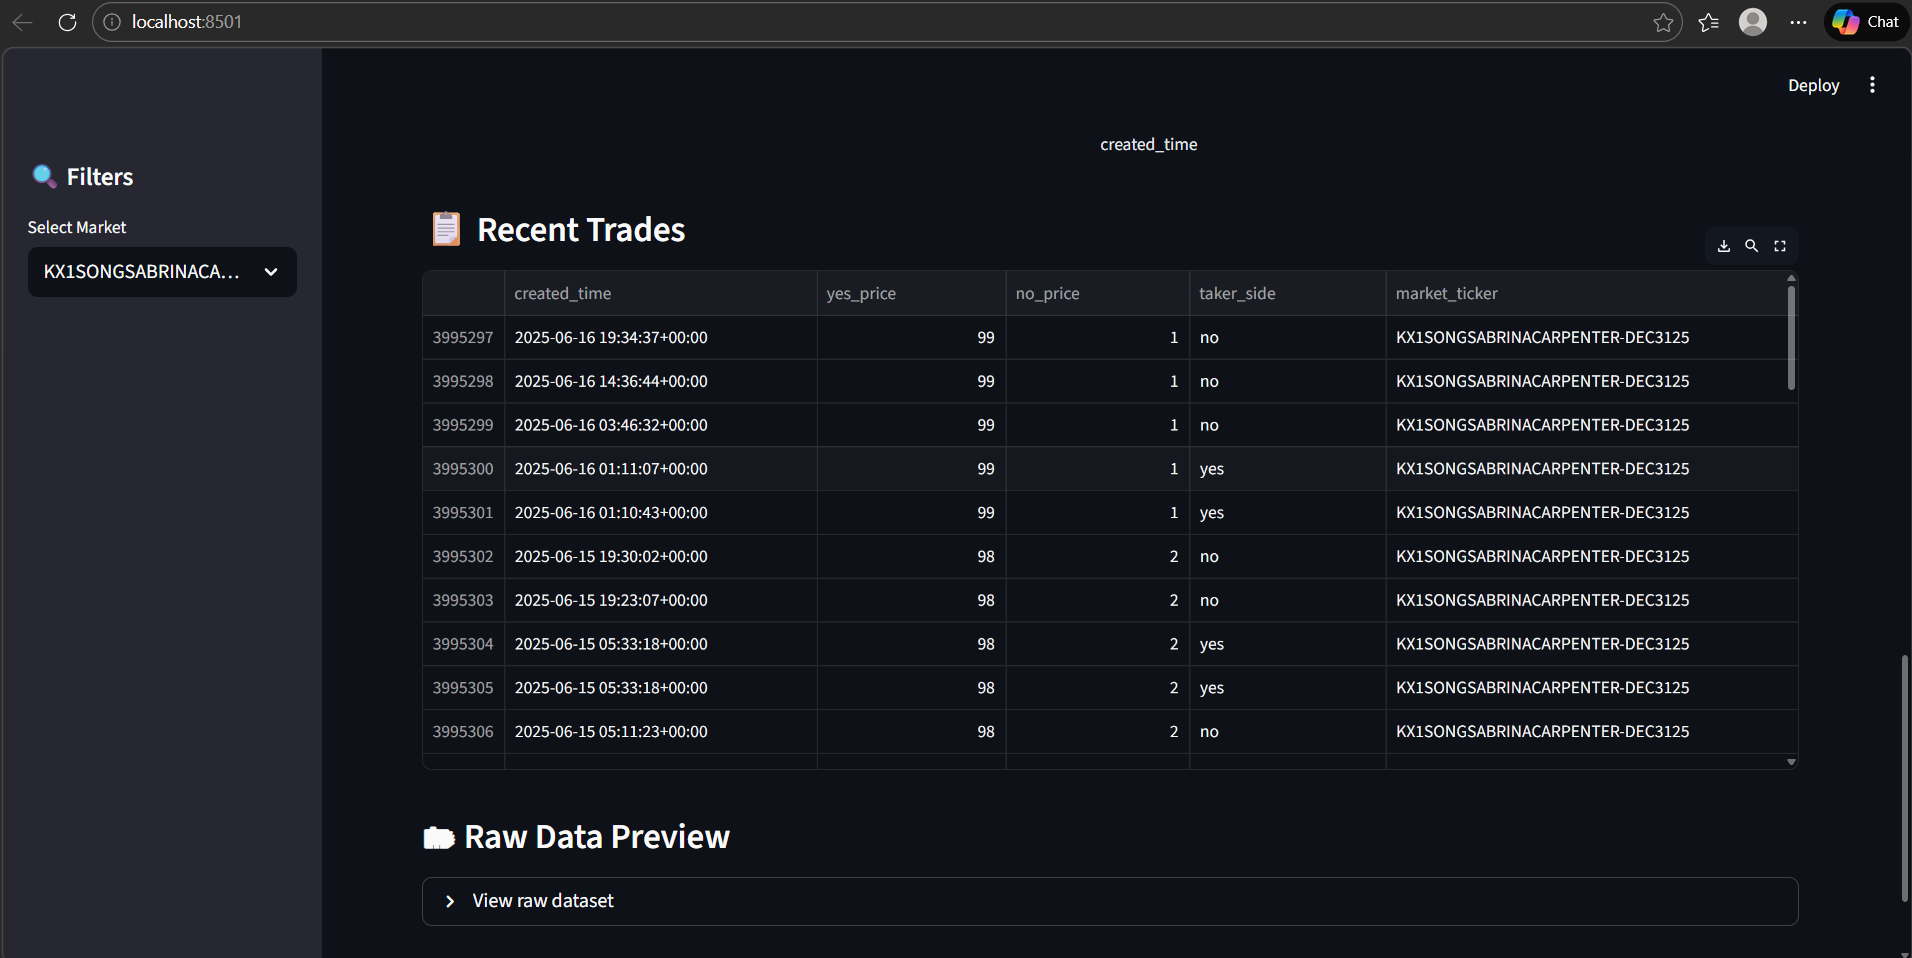
- View market volume trends and top markets
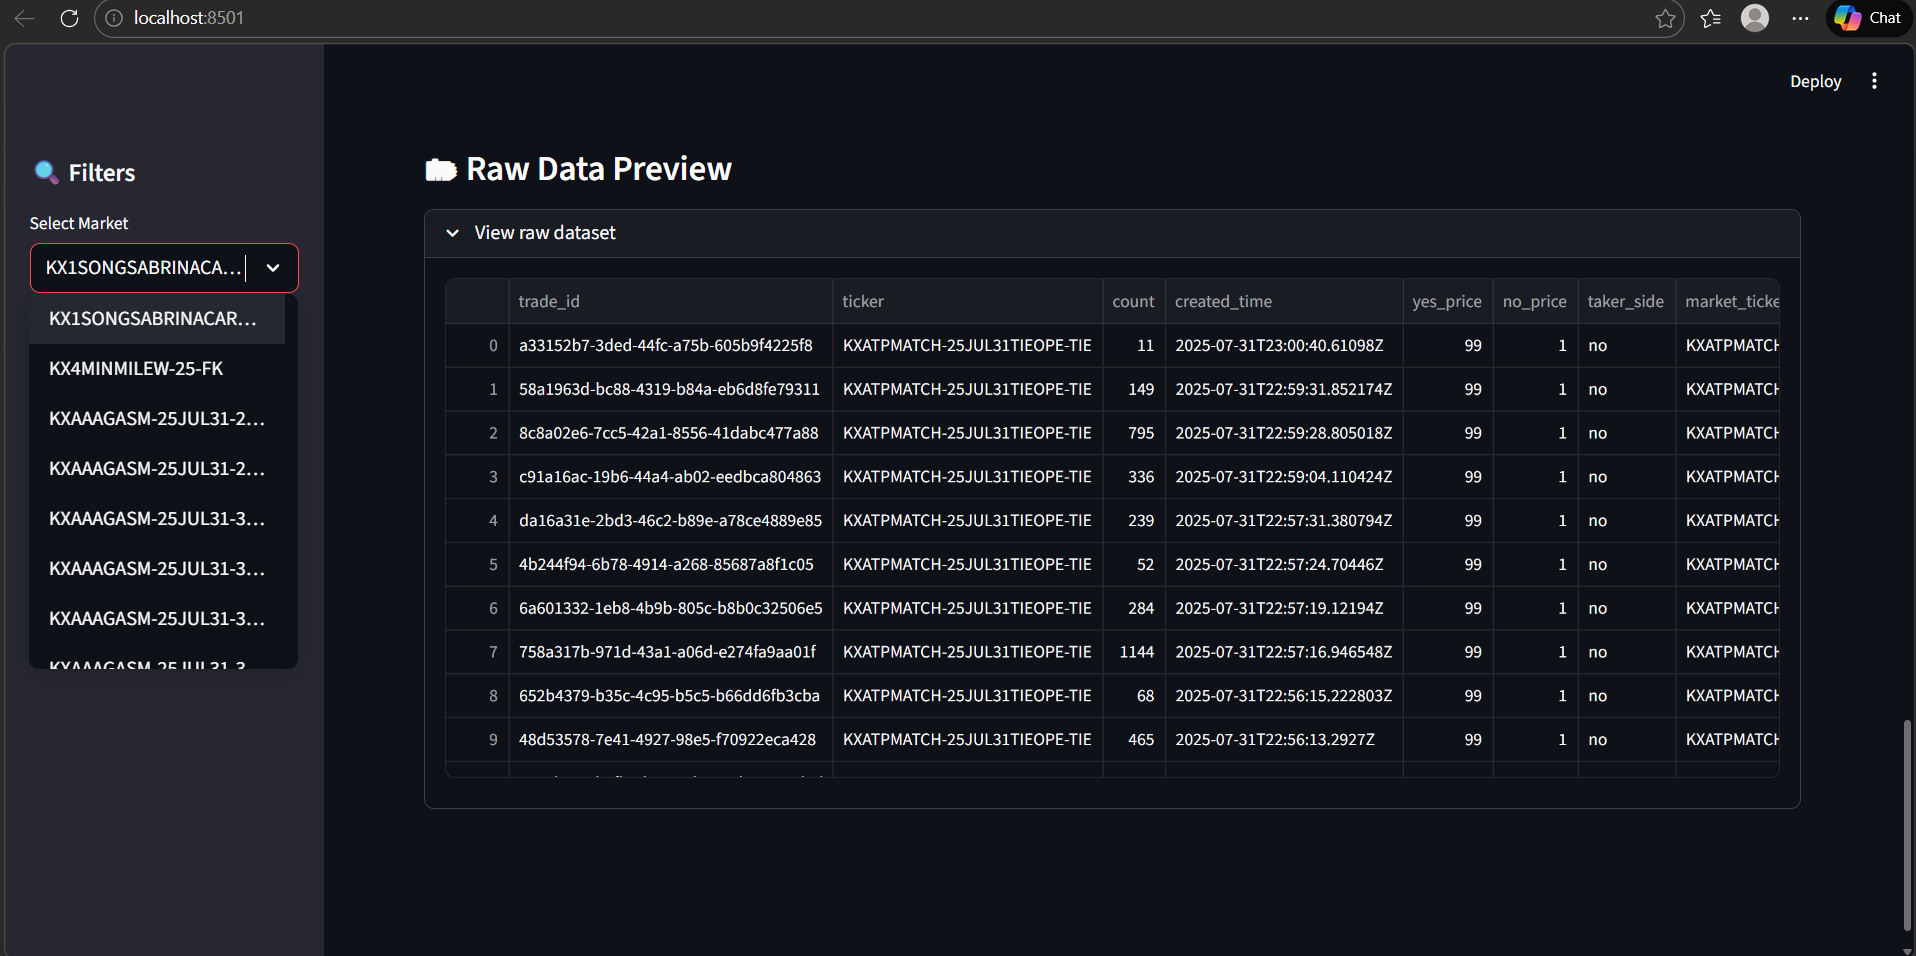
- Filter markets by category
- Understand market sentiment through interactive charts and tables The app transforms raw prediction market data into clear insights and visual intelligence.
How we built it:
The application was built using:
- Streamlit: for the interactive web interface
- Pandas: for data processing and analysis
- Plotly: for interactive charts and visualizations
- Apache Parquet:(original dataset) for efficient large-scale data storage
- Python: as the core programming language A modular structure was used, separating data loading, analytics, and UI logic for better maintainability.
Challenges we ran into:
- Handling very large datasets (over 100MB+) during deployment
- Streamlit Cloud limitations with large file sizes
- GitHub file size restrictions requiring Git LFS
- Ensuring the app remains responsive and loads quickly
- Debugging deployment issues that caused blank screens To overcome this, a sample dataset was used for live deployment while keeping full dataset support for local execution.
Accomplishments that we're proud of:
- Successfully designed a clean, functional prediction market analytics dashboard
- Built interactive charts, metrics, and tables that mirror real-world market analysis
- Structured the project professionally with reusable modules
- Deployed a working demo suitable for hackathon evaluation
- Clearly documented scalability for full dataset usage
What we learned:
- How to design data dashboards for large-scale datasets
- Best practices for Streamlit deployment and performance
- Managing large files with Git and deployment constraints
- Writing clean, modular, and production-ready Python code
- Communicating technical limitations transparently in real-world projects
What's next for Prediction Market App:
- Full deployment with the complete prediction market dataset
- Advanced analytics such as trend prediction and volatility tracking
- User authentication and saved market views
- Real-time data updates from prediction market APIs
- Enhanced UI with advanced filtering and comparison tools
⚠️ Note: The live app is intended to use the full prediction market dataset.
The dataset is very large, so the live deployment takes time to load.
For demonstration, all features, charts, and tables can be seen in the video demo and the GitHub repository.

Log in or sign up for Devpost to join the conversation.