
Introduction
Toronto’s real estate market is a rapidly evolving landscape that holds significant interest for various stakeholders, including homebuyers, investors, real estate agents, and city planners. The city’s continuous growth and urban expansion contribute to fluctuating property values, influenced by factors such as neighborhood amenities, proximity to public transit, and broader economic conditions. Understanding and predicting these market trends is essential for informed decision-making. However, the complexity of the market poses a problem in making predictions based on data about location, size, and other important factors. This problem, if solved, could aid people looking to buy property search and understand the impacts of apartment features on the price, landlords set fair prices, and even policy makers into understanding the effects of locations and other features into why is the market the way it is.
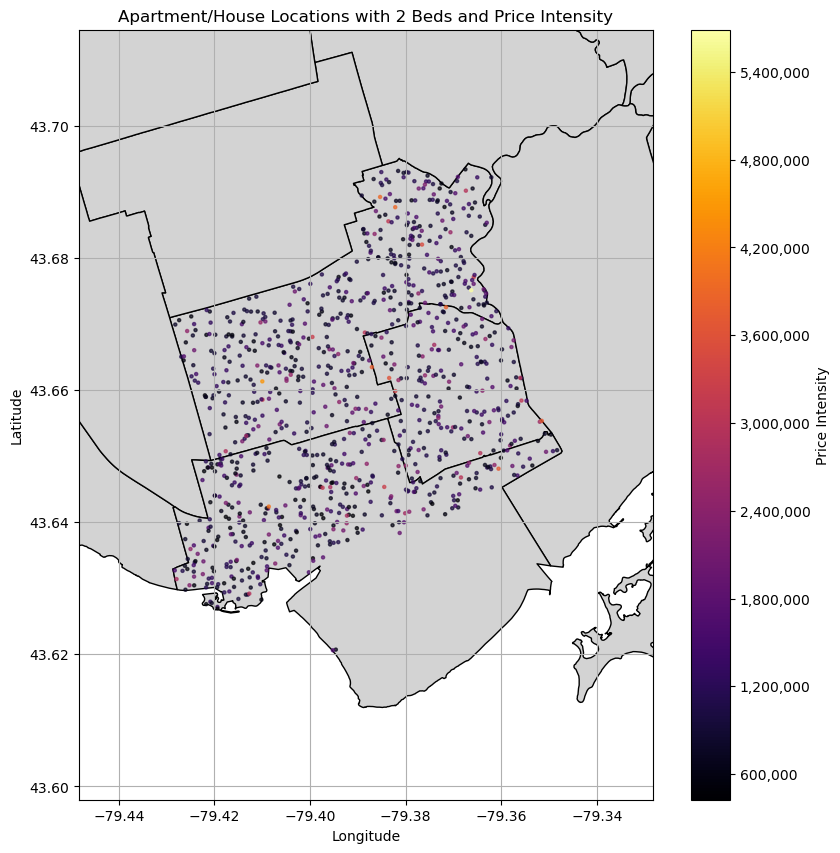
In this project, we used data from the City of Toronto Open Data Portal and python library GeoPandas. This helped us create map visualizations of the properties.
Assumptions of the Analysis
We dealt with the missing data in some columns by using reasonable measures of central tendencies, for example, using the mode for the number of beds to replace null values, which, for the purpose of analysis and developing an accurate model, reduced the impact that these missing values would have while also ensuring that we could work with most of the dataset with significant confidence. Similarly, we assumed certain parameters when assesing the weight of variables like the ward location, giving it a small weight based on the strength of the correlation between ward and price.
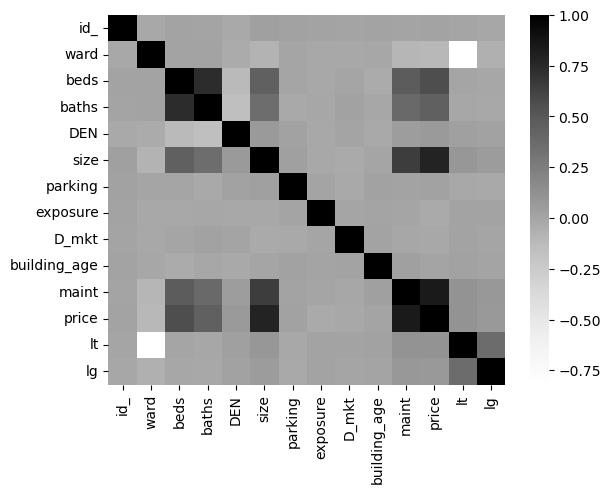
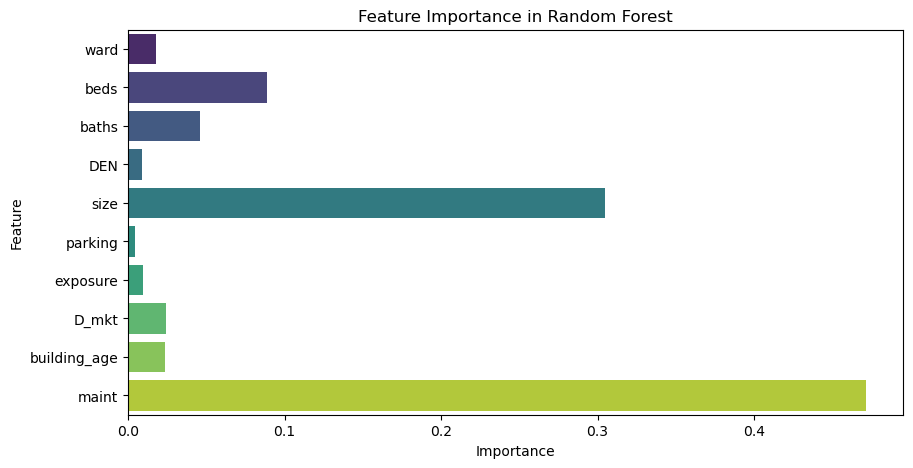
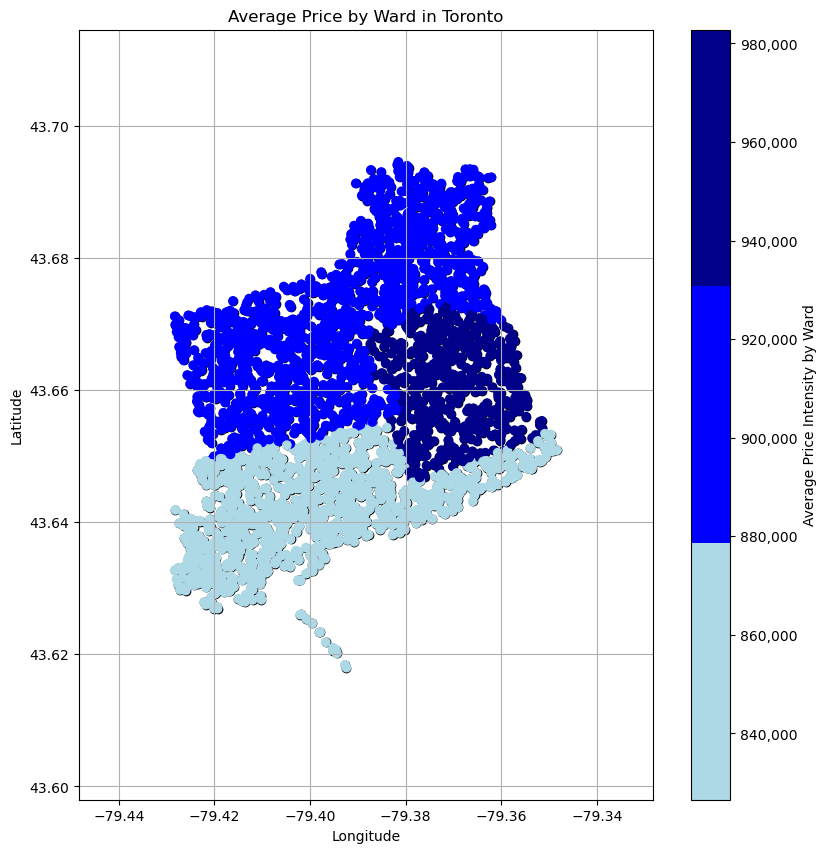
Analysis of the Data and Key Findings Based on the above assumptions, we have found many observable patterns in the data: One of the most significant factor affecting the price of properties in Toronto was the size of the property. Toronto is a rapidly growing city and property prices have steadily increased over the years, recovering well from the drop in prices during the pandemic. The constant influx of people looking to buy properties, especially in the downtown area in Wards 10, 11 and 13, has made demand for all types of properties to go up. Another significant finding we have found in the data is that maintenance fees and property size is strongly correlated ,with a value of greater than 0.8, which means that there is a very high chance that these variables may be dependent on each other. This makes sense because a larger property size incurs more maintenance fees in Toronto. In fact, while building age was also correlated to maintenance fees, it was not as significant as property size correlating to maintenance fees. The average price distribution per ward was highest in Ward 13. The following map illustrates this finding:
Analysis of the Data and Key Findings Based on the above assumptions, we have found many observable patterns in the data:
The most significant factor affecting the price of properties in Toronto was the size of the property. Toronto is a rapidly growing city and property prices have steadily increased over the years, recovering well from the drop in prices during the pandemic.1 The constant influx of people looking to buy properties, especially in the downtown area in Wards 10, 11 and 13, has made demand for all types of properties to go up.
Another significant finding we have found in the data is that maintenance fees and property size is strongly correlated ,with a value of greater than 0.8, which means that there is a very high chance that these variables may be dependent on each other. This makes sense because a larger property size incurs more maintenance fees. In fact, while building age was also correlated to maintenance fees, it was not as significant as property size correlating to maintenance fees.
The average price distribution per ward was highest in Ward 13. After analyzing the Toronto map, the most likely explanation was that most of the busiest places in downtown are located in Ward 13, these include Eaton Centre, TMU and many TTC stations in this area which facilitates the flow of people towards their place of work.
The predictive model has significant practical value for multiple stakeholders, helping them make informed decisions based on their specific needs:
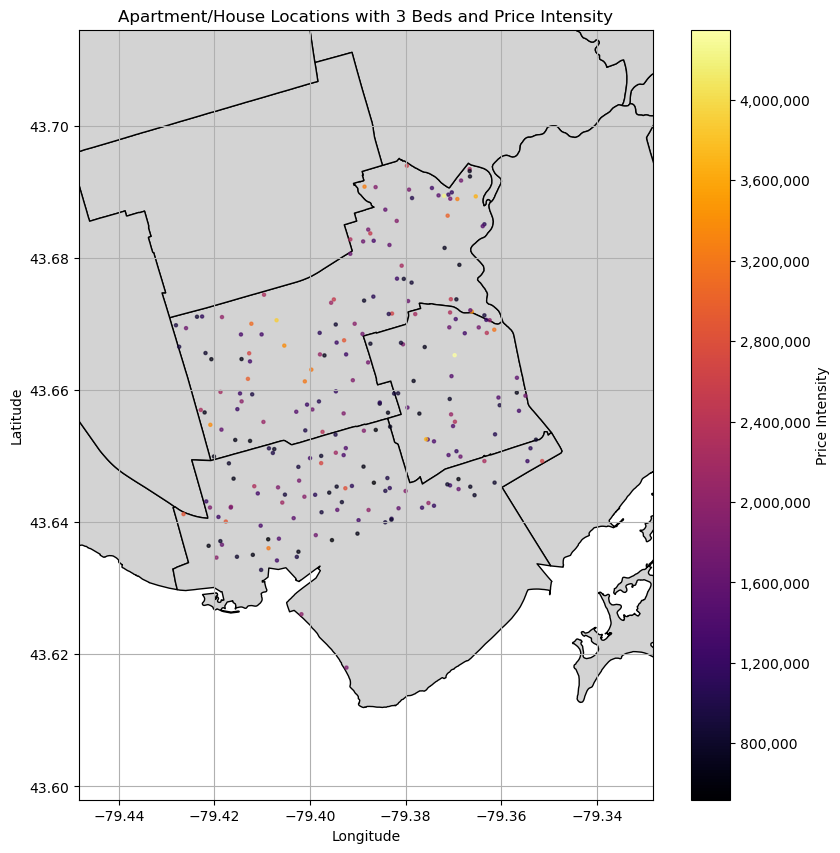
Homebuyers Based on our findings, homebuyers looking to buy a property should stay away from Ward 13 due to the higher average price of properties which is not offset by the various amenities in the area since Ward 10 and 11 are on average $50,000 to $100,000 cheaper while also providing the same convenience of public transport. The price of beds were more correlated with property prices, which means that large families should try to get a property in Ward 10 or try to convert dens into a kids bedroom as the presence of a den does not impact the price as significantly as beds. While parking space is also a factor affecting the price of properties, they do not add that much value to a property in these areas due to the high connectivity with the TTC.
Investors Investors looking for liquid properties (properties that sell fast) should prioritize a D_mkt of less than 10 days as these types of properties have had the least time on the market and may be currently mispriced, which could lead to a profit in case of reselling.
Policy Makers Understanding the market features is key to provide laws and policies that can help the housing market and improve its effect in the economy. With this project and its insights, we hope to shine light into the importance of the diferent factors affecting the prices in order to provide more information into what factors drive prices up in Toronto.
Important Notes: This project was made with the help of ChatGpt from OpenAI and JupyterHub. Libraries Pandas, GeoPandas, sklearn, and others, shown in the code, were used.
References: Ontario Newsroom. (n.d.). https://news.ontario.ca/mof/en/2017/04/ontarios-fair-housing-plan.html OpenAI. (2024). ChatGPT (March 2024 version). https://chat.openai.com City of Toronto Open Data Portal. (n.d.). City of Toronto Open Data Portal. https://open.toronto.ca/
Built With
- jupyterhub
- powerbi
- python

Log in or sign up for Devpost to join the conversation.