-
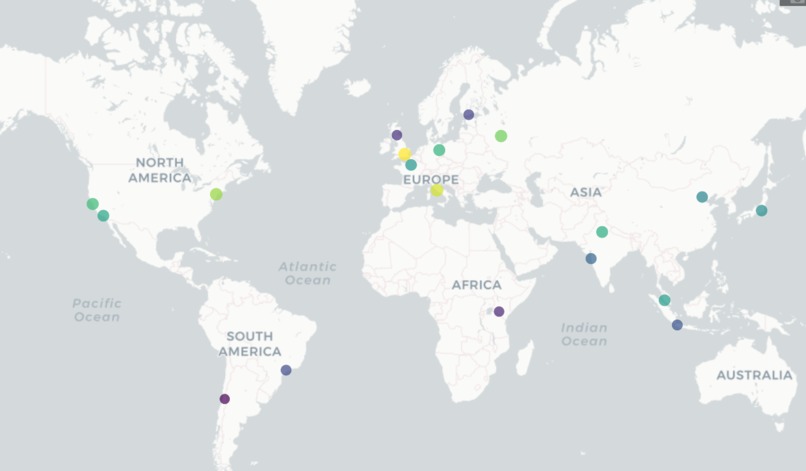
susceptibility map

Github Link: https://github.com/hackbio-ca/disease-susceptibility-analysis.git
Inspiration
We wanted to create a tool that would help identify whether areas were likely to be afflicted by disease using associations between environmental variables and RNA-seq data.
What it does
The system takes in RNA-seq data and its associated collection location, clusters the locations based on environmental similarity, and sees which genes are upregulated in all datapoints in the cluster. This would imply associations between that environment and upregulation of that gene.
A novel area of interest could be analyzed by seeing which environmental cluster it falls into, which would imply a certain expected expression profile. We also developed a visualization that could show which areas are most likely to be afflicted by disease based on their environment.
How we built it
We mainly used python to create the clustering algorithm, but also adapted a website designed to show COVID-19 hotspots to instead show disease hotspots.
Challenges we ran into
At the beginning, we lacked a cohesive vision for execution and it put us back. We considered performing a linear regression to environmental variables and disease susceptibility, but it turned out that it was a nontrivial problem to go from RNA-seq to disease susceptibility. We did not know what conditions are meaningful, how can you control for things like smokers and how to deal with the fact that almost all of the data came from hospitals and diseased samples. For this project to work as originally intended, we needed distributed samples from each region. Additionally, data scraping became a large issue because no one on our team was experienced and we ended up having to hand pick samples that matched our restricted criteria.
Eventually we settled on creating a tool that would take RNA-seq data with location indexing. We could infer environmental variables from location, and we could infer disease from RNA-seq data. By clustering locations based on environmental similarity and seeing which genes were universally upregulated in diseased individuals within the environmental cluster, we could infer a relationship between environment and disease expression. However, we were struggling with how to find the RNA-seq data with location Dr. Artem helped with that by giving us the coordinates, but even then, once we had looked up the SRA database data, we did not have a way of calculating differential gene expression We were working on it, but learned that to analyze RNA seq data we needed a lot of pre-processing steps which would be time consuming and impossible in this time frame To get around this, we tried to look up the differential gene expression in the papers, but the data in the papers were too disorganized for our original plan. Eventually, we just designed the algorithm and generated random data.
Accomplishments that we're proud of
Although we never managed to acquire the appropriate data, we have managed to get the algorithm working which should theoretically be able to do what we expect.
What we learned
We learned to plan things out carefully ahead of hackathons, anticipate the struggles with collecting data, prepare and compile data ahead of time, look at the feasibility of the project; make sure everyone is on the same page
What's next for Predicting Local Disease Susceptibility with RNA-Seq Data
Try to acquire real data

Log in or sign up for Devpost to join the conversation.