-
graph1
-

graph2
Inspiration
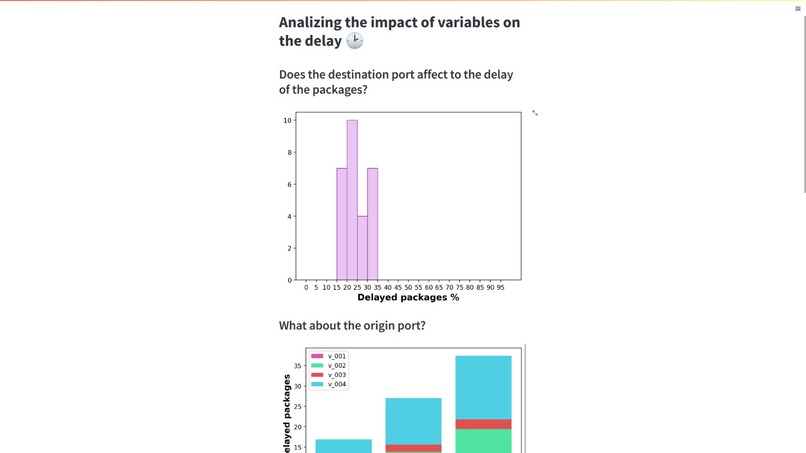
Although not having too much knowledge about data science, we knew enough to decide what we wanted to do. This was a classification problem that needed return values between 0 and 1 (percent). Starting from that statement, we played around with the given data and tryied to see some correlation.
What it does
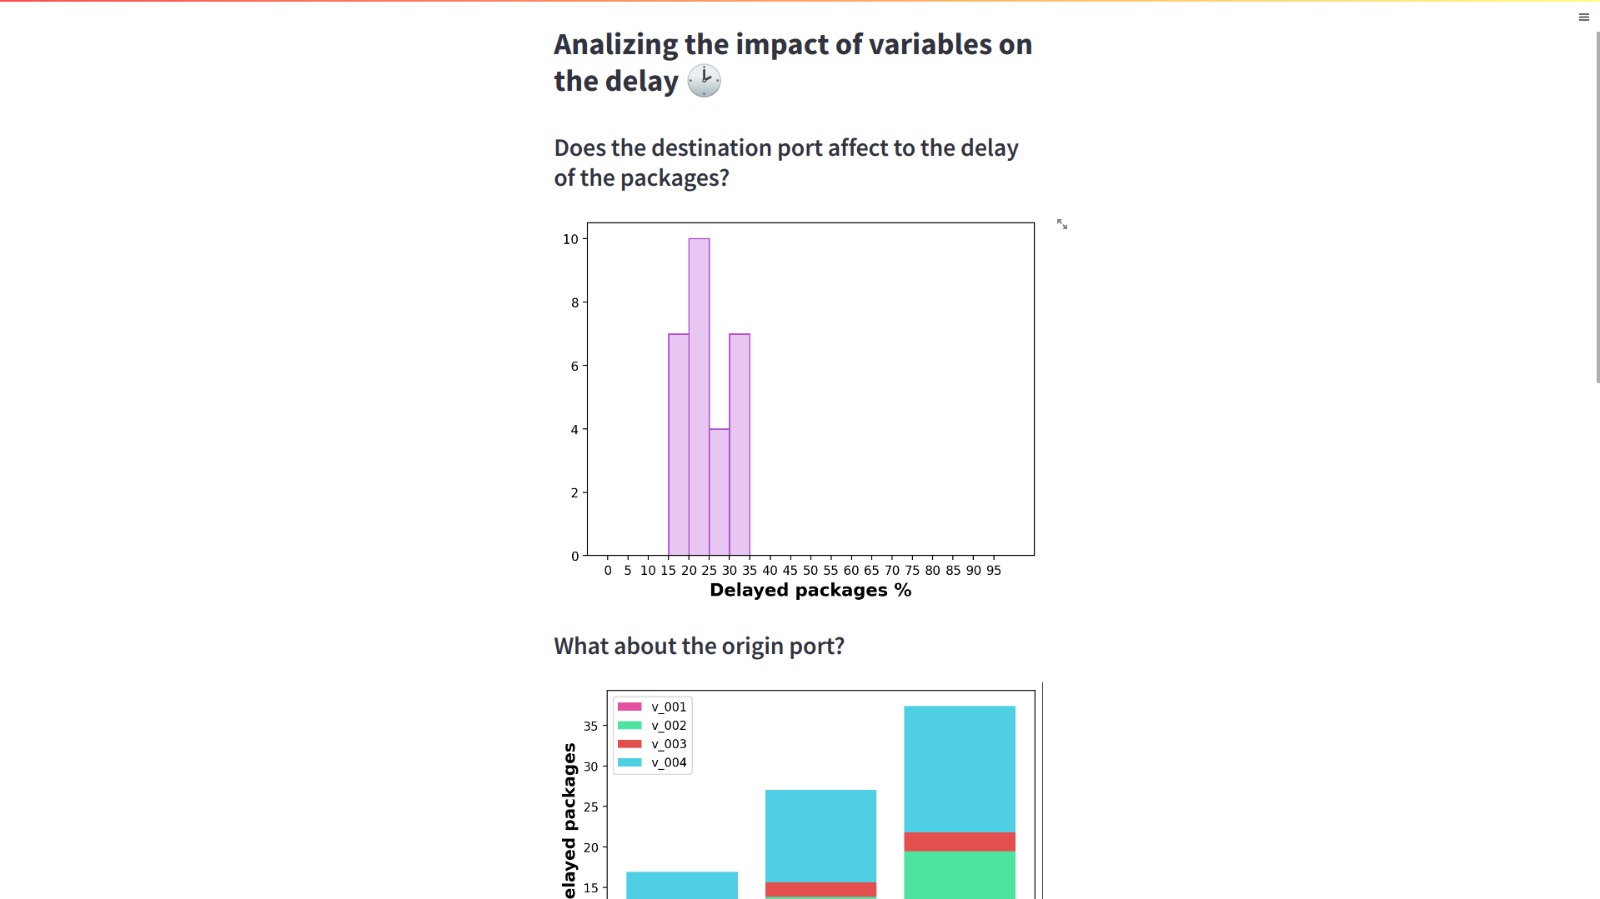
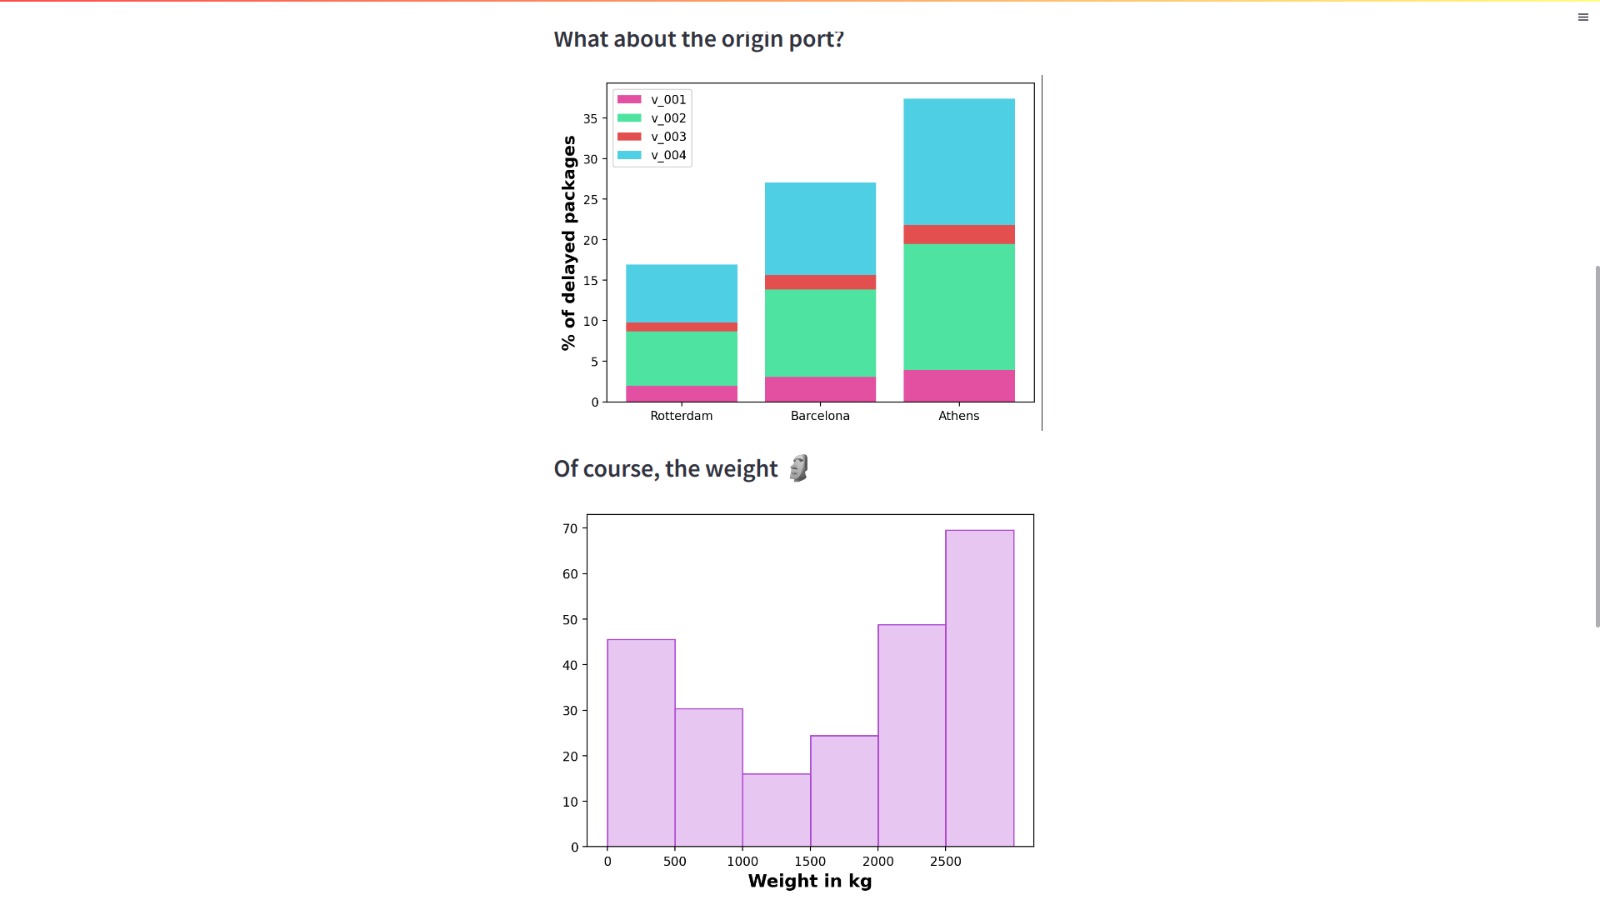
Our code takes all the data and reads it, then takes some extra features from other datasets such as the weight of the parcel and the distance between the cities and the destination. Then, a regression model takes the likelyhood that the parcel gets delayed based on this data and the existing data on the orders dataset
How we built it
We built our solution using the programming language Python and the standard data science libraries pandas, numpy and sklearn
Challenges we ran into
We joined Accenture's challenge
Accomplishments that we're proud of
We are proud of all what we were able to do, but in special the data cleaning step, whitch has been more difficult than expected. We are also proud of the insights we were able to get from the data, even though the model was underfitted and could not predict propperly our lable variable
What we learned
We learned a lot about data managing and data cleaning and also Feature Engineering
What's next for Predicting Likelyhood of parcel delay
We believe that a more in depth analysis of the data and making features interact among them could lead into better results of the algorithm

Log in or sign up for Devpost to join the conversation.