-
-
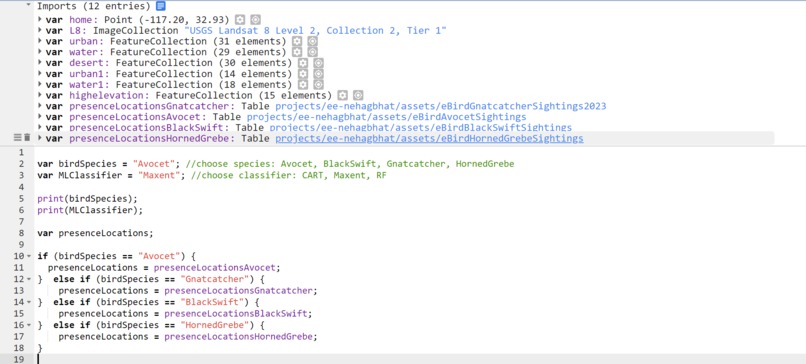
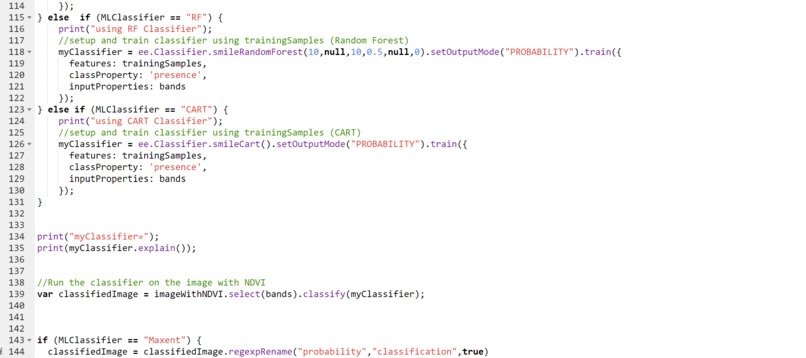
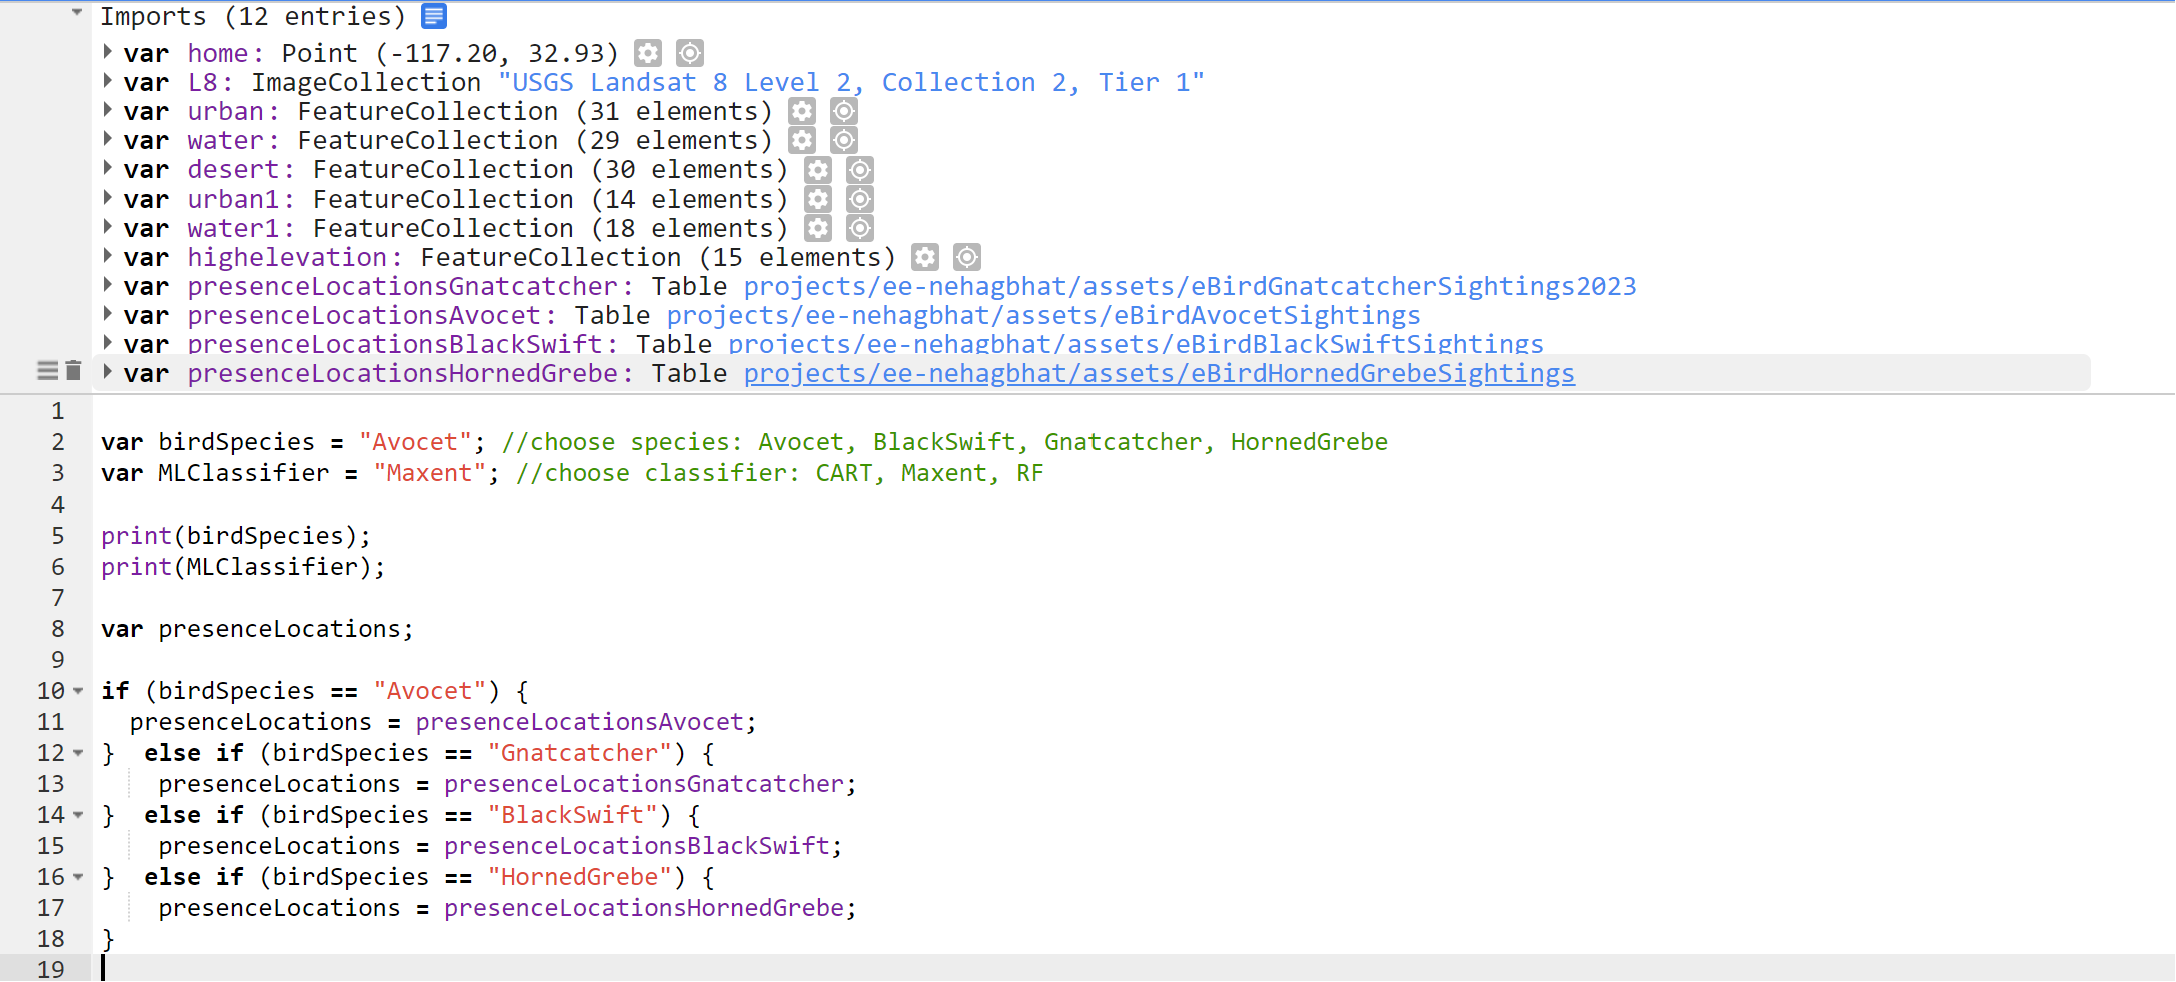
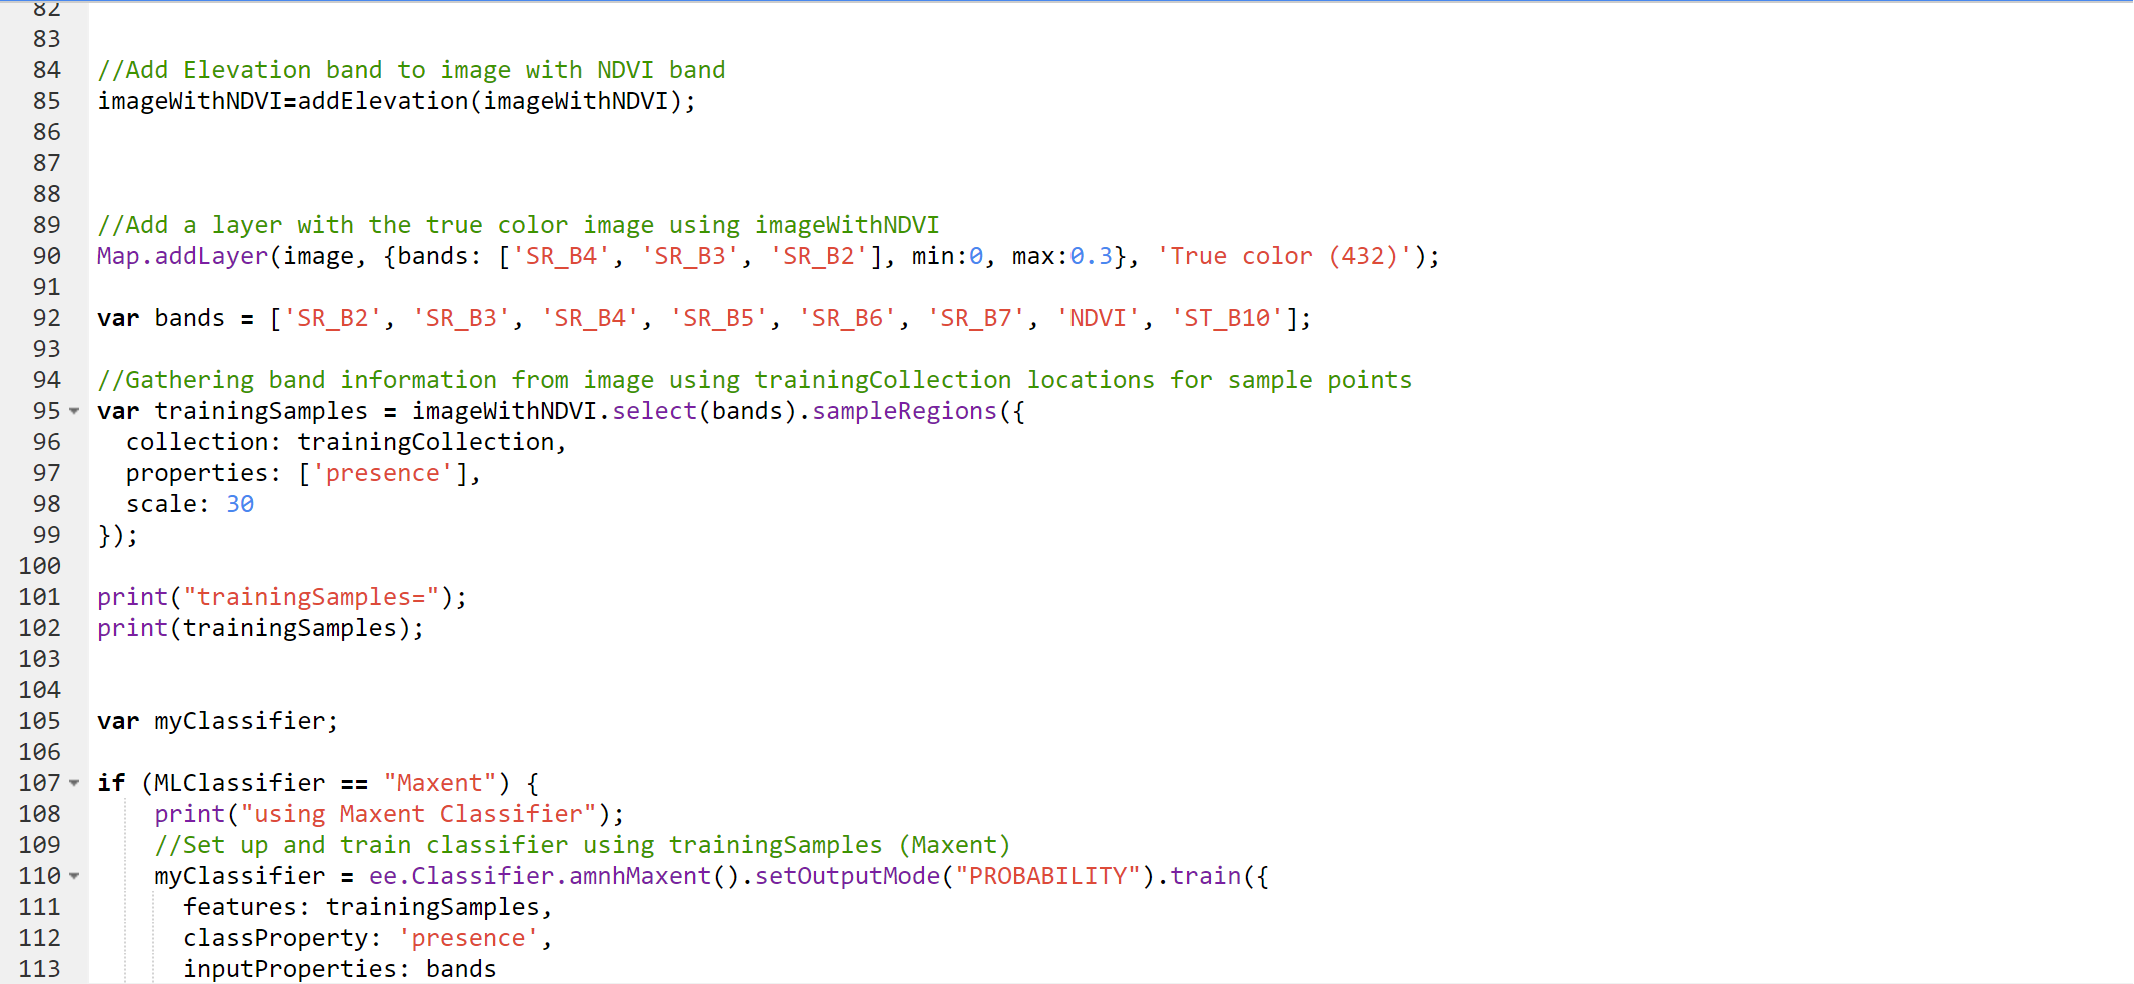
Project code part 1
-
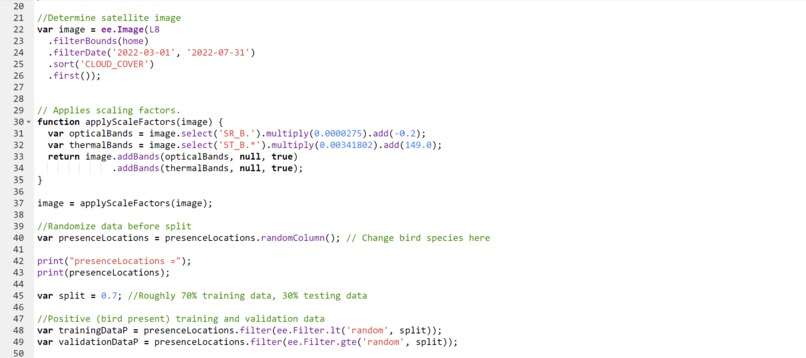
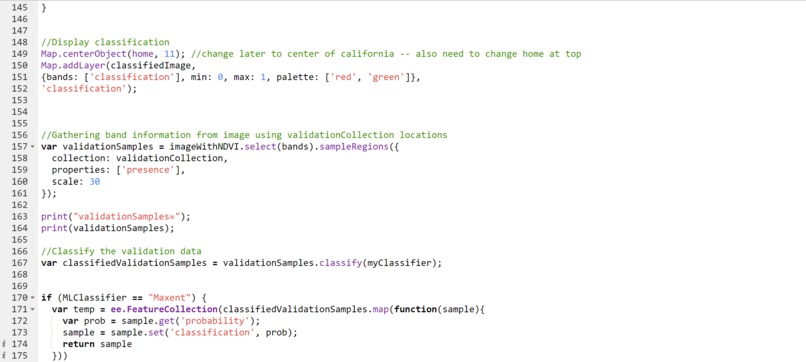
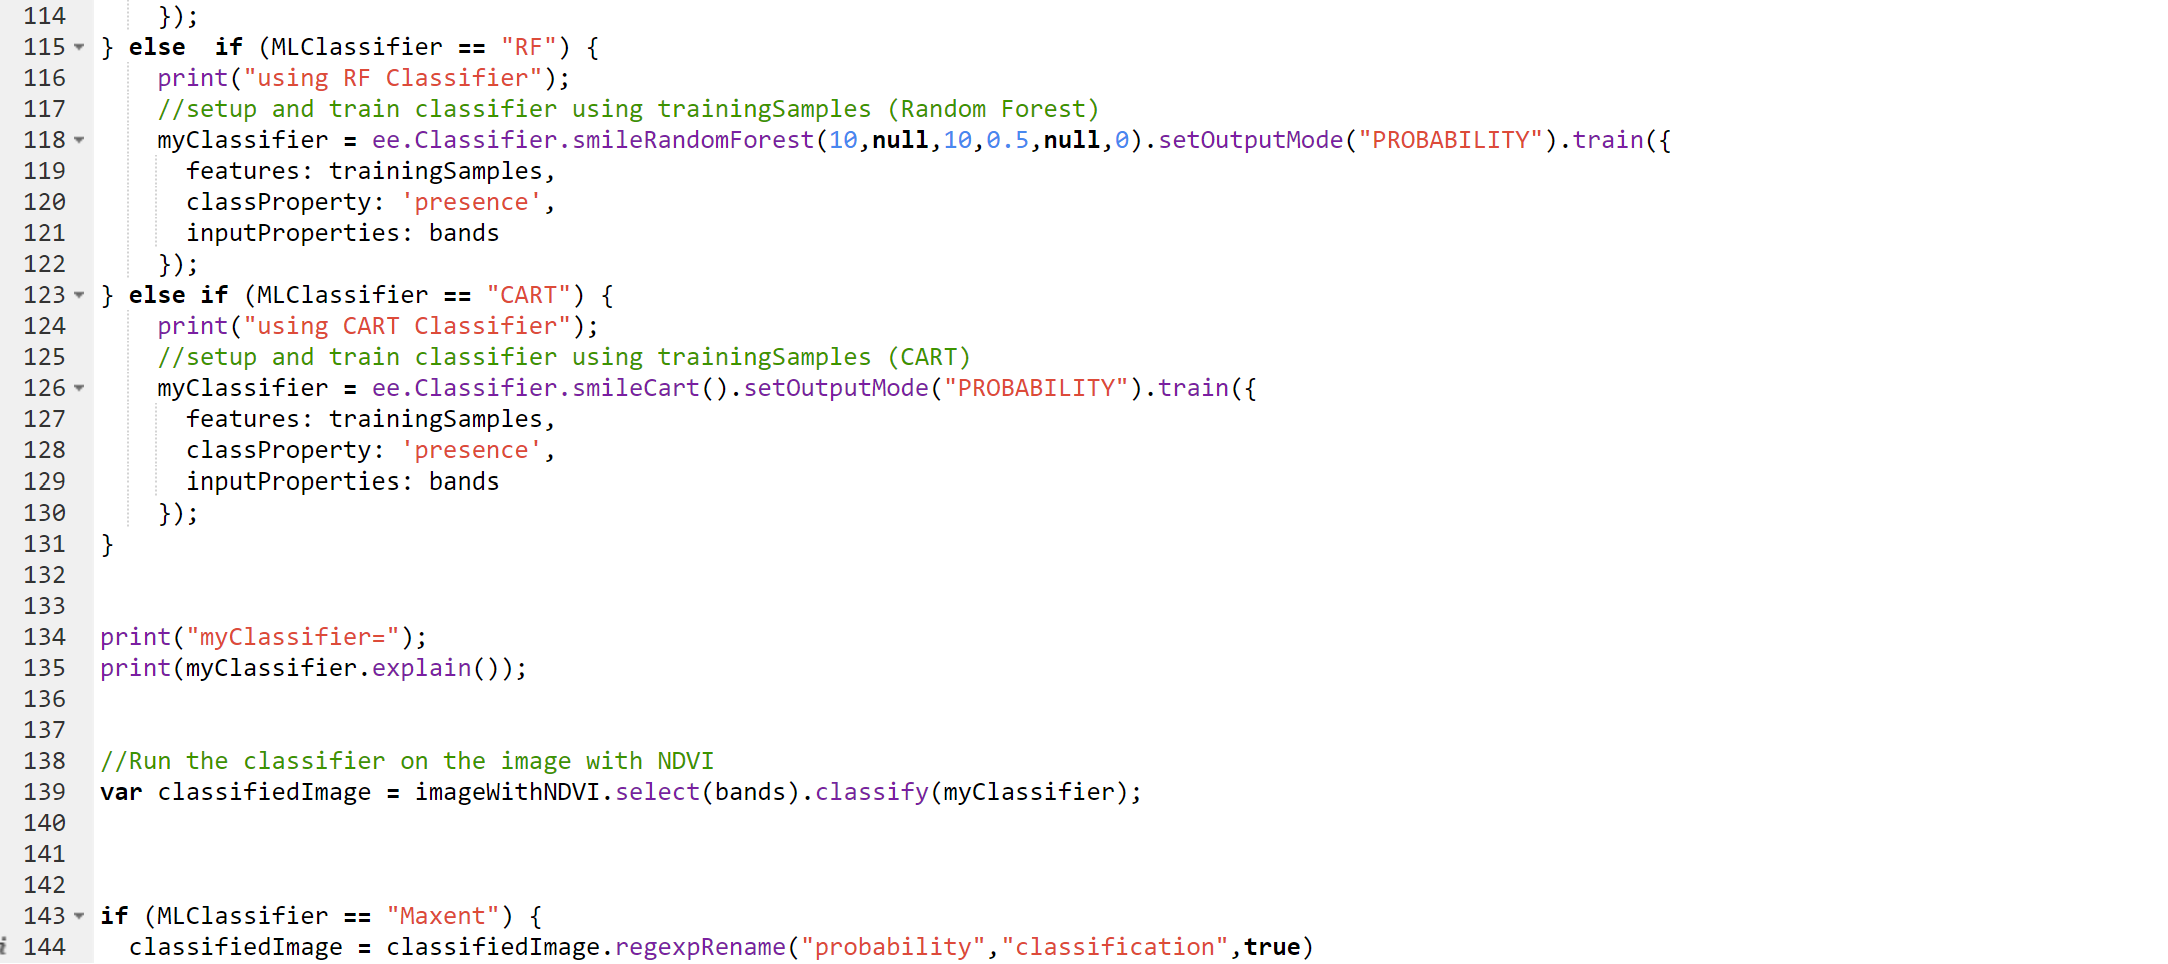
Project code part 2
-
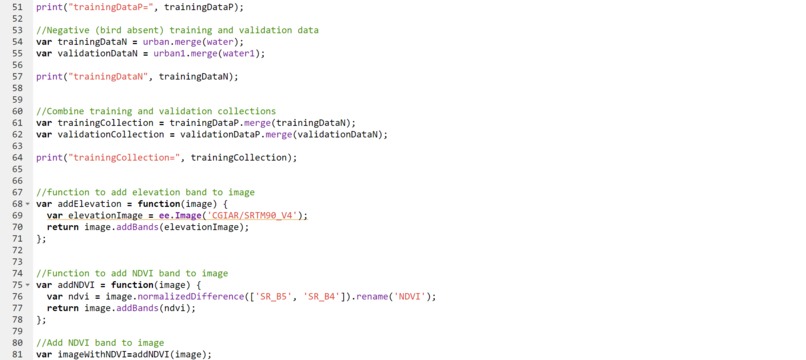
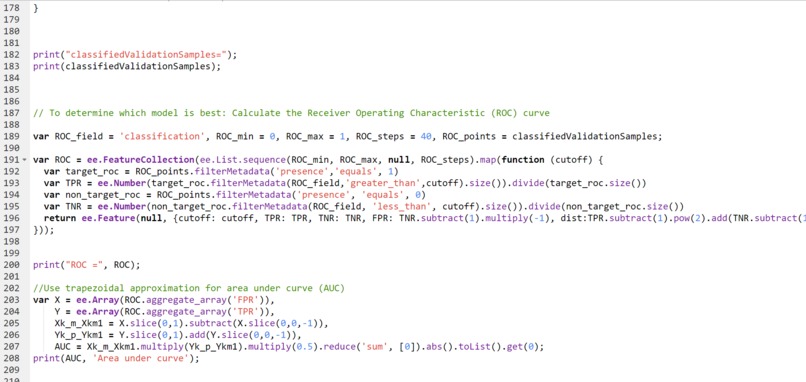
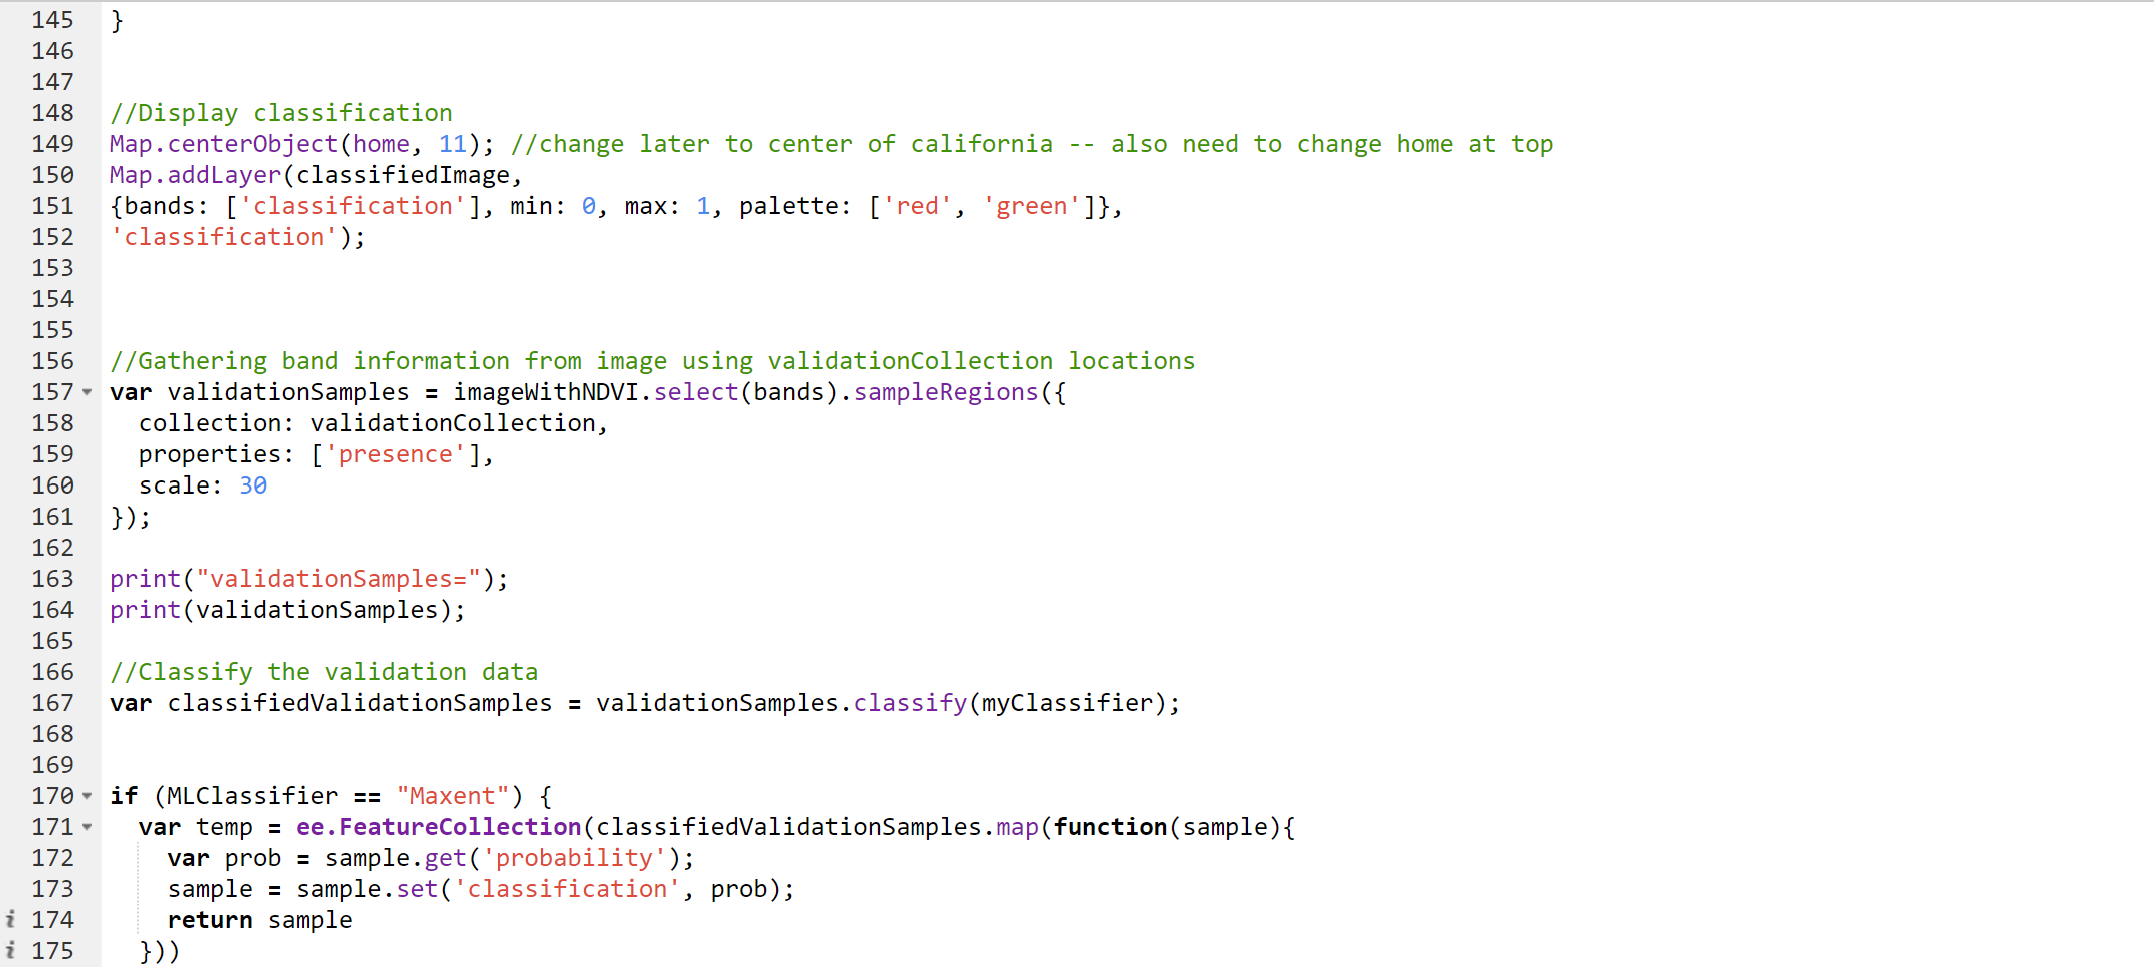
Project code part 3
-
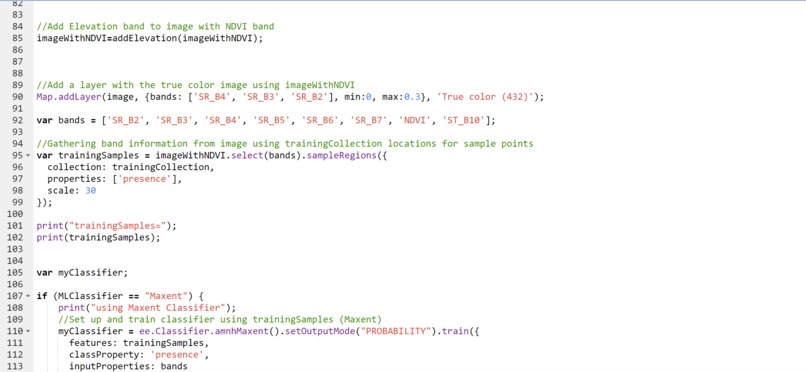
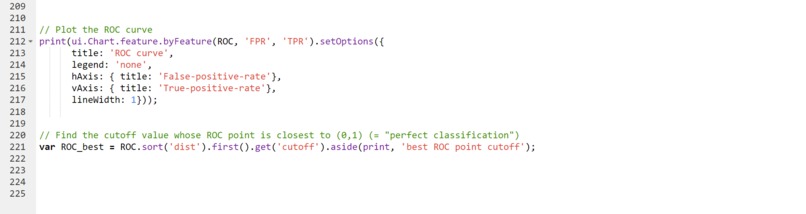
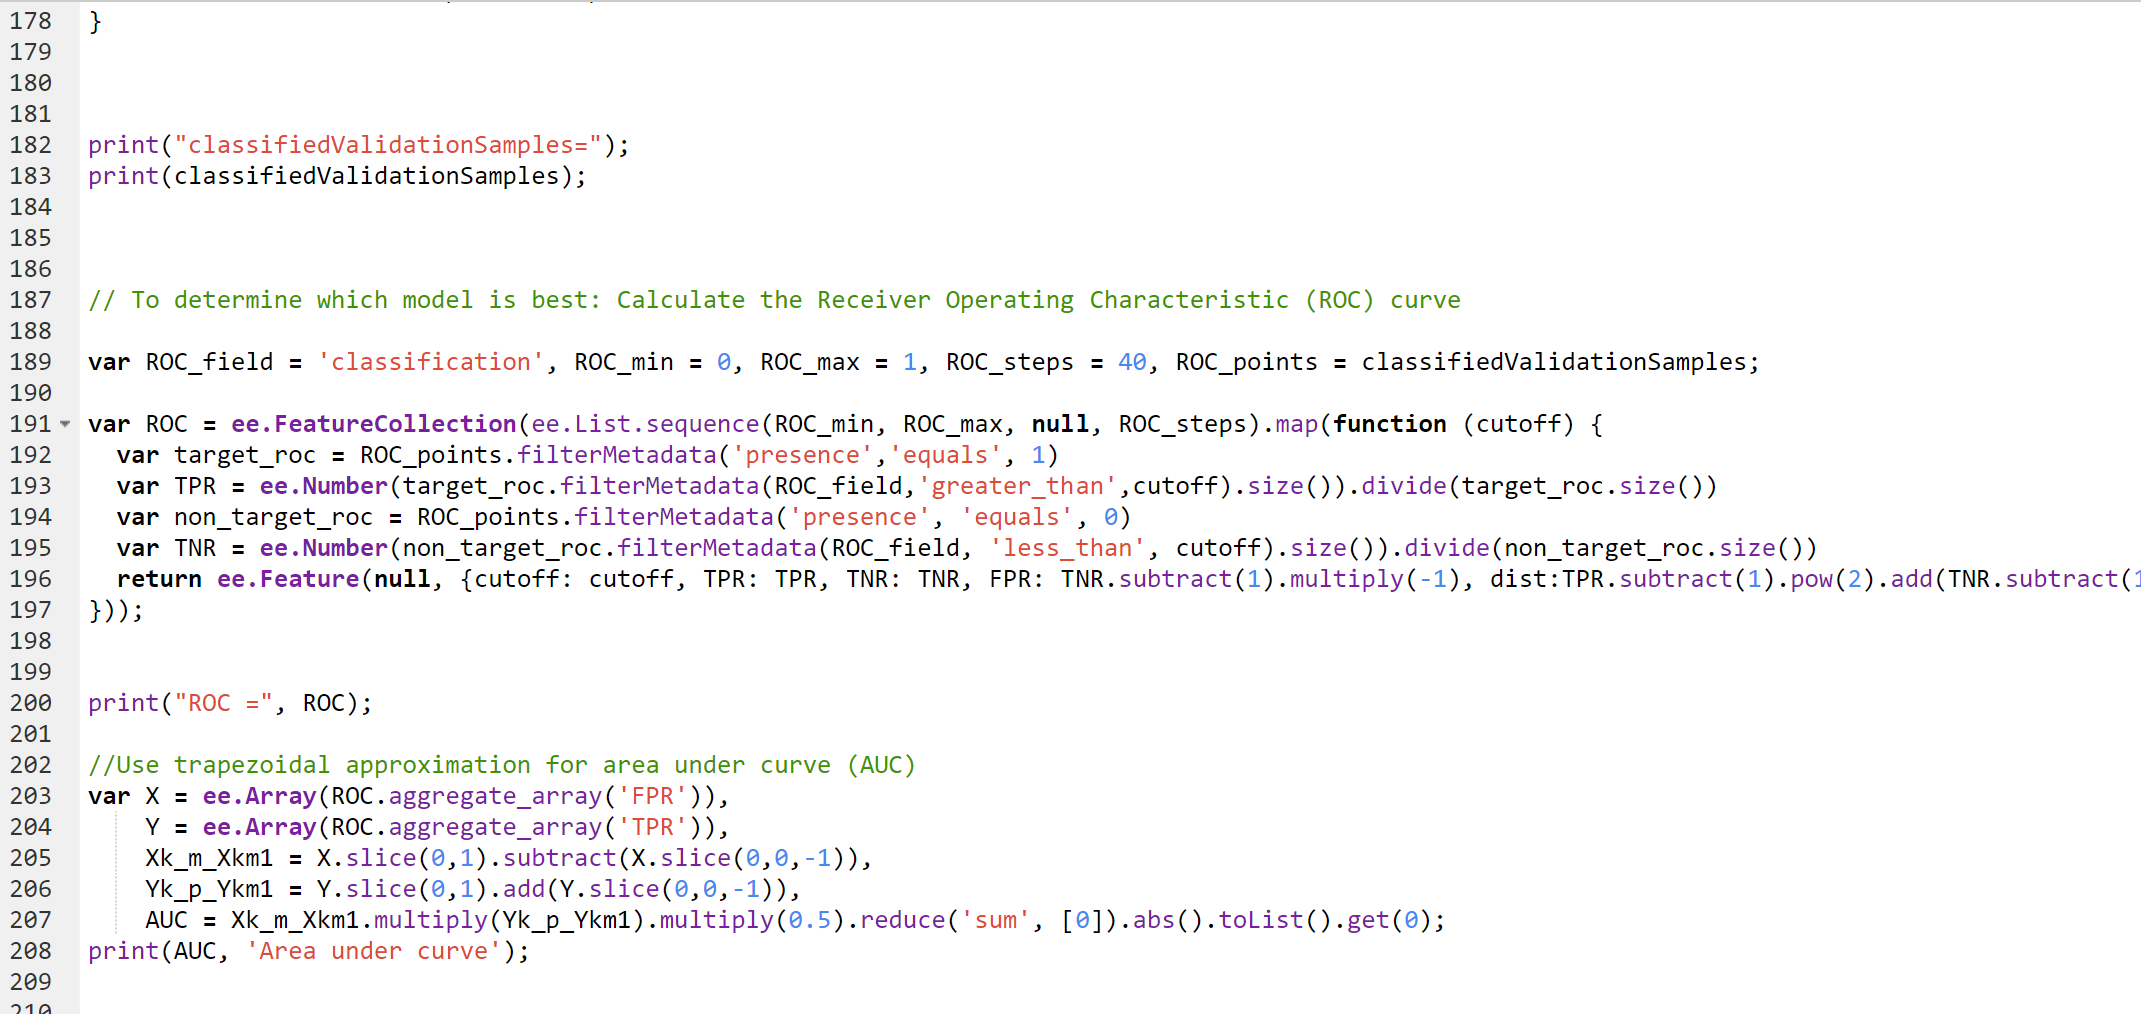
Project code part 4
-
Project code part 5
-
Project code part 6
-
Project code part 7
-
Project code part 8
-
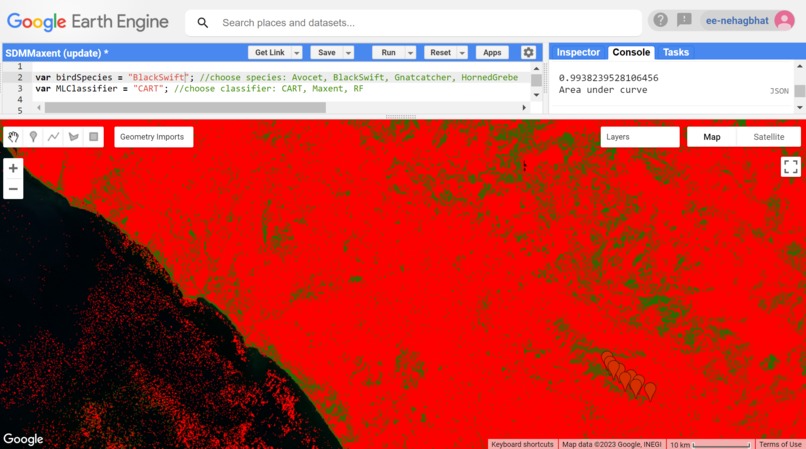
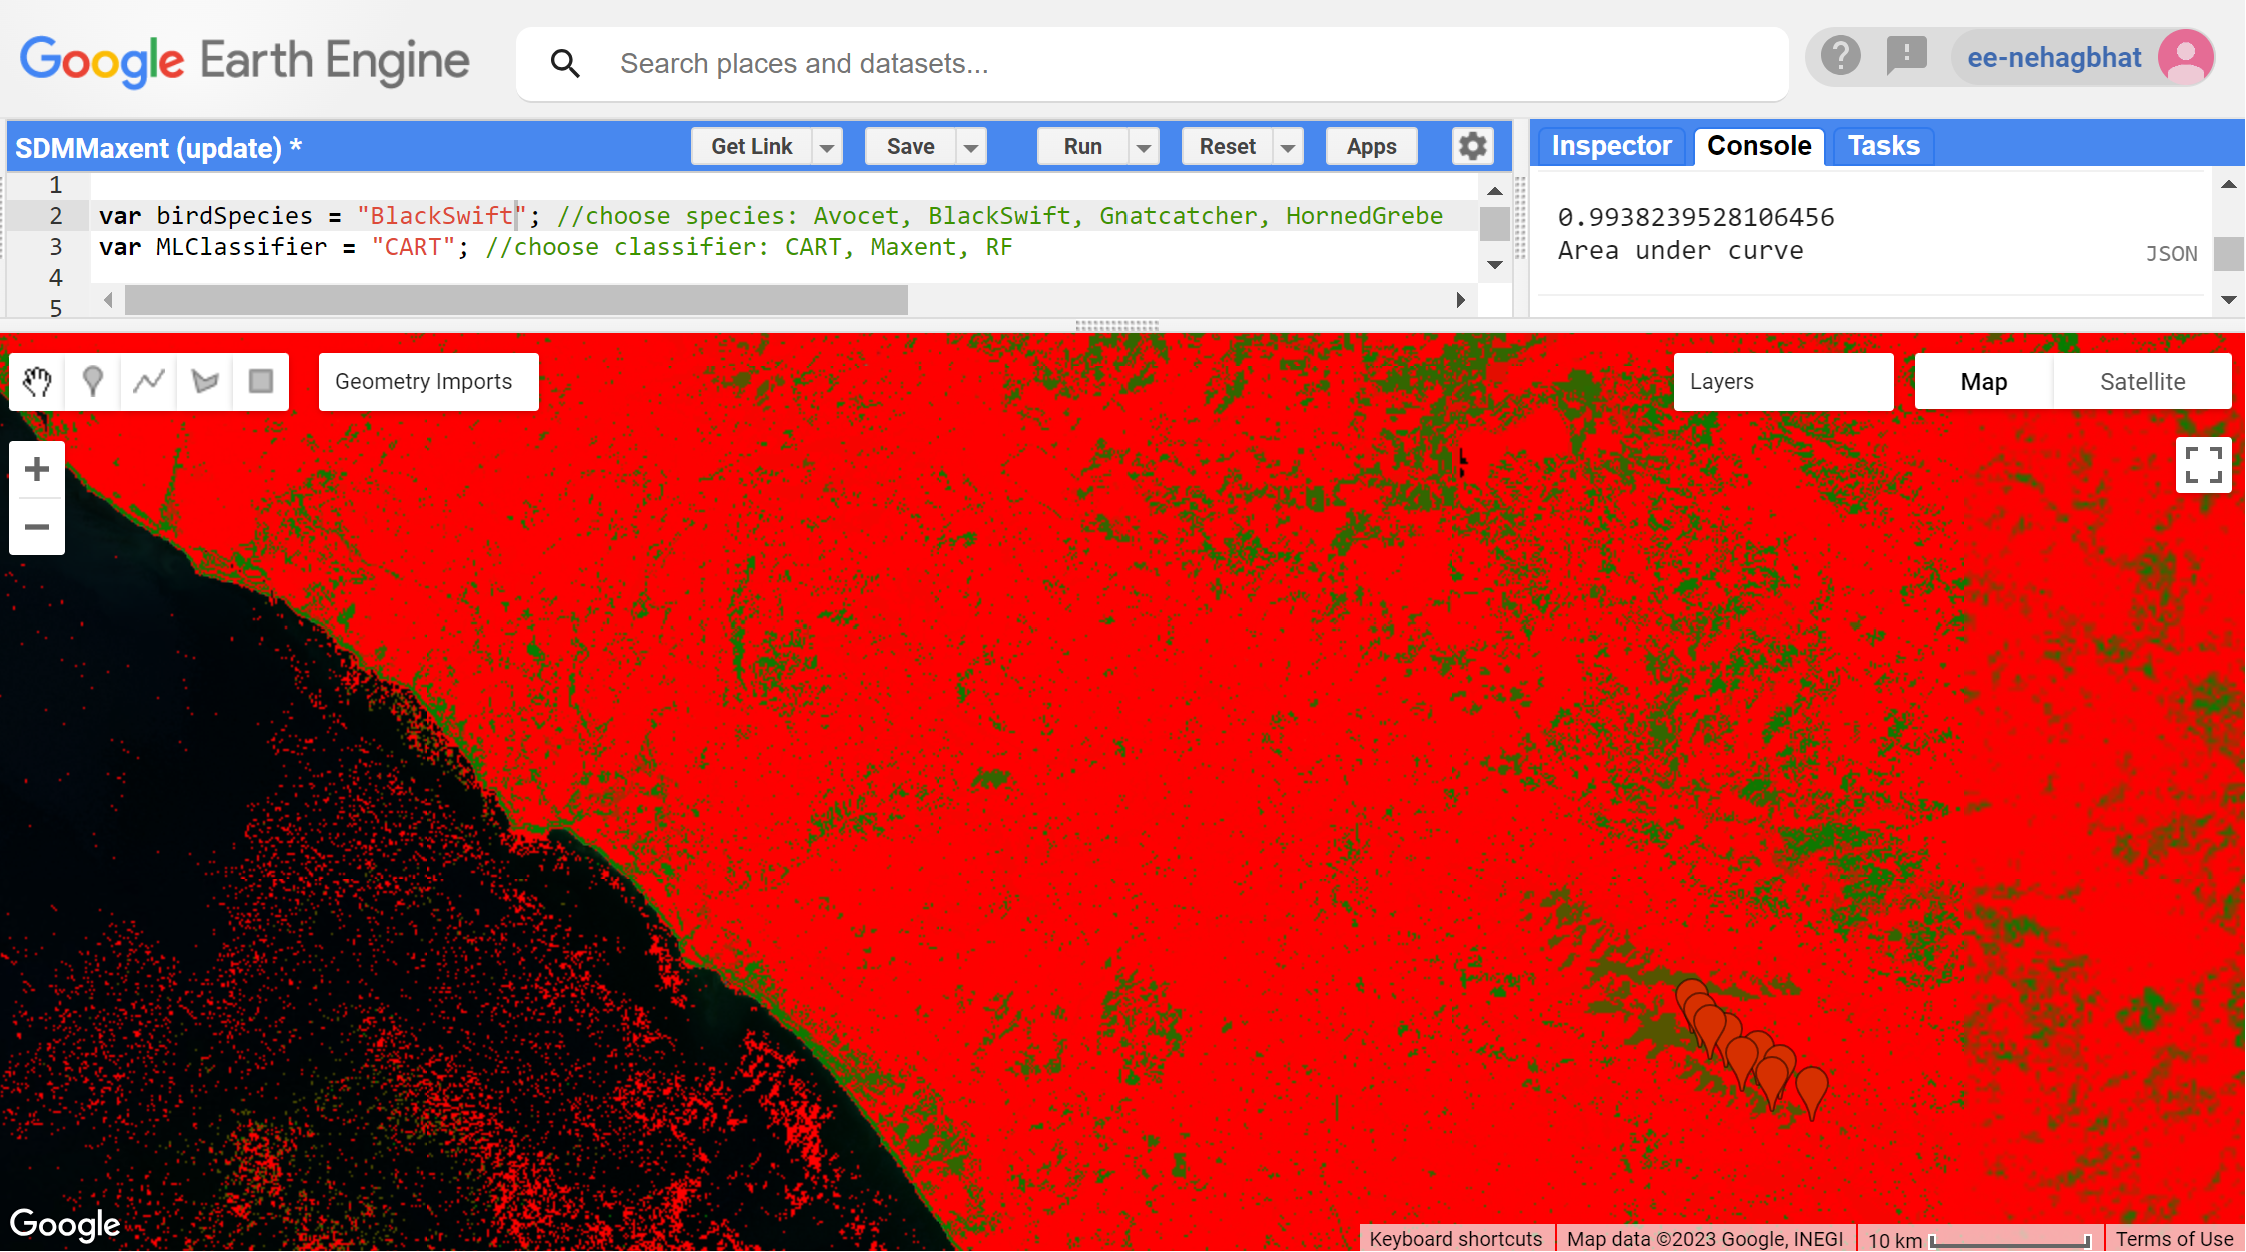
Classified generated map layer for Black Swift CART
Inspiration
As an avid birder over the last 4 years, one of my favorite pastimes has been observing the large variety of bird species that interact with each other, humans, and nature in my backyard or while bird watching along the coast of southern California. However, it saddened me to notice that over time, I was seeing some of my favorite species less and less. Due to the escalation of urbanization and human development in the last 20 years, many threatened bird species have experienced rapid population decline as a result of habitat loss. The climate crisis only worsens this issue, as extreme weather phenomena and hotter, drier conditions displace birds from their sources of survival. For this reason, I wanted to develop a project that could help me and other conservationists monitor where specific bird species are living to prevent further construction on that land.
What it does
My project is a model in Google Earth Engine (GEE) that uses machine learning classifiers (CART, Random Forest, and Maxent) to predict habitats where varying bird species may reside based on USGS Landsat 8 Satellite data and previous sightings data from eBird. Using GEE’s visualization capabilities, the program takes into account bands (visible light frequencies, surface temperature, and vegetation) to produce a new map layer displaying the probability of presence for a given bird species.
This tool can provide use as a more efficient way to monitor bird habitats over time than current physical tracking methods as conditions continue to change rapidly. Furthermore, the maps produced by the GEE model can be brought to urban developers to prevent further degradation of essential bird environments.
Instructions for users
- Set up a Google Earth Engine Account
- Select a bird to be tested (Gnatcatcher, Avocet, ...)
- Run the program with Maxent, Random Forest, and CART and determine which machine learning model has the highest area under ROC curve—this model will produce the most accurate bird habitat predictions
- Darker green areas on the produced map layer represent a high probability of bird presence while red areas represent little to 0 probability of bird presence (make sure both Classification and True Color map layers are selected)
How we built it
With my previous experience in GEE and JavaScript I was able to develop a code that fit the following procedure:
- Import sightings data from different birds from eBird to GEE (Bird Habitat data)
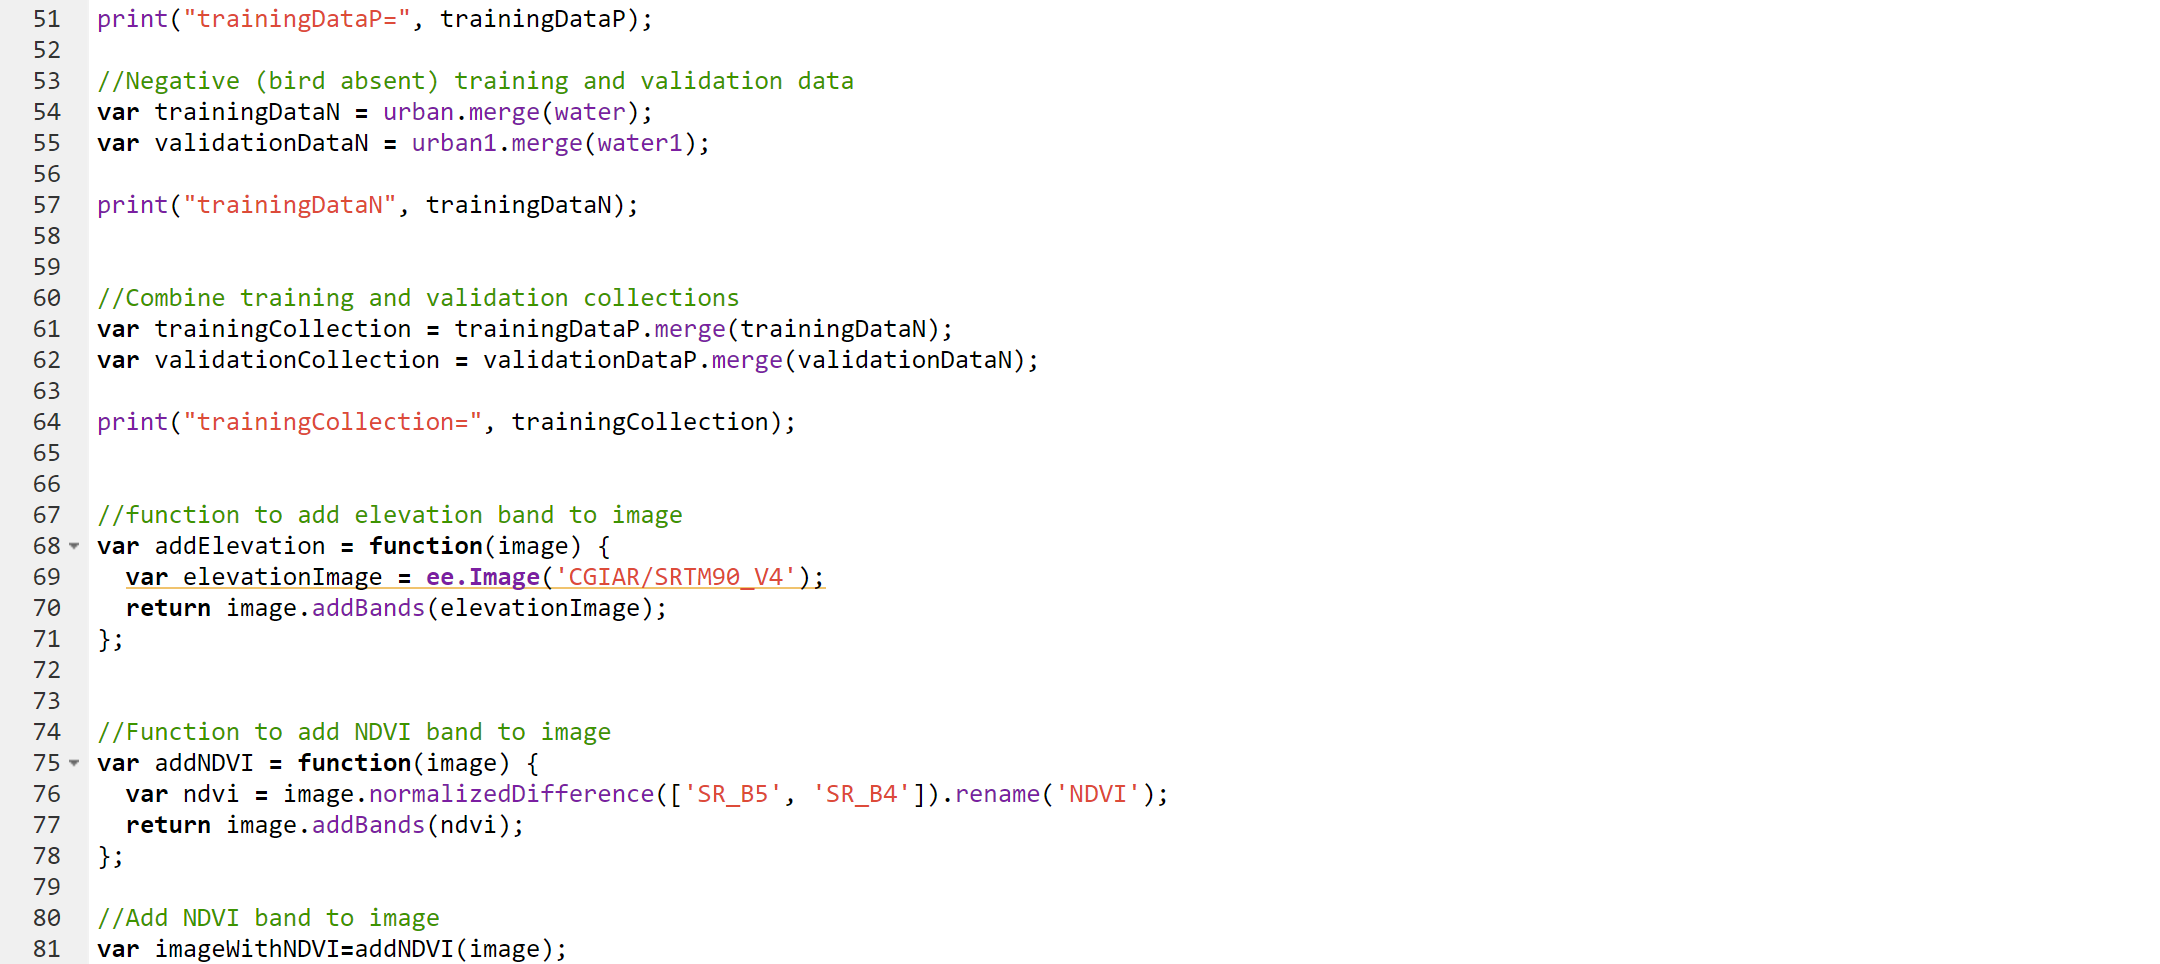
- Insert geometric points for areas where it was known for sure that birds would not reside (Non Bird Habitat data)
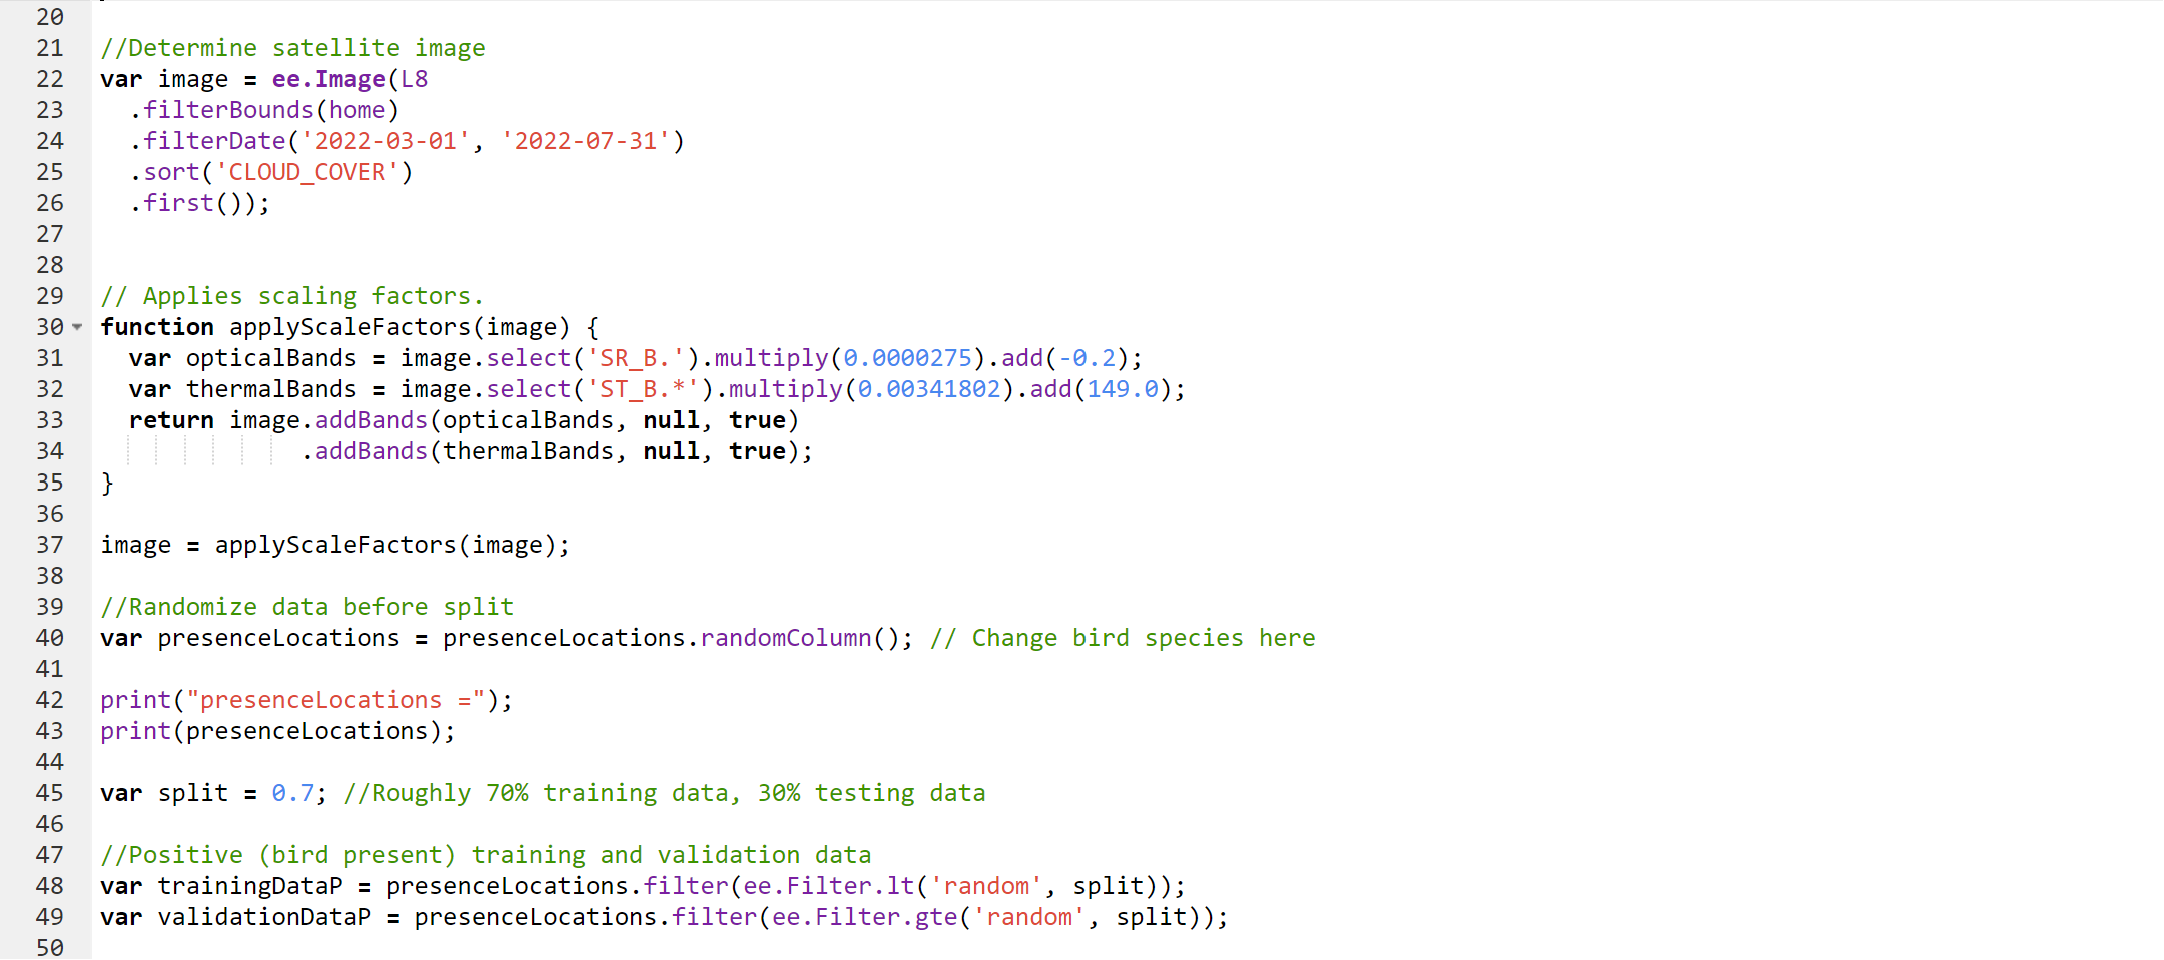
- Center a cloud-free Landsat 8 image composite in southern California by importing the “USGS Landsat 8 Surface Reflection Tier 1” from GEE and filtering
- Split Bird Habitat data into 70% for training for 30% for validation
- Merge both Bird Habitat training and Non Bird Habitat into one big training collection
- Add a new map layer called True Color
- Determine the bands which would be used, including the derived band NDVI
- Collect band information from image using training collection locations for sample points
- Train Maxent, Random Forest, and CART classifiers using training collection data
- Classify image using trained classifier
- Add new classified map layer with green for high probability of Bird Habitat and red for low probability
- Overlay each pixel from the locations of the Bird Habitat validation data on the composite image
- Classify validation data using same classifier as before
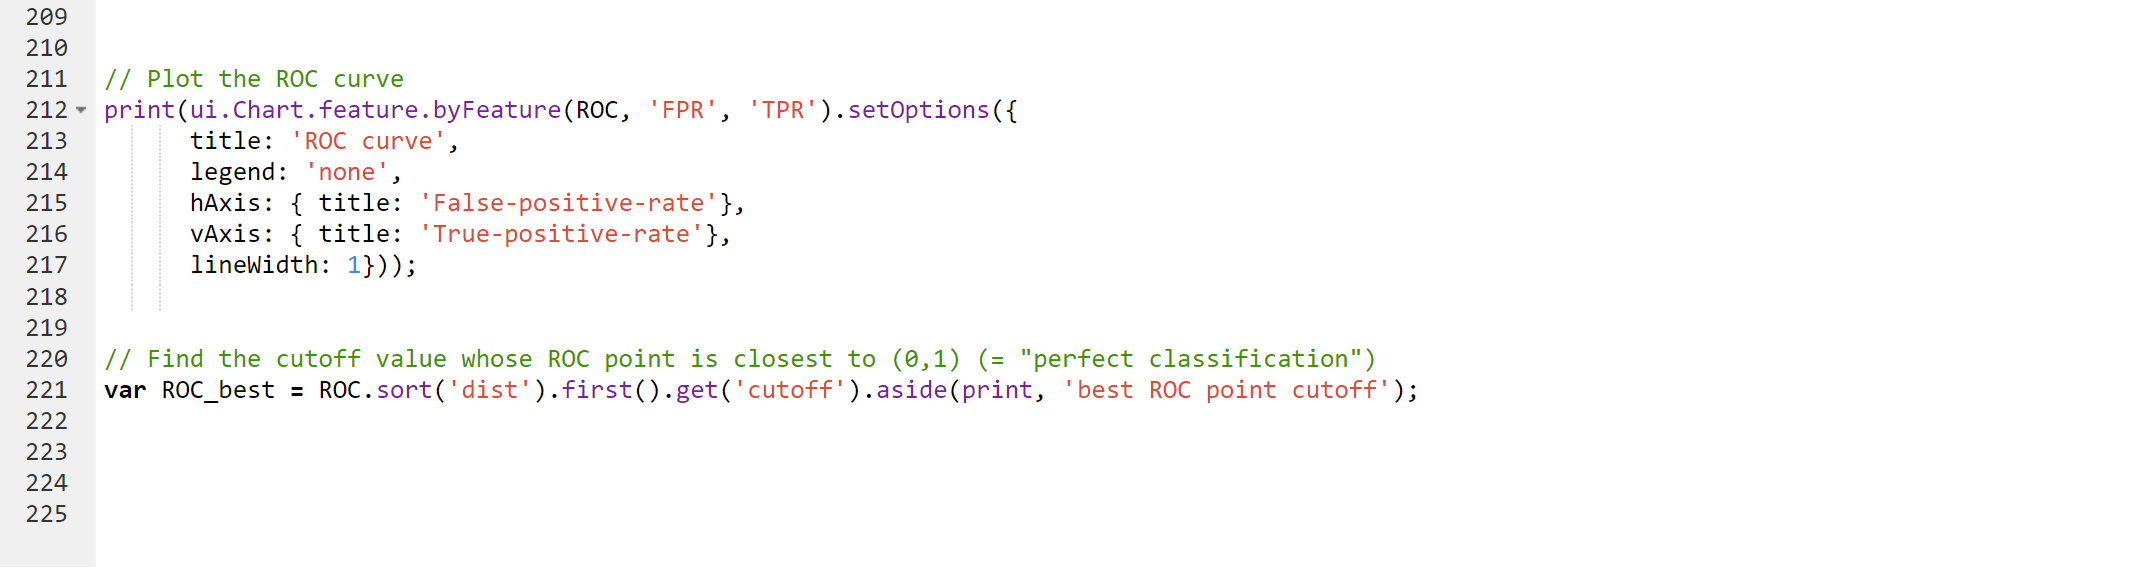
- Construct an ROC curve by running the classifier with different cutoff threshold and computing the false and true positives
- For each classifier, calculate the area under the generated ROC curve to compare models
Challenges we ran into
Since GEE is a cloud server, basic JavaScript functions, such as loops, do not work for Earth Engine objects. Instead, it is necessary to use functions like Map that are provided by GEE, which took lots of time and research for me to acclimate to. Furthermore, I had difficulty figuring out how to import the eBird datasets into GEE. The GEE documentation had instructions, but they were unclear, so I had to watch additional tutorials online and experiment with the data in spreadsheets to solve this issue.
Accomplishments that we're proud of
The accomplishment I am most proud of is the Receiver Operating Characteristic curves. I was looking for an efficient way to compare the different machine learning classifiers when I came across ROC curves during my research. This was a difficult concept for me to both comprehend and implement, but I was able to source the code and modify it for my data, which ended up being successful! I am also proud of how I was able to incorporate the multiple machine learning classifiers into one program and make it configurable!
What we learned
For the three ML classifiers CART, Random Forest, and Maxent, accuracy varied across individual bird species, but typically CART performed best. The area under the ROC curve for CART was the highest, consistently around 0.98, while Maxent varied between 0.96 - 0.98 and Random Forest ranged between 0.95 - 0.98.
What's next for Predicting Endangered California Bird Species Habitats
Currently, the model can only predict habitats for bird species in southern California. However, this can be adjusted for anywhere in the world by changing the latitude and longitude coordinates for “home” in the imports section of the code and selecting the desired region for the bird sightings in eBird. Additionally, you must manually set points on the map where it is certain the bird will NOT reside for training data.
If the user wants to determine the habitats of a bird species whose sightings data is not already defined in the program, they must import the 2021-2023 latitude and longitude of sightings of their selected bird from eBird to GEE under the variable name PresenceBirdName. Then, they must add an else if clause setting birdSpecies equal to the name of their selected bird, so that it can be called in the code.
Since these are both rather tedious processes, in the future, I would like to make the interface for my project more accessible and easier to use.
Built With
- cornell-ebird
- excel
- google-earth-engine
- javascript
- usgs-landsat8


Log in or sign up for Devpost to join the conversation.