-
The data prep

Inspiration
I've been tracking and analyzing the data on COVID-19 since we were at a few hundred confirmed cases in the US.
What it does
Built a model that assigns risk scores to each US county based on: -Time series of confirmed cases and confirmed deaths in each county. -Time series of confirmed cases and confirmed deaths that occurred within 25 miles of the county, 50 miles, and 100 miles of each other county. -Census data on overall population counts for each county, and population counts by age bands.
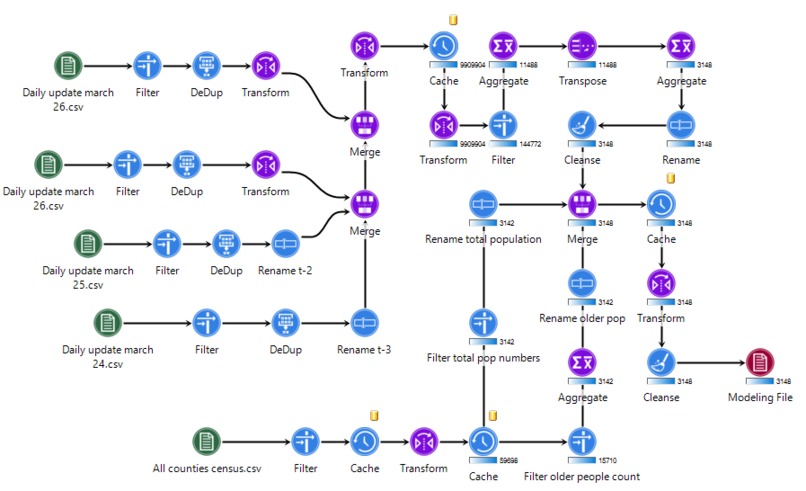
How I built it
Most of the work involved wrangling and structuring the data. I used a tool called Construct to do the data prep, and a tool called Predict, for the modeling. Both are software tools from my company (Rapid Insight).
Challenges I ran into
I've been using the data from the Johns Hopkins site. Had to deal with a couple of changes in the structure of that data over the past week or two.
Accomplishments that I'm proud of
Just hoping to find ways to help us fight the COVID-19 pandemic via data and analytics.
What I learned
Patterns exist in the data, and COVID-19 spreads in a predictable way
What's next for Predicting and Tracking Population At-Risk, By US Counties
Adding additional data sources
Built With
- rapidinsight

Log in or sign up for Devpost to join the conversation.