-
-
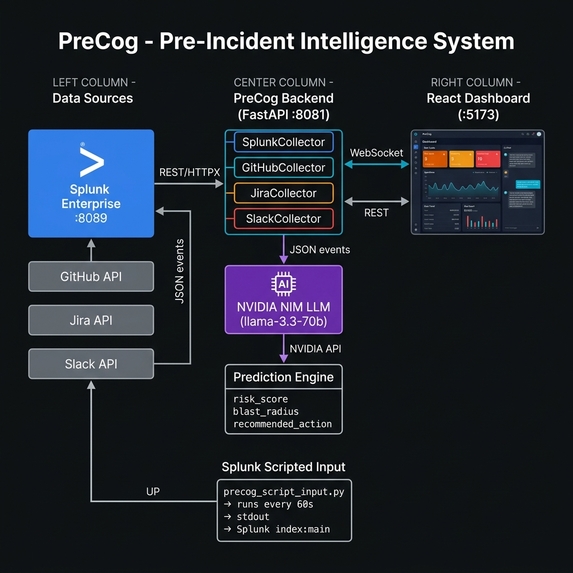
Architecture Diagram
-
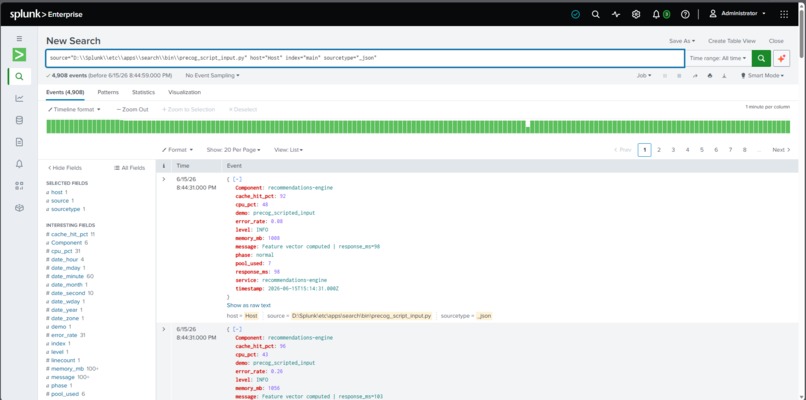
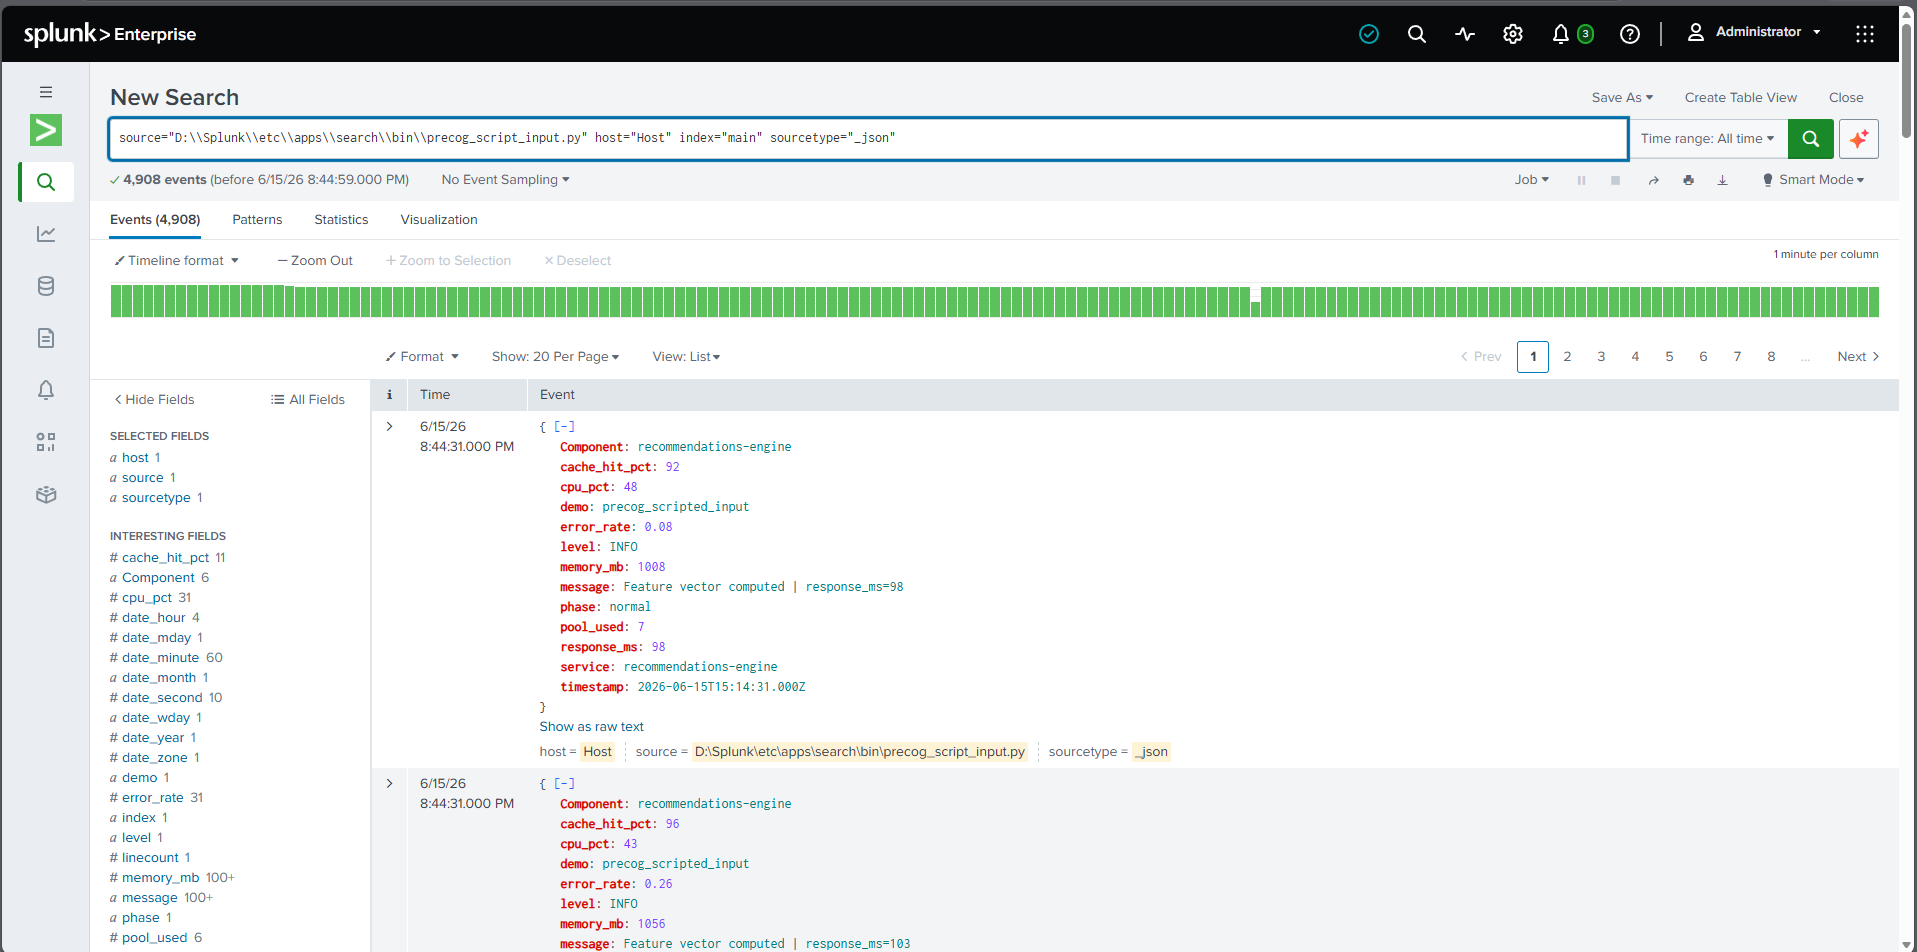
Splunk Data
-

Data receiving from Splunk Mcp Server
-

Frontend

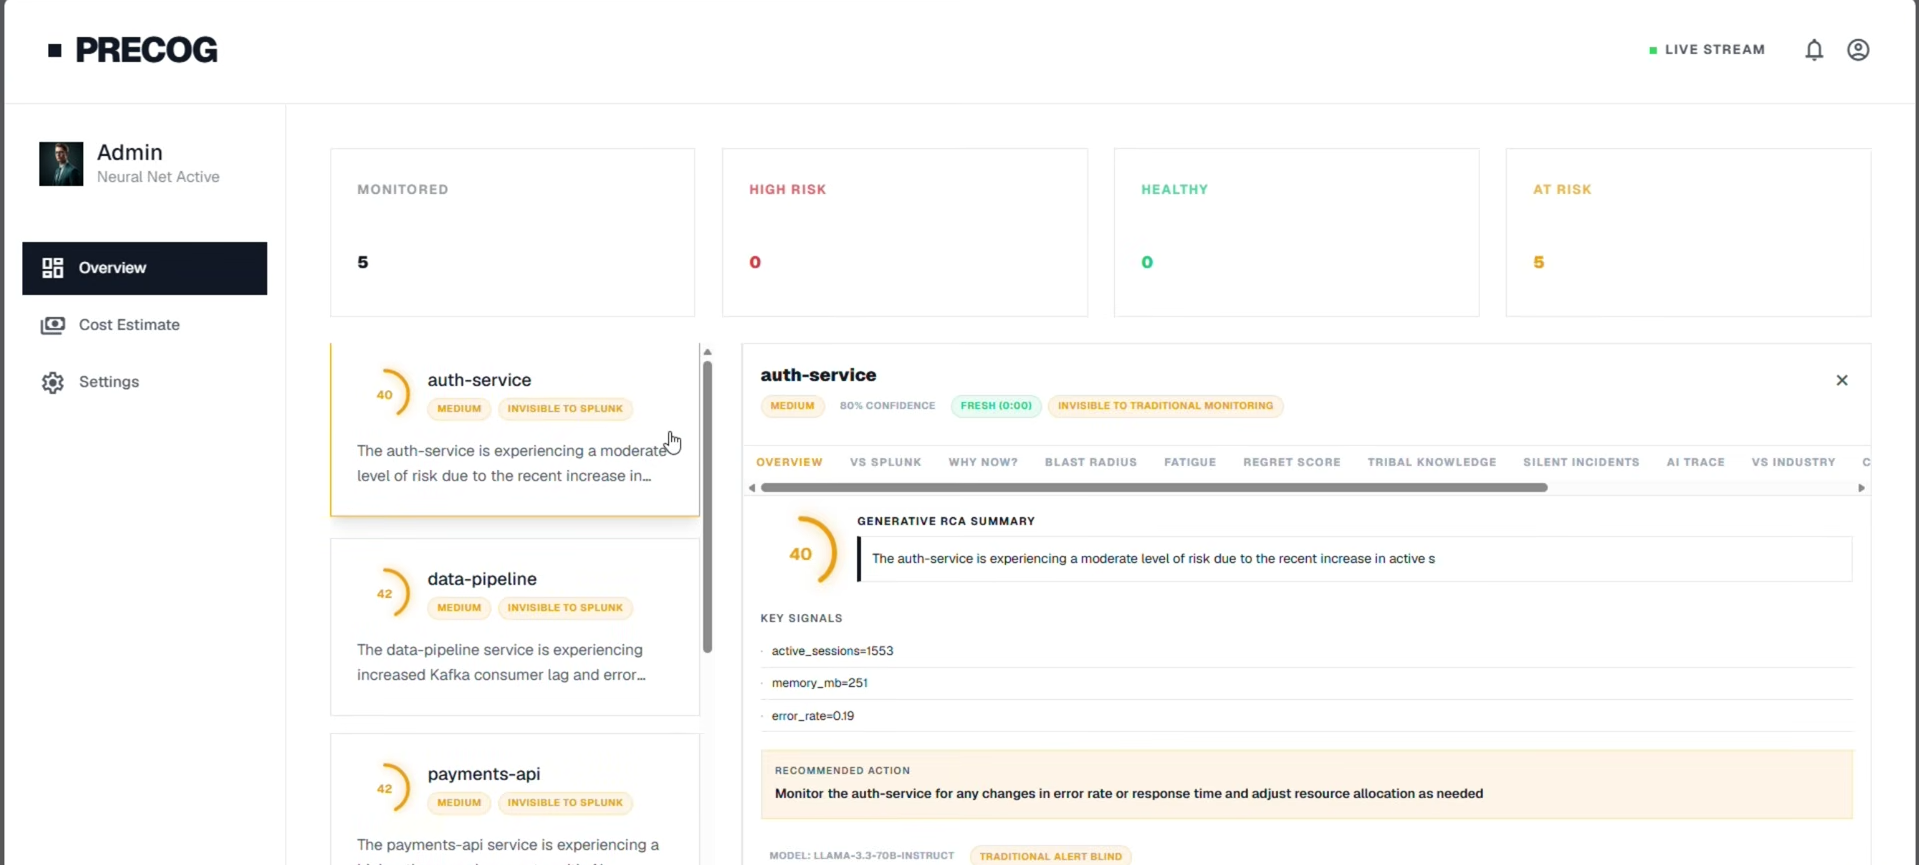
Inspiration
Every major outage follows the same pattern. The signals were always there — a CPU spike at 2 AM, a risky commit pushed without a review, an open P1 Jira bug nobody escalated, error rates creeping up by 0.3% per hour. Individually, none of these would trigger an alert. Together, they're a guaranteed outage in 15 minutes.
The problem isn't that engineering teams don't have data — they have too much of it. Splunk ingests thousands of events per second. GitHub logs every commit. Jira tracks every bug. Slack captures every deployment message. But all these signals live in silos, and today's monitoring tools only look at one dimension at a time.
We've all been in that war room at midnight — scrambling to understand what went wrong after the crash. We wanted to flip that. What if instead of a post-mortem, you had a pre-mortem? What if an AI was watching every data source simultaneously, connecting dots a human couldn't possibly connect, and warning you 15 minutes before the incident?
That's what PreCog is.
What it does
PreCog is a real-time pre-incident intelligence platform built on top of Splunk. It continuously monitors live log data across all your microservices and uses AI to predict which service is going to fail — and why — before any traditional alert would fire.
Risk Scoring: Every service gets a risk score from 0 to 100, updated every 30 seconds from live Splunk telemetry. The score isn't just based on error rates — it's a multi-signal AI assessment that considers log anomalies, deployment history, dependency health, infrastructure stress signals, and historical failure patterns.
Blast Radius Analysis: When PreCog detects a service at risk, it maps which downstream services will be impacted if it fails. If payments-api goes down, what else breaks? PreCog shows you the cascade before it happens.
Cost of Inaction: A live dollar counter shows the financial impact of waiting vs acting now. Every second a high-risk service is unaddressed, the estimated cost climbs — making the business case for early intervention impossible to ignore.
AI Cross-Signal Correlation: PreCog combines signals from Splunk logs, GitHub commits (risky late-night deploys, large diffs), Jira (open P1/P2 bugs in related components), and Slack (deployment announcements, incident mentions) and sends them all to NVIDIA NIM's LLM for holistic analysis. The LLM produces a structured prediction: risk level, explanation in plain English, key signals that triggered the alert, and a specific recommended action.
AI SRE Assistant: An embedded chatbot lets engineers ask questions in plain English — "What is happening with payments-api?", "What should I do right now?", "Which signals are most concerning?" — and get instant, contextual answers backed by live prediction data.
Native Splunk Integration: PreCog ingests data through Splunk's built-in Scripted Input mechanism. No HEC token, no forwarder, no external data pipeline needed. The script runs inside Splunk itself, making deployment simple and secure.
How we built it
Data Ingestion Layer — Splunk Scripted Input
We built precog_script_input.py, a Python script that runs natively inside Splunk's scripted input system every 60 seconds. It generates structured JSON telemetry events — CPU usage, memory, error rates, latency, log severity distribution — and writes them to stdout, which Splunk automatically ingests into the configured index. This approach means zero external dependencies for data ingestion: no HEC endpoint, no Kafka, no Lambda — just Splunk doing what Splunk does best.
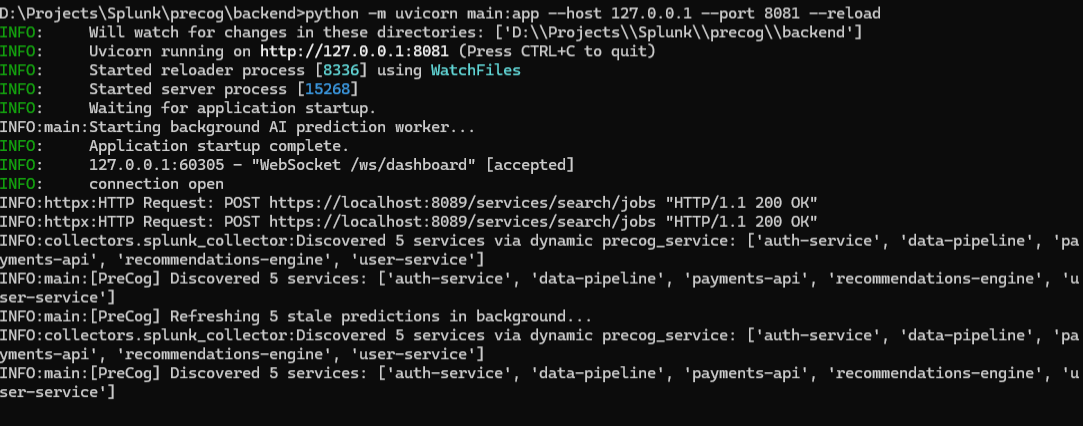
Signal Collection Layer — Multi-Source Collectors The FastAPI backend runs four parallel collectors on every prediction cycle:
SplunkCollector: queries the Splunk REST API for log anomalies, error spikes, and severity patterns across the last 5 minutesGitHubCollector: checks for recent commits — large diffs, off-hours deploys, commits touching high-risk filesJiraCollector: pulls open P1/P2 bugs related to each serviceSlackCollector: scans deployment channels for recent announcements that correlate with the current service
AI Correlation Engine — NVIDIA NIM
All collected signals are formatted into a structured prompt and sent to NVIDIA NIM's meta/llama-3.3-70b-instruct model via the OpenAI-compatible API. The prompt is carefully engineered to force consistent JSON output with specific fields: risk_score, risk_level, explanation, key_signals, blast_radius, recommended_action, confidence, and would_traditional_alert_catch. We implemented a 5-model fallback chain so that if one model is rate-limited or unavailable, the system automatically retries with the next model in the chain — ensuring predictions never stop.
Caching & Rate Limit Management With NVIDIA NIM's free tier limited to 40 requests per minute and 5 services being monitored, we implemented a 20-second prediction cache. Results are served from cache for fast WebSocket updates while background workers refresh stale predictions asynchronously. The AI chatbot uses locally-generated responses derived from cached prediction data, preserving the entire API quota for the core prediction engine.
Real-Time Frontend — React + WebSockets The React dashboard connects via WebSocket to receive live prediction updates. Recharts renders sparklines for each service showing risk trajectory over time. The UI shows risk cards with color-coded severity, blast radius graphs, cost counters that tick up in real time, and an AI assistant panel — all in a single-page app built with Vite.
Challenges we ran into
Structured LLM Output: Getting llama-3.3-70b-instruct to reliably output parseable JSON — not markdown-wrapped JSON, not prose with JSON embedded — required multiple iterations of prompt engineering. We solved it with strict system prompts, output format examples in the prompt, and a robust JSON extraction fallback that strips any surrounding text.
Splunk Scripted Input Quirks: Splunk's scripted input expects very specific stdout formatting. Any Python print() debug statements, warnings, or tracebacks get ingested as events. We had to carefully isolate all logging to stderr and ensure every stdout line was valid JSON.
Rate Limits Under Demo Load: During demo testing, predictions for 5 services simultaneously would exhaust the NVIDIA NIM rate limit in under 2 minutes. We solved this with the async background refresh system — only 1-2 LLM calls happen per cycle, staggered across services, with cached results filling the gaps.
WebSocket Stability: FastAPI's WebSocket connections dropped silently after a few minutes in testing. We implemented a heartbeat/ping mechanism on the backend and auto-reconnect logic on the frontend to keep the live connection stable throughout a demo.
Signal Correlation Tuning: Early versions of the LLM prompt would return "HIGH risk" for trivial fluctuations. We tuned the prompt to emphasize that individual signals are weak — the model should only raise risk when multiple signals converge. This dramatically reduced false positives.
What we learned
The biggest insight: cross-signal correlation is exponentially more powerful than single-source alerting. A 5% error rate increase is noise. A 5% error rate increase + a large deploy 20 minutes ago + an open P1 Jira bug + a Slack message saying "deploying to prod, fingers crossed" is a guaranteed incident. PreCog sees all four simultaneously.
We also learned that Splunk is much more than a log storage system. Its scripted input, REST API, and search capabilities make it a powerful real-time data platform that can serve as the backbone of an intelligent monitoring system without any additional infrastructure.
Finally, prompt engineering for structured output is a discipline of its own. Getting LLMs to be consistent data pipelines — not conversational assistants — requires treating the prompt as code: versioned, tested, and iterated.
What's next
- Auto-remediation: When PreCog's confidence exceeds 90%, automatically trigger rollbacks via CI/CD pipelines
- Splunk AI Toolkit integration: Use Splunk's native
| aiSPL command to run LLM inference directly inside Splunk searches - PagerDuty & Slack push alerts: Send pre-incident notifications to on-call engineers before risk scores peak
- Multi-environment support: Monitor dev, staging, and production simultaneously with environment-aware risk baselines
- Anomaly learning: Train service-specific baselines so PreCog learns what "normal" looks like for each microservice over time
Built With
- fastapi
- httpx
- meta/llama-3.3-70b-instruct
- nvidia-nim
- pydantic
- python
- react
- recharts
- splunk-enterprise
- splunk-rest-api
- splunk-scripted-input
- vite
- websockets

Log in or sign up for Devpost to join the conversation.