-
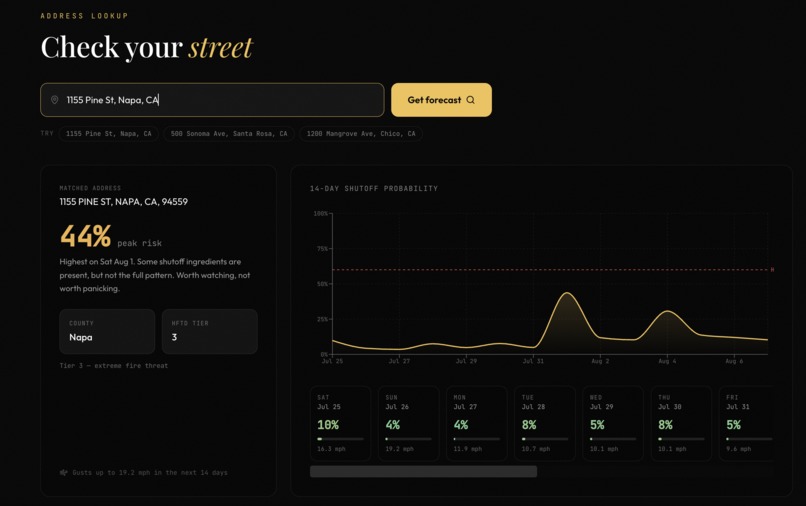
Look up an address and get outage risk for the next 14 days
-
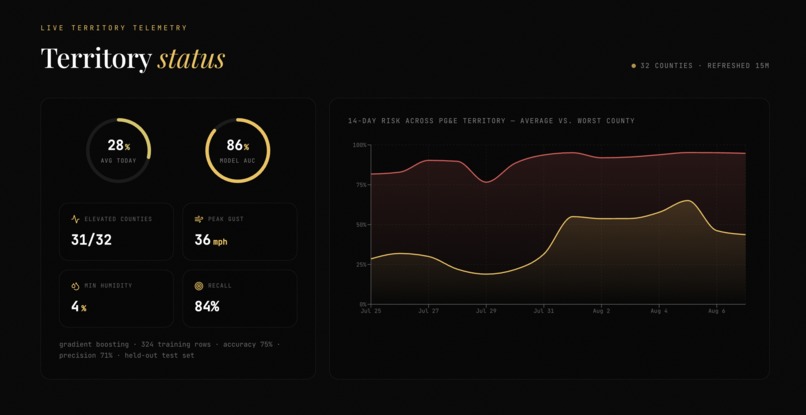
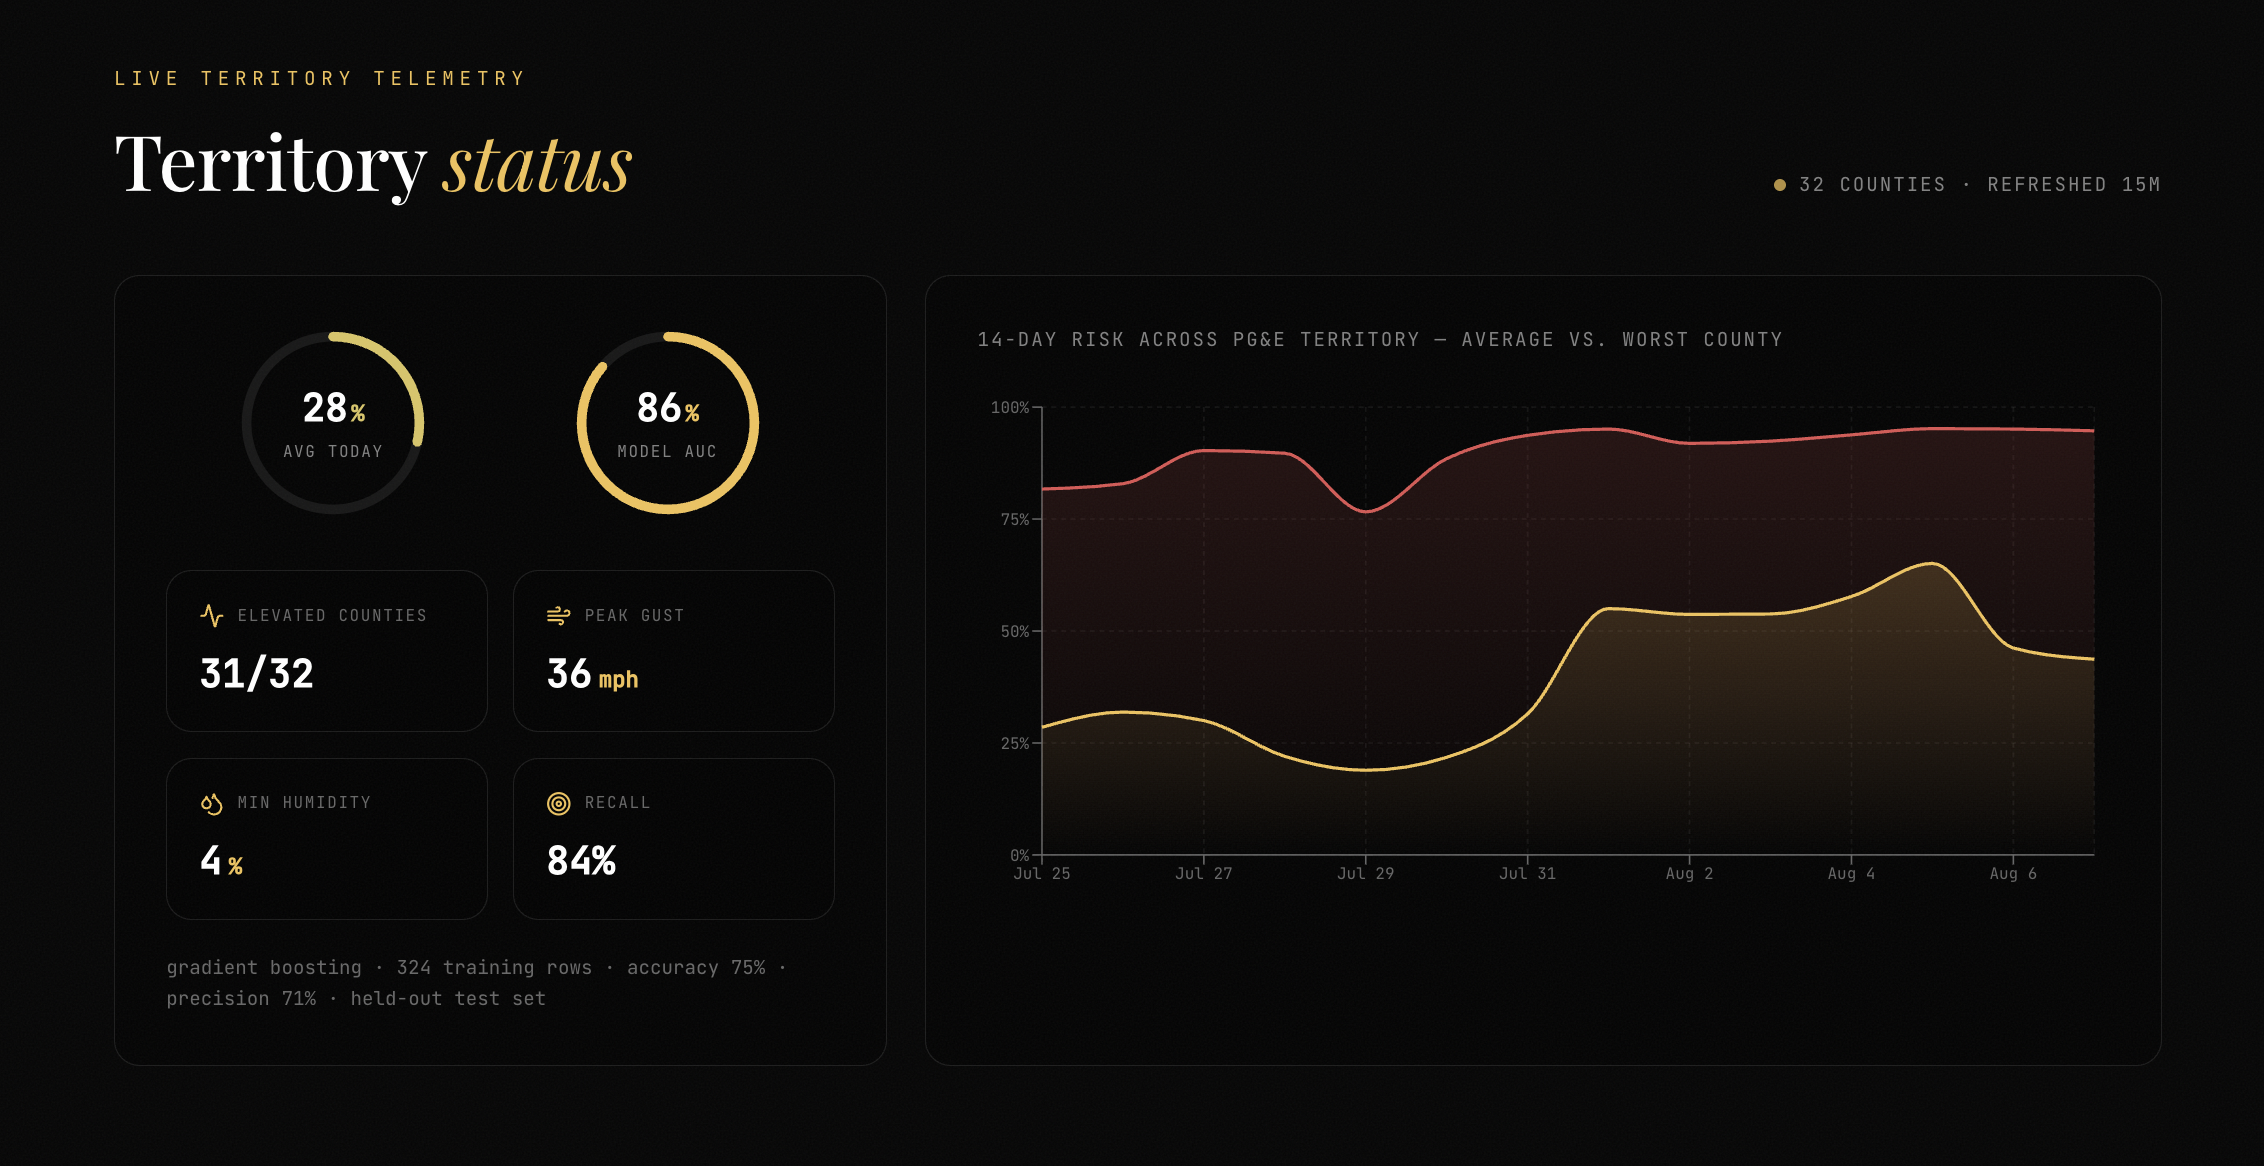
Live territory status: worst county vs territory average
-
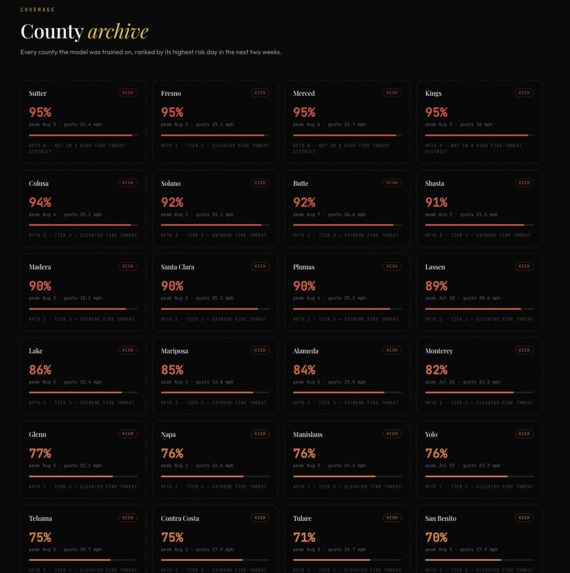
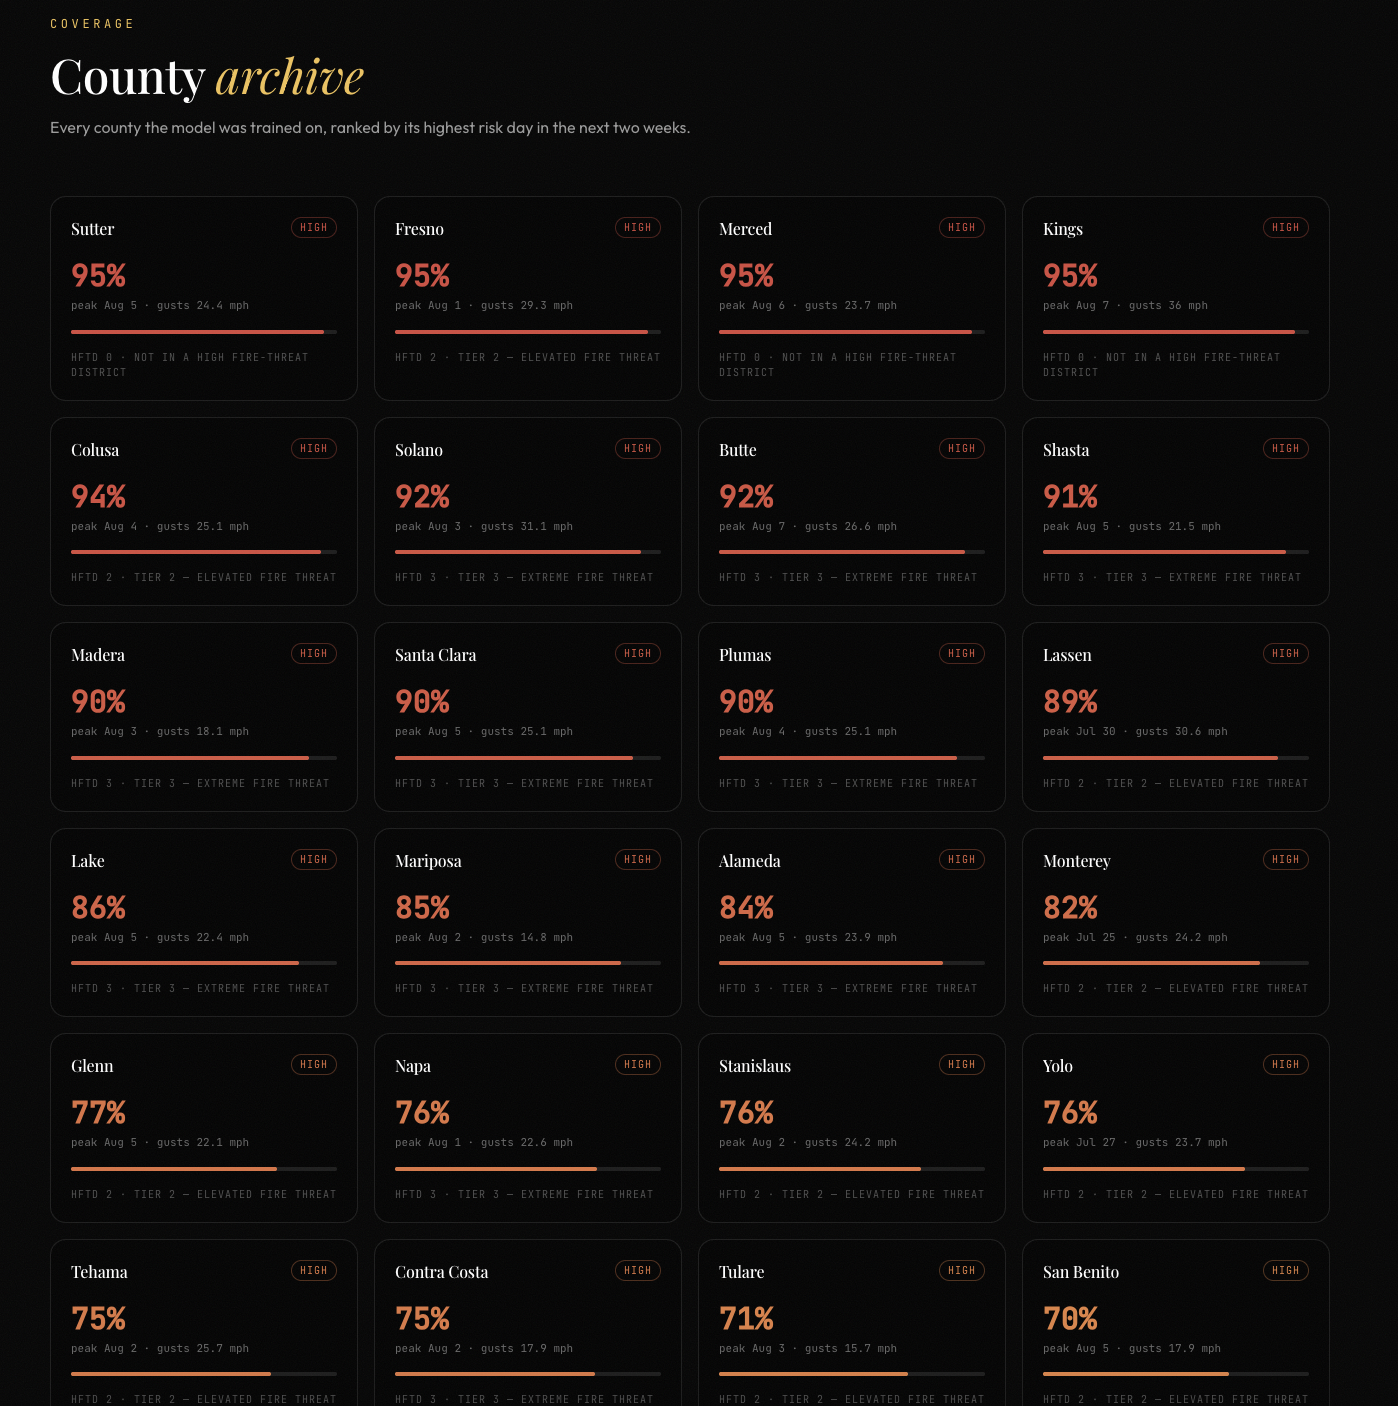
An archive of every county our model was trained on ranked by the highest risk day in the next two weeks
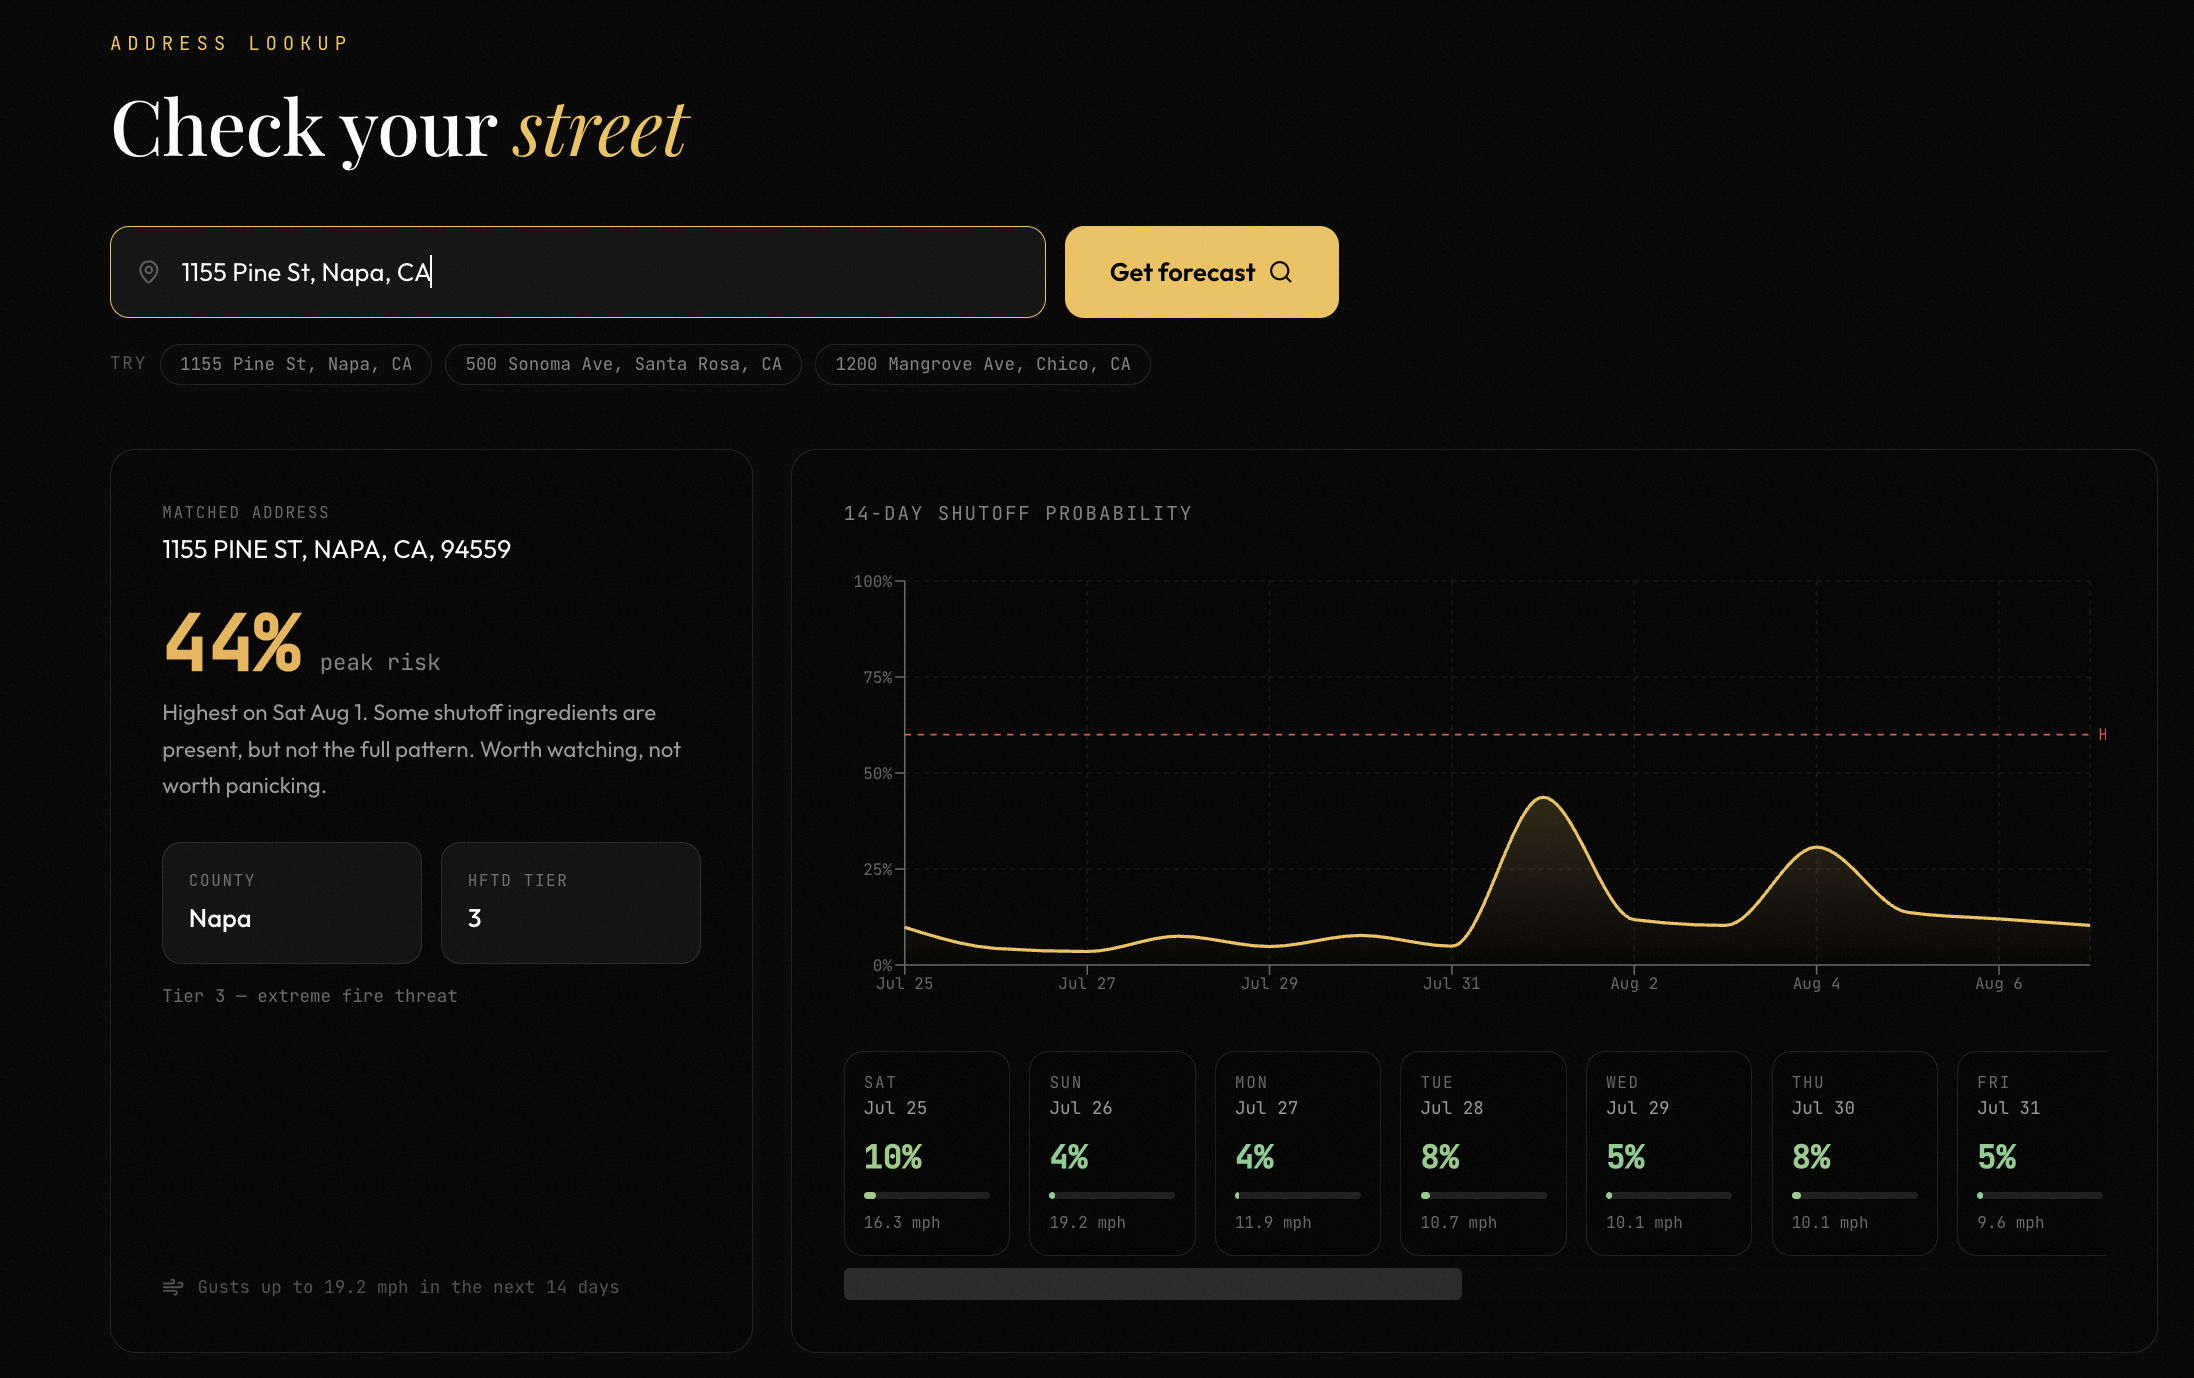
Inspiration
If you live in Northern California, then you must be no stranger to power outages. The wind picks up in October, and somewhere in your inbox there's a PG&E email saying your power might go out. However, this is simply an oversimplified warning that doesn't tell you much. That's the whole problem: PG&E runs Public Safety Power Shutoffs to keep lines from starting fires, which is the right call, but the customer-facing version of it is a binary notice that lands about 48 hours out. You can't plan around a maybe. If you're on home oxygen, or you run a small business with a walk-in freezer, or you just have a kid with homework, 48 hours isn't enough runway.
What bothered us is that all the inputs are already public. PG&E publishes HFTD (High Fire-Threat District) tier maps. They publish post-event PSPS reports listing exactly which counties got shut off on which days. Weather forecasts are free. Nobody had bothered to put those three things in the same room, so we did.
What it does
You type in an address and you get a 14-day, day-by-day probability that PSPS hits your area. Under the hood it's a four-step pipeline: the US Census Bureau geocoder turns your address into a county (free, no API key, no rate-limit drama), that county maps to an HFTD tier from the map baked into the model metadata, Open-Meteo returns 14 days of max wind speed, max gusts and hourly relative humidity for your coordinates, and the trained classifier scores each day and hands back a probability.
On top of the single-address lookup there's a live territory view that scores all 32 PG&E counties at once, a ranked county archive so you can see who's worst off this week, a map, and an alert signup that ties an address to a subscription. The thing we're most deliberate about is the honesty. The model was trained on PG&E data only, so if you search an address in San Diego it tells you the HFTD tier is unknown rather than confidently making something up. Every response carries an hftd_tier_known flag, and the model card at GET /api/model publishes the real held-out metrics instead of a marketing number.
How we built it
The dataset didn't exist, so we built it, and that was most of the work. We went through PG&E's post-event PSPS report PDFs (files like PSPS-Report-Letter-01.19.21.pdf) and pulled out 162 confirmed county-and-date shutoff events from 2021 onward. Then we sampled 162 non-event county-days as negatives and backfilled the weather for every single row from Open-Meteo's historical API. That's 324 rows, perfectly balanced, and every one of them is traceable: positive_rows_provenance.csv names the source PDF behind each positive, and negative_rows_provenance.csv records how each negative was sampled.
We kept the features deliberately few: HFTD tier, max wind speed, max gust, minimum humidity, and month. Month gets encoded as sin and cos so December and January sit next to each other instead of eleven units apart, and tier is one-hot over the tiers that actually appear (0, 2, 3). With 324 rows, anything more would have bought us overfitting and nothing else.
Model selection was done honestly. We split 80/20 stratified first, then ran 5-fold cross-validation on the training split only. Logistic regression got 0.863 AUC, random forest 0.873, gradient boosting 0.874. Gradient boosting won, so we retrained it on all the data for the deployed artifact. The held-out numbers are 0.862 ROC-AUC, 0.75 accuracy, 0.71 precision, 0.84 recall, 0.77 F1, with a confusion matrix of [[22, 11], [5, 27]]. That skew toward recall is on purpose: a false alarm means you charged your phone for nothing, a miss means your fridge dies while you're at work. We'd rather cry wolf.
The backend is FastAPI, with everything the frontend needs living under /api. It runs with zero infrastructure by default using an in-memory store and promotes to MongoDB if you set MONGO_URL. The /api/live endpoint batches all 32 county centroids into a single Open-Meteo request rather than 32 separate ones, and caches the resulting snapshot for 15 minutes since the underlying forecast only updates hourly. The frontend is React and Vite with Tailwind, Recharts for the 14-day curve, Framer Motion and Lenis for the scroll feel, and a Spline arc in the hero. Risk band thresholds (0.6 high, 0.35 moderate) are defined once in territory.py and shared with the UI so the wording can't drift between the API and the screen.
Challenges we ran into
There is no PSPS dataset. Not on Kaggle, not on data.gov, not anywhere. We spent the first stretch of this project reading utility PDFs and typing county names into a CSV, and half the reason we shipped a working model is that we stopped looking for data and went and made some.
After that, most of our pain was plumbing. scikit-learn version pinning bit us first: psps_model.joblib was pickled under 1.8.0 and flatly refuses to unpickle under 1.9.x, which is now a hard pin in requirements.txt and a note in RUNNING.md because we lost real time to it once already. Unpickling also needed a module that wasn't on the path. The pipeline was pickled while features.py was importable as a top-level module, since training runs from inside model/, so loading it from the backend meant joblib.load couldn't resolve it. risk_model.py now pushes model/ onto sys.path before importing, which is two ugly lines with a comment explaining exactly why they exist.
The subtler problem was county names having to match across three systems. The Census geocoder returns BASENAME, which happens to exclude the " County" suffix, so you get "Napa" rather than "Napa County." That lines up with our training data by luck as much as design, and a single mismatch would have silently defaulted every address to tier 0. That's the failure mode that scares us most: not a crash, a confidently wrong answer. Open-Meteo added its own wrinkles, returning an object for one location and a list for 32, and offering humidity hourly on one endpoint while exposing relative_humidity_2m_min directly on the other. Two code paths for one feature definition is an easy place to introduce a quiet skew. And scoring 32 counties is just slow; the first /api/live call takes 10 to 20 seconds, and while caching fixes every call for the next fifteen minutes, the first user still waits, which is why the UI streams in instead of sitting on a spinner.
Accomplishments that we're proud of
The dataset, honestly. 324 hand-verified rows with per-row provenance tracing back to a named PG&E report is a real artifact that outlives this hackathon, and anyone can audit where a label came from. Getting 0.86 held-out ROC-AUC out of five features and 324 rows, with no leakage and no test-set peeking during model selection, is the part we'd defend in front of a skeptical reviewer.
We're also proud that it genuinely works end to end with no API keys. The Census geocoder and Open-Meteo are both free and unauthenticated, so you can clone the repo, pip install, npm run dev, type an address and get a real forecast; there's no signup wall between a judge and a working demo. And we didn't oversell the model. The API description spells out the exact territory where results are trustworthy, unknown counties are flagged rather than guessed, and the metrics endpoint publishes the confusion matrix. For a project about telling people when to trust a warning, being trustworthy about our own limits felt non-negotiable.
What we learned
Data collection is the project. The modeling was maybe two hours of the build; sourcing and verifying labels took days. We understand now why so many "AI for X" demos quietly train on synthetic data, and why the ones that don't are worth more.
Small datasets punish complexity. Random forest and gradient boosting landed within 0.002 AUC of each other and logistic regression was barely behind, which told us feature quality was doing all the work and a deeper model would only have memorized noise. We also learned to choose the direction of our errors on purpose. 0.71 precision against 0.84 recall isn't a model that came out unbalanced, it's a product decision about which mistake costs a user more, made explicit.
Pickled models turned out to be a deployment surface in their own right. A .joblib file carries a hidden contract with both its library version and its import paths, so we now treat the model artifact as something to version and document rather than something you drop into a folder. And the smallest lesson with the biggest teeth: "Napa" versus "Napa County" can quietly destroy a prediction pipeline without ever raising an exception.
What's next for PowerRisk
More data, and more kinds of it. 324 rows is the floor, not the ceiling. Every PSPS season adds labels, and we want to work backward through the older reports too. There's already a red_flag_warning column sitting empty in the dataset; we built the schema for it and never filled it in, and NWS red flag warnings alongside fuel moisture and days-since-rain are the obvious next features.
We also want to go finer than the county. PG&E doesn't shut off counties, it shuts off circuits, so county-level tier lookup is a rough proxy for what's really a per-circuit decision, and moving to circuit or HFTD-polygon resolution would sharpen predictions a lot, especially in big, geographically split counties. Alongside that, the probabilities need calibrating. Right now a 0.7 is a useful ranking signal but not a promise that seven of ten such days end in a shutoff, and isotonic or Platt calibration on a proper holdout is what turns "high risk" from a vibe into a number you'd act on.
The alerts need to actually deliver. The subscription endpoint stores addresses today; next is the scheduled job that scores every subscribed address each morning and texts you when your risk crosses a threshold, which is the version people would keep on their phone. Before any of that touches a real user we'd harden the deployment too. CORS is wide open for the demo, the store defaults to in-memory, and there's no rate limiting, all fine for a hackathon and all things to fix. Then we leave PG&E. SCE and SDG&E run their own PSPS programs and publish their own reports, and the pipeline is utility-agnostic even if the training data isn't. Same approach, three more datasets, and it covers most of California.

Log in or sign up for Devpost to join the conversation.