Inspiration
- I see user power data, it looks good.
- I see Streamlit, it looks GOOD.
- BAM - PowerRanger
What it does
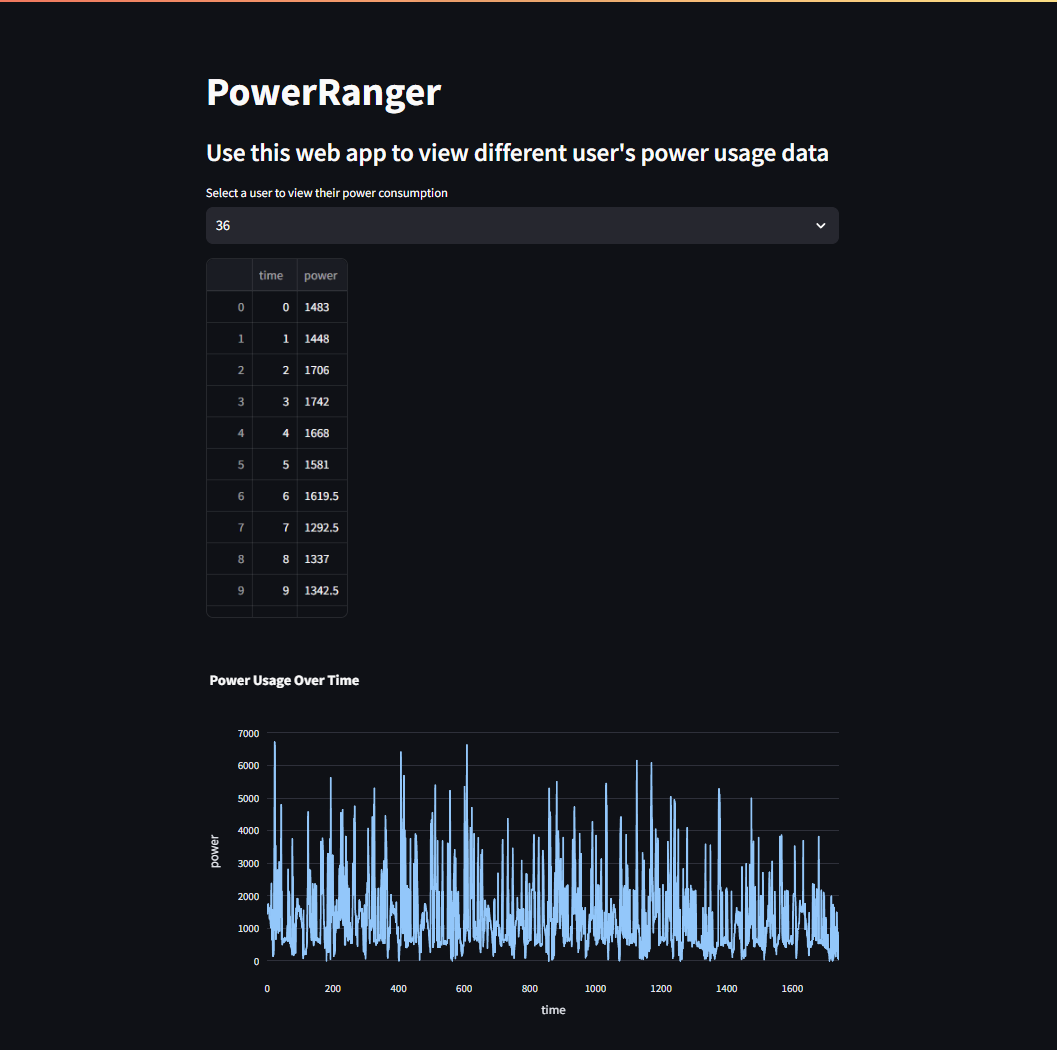
- Draws graph of power consumption data against time for the selected user
How I built it
- In a very short time hehe
Challenges we ran into
- I started off working in a team to try and solve SolarZero's challenge No.3, but that met an unfortunate end when we realised what we had identified were some mistakes in the data, not the solution we had hoped for
- Making the graph behave
- Pre-processing the data before plotting it to reduce effect of errors and missing data
Accomplishments that we're proud of
- Finding an exploit in the data involving an infinite number of solar panels...
- It works YEY
- Even the name is a masterpiece of its own
What I learned
- This was my first hackathon, so I learnt a lot about how they work and am wayyy better prepared for the next one
- Using GitHub with my team
- How to use Streamlit at a basic level and I'm excited to use it for larger, more complex projects in the future to make the most of my experience using python
What's next for PowerRanger
It's morphin' time.
Built With
- python
- streamlit

Log in or sign up for Devpost to join the conversation.