-
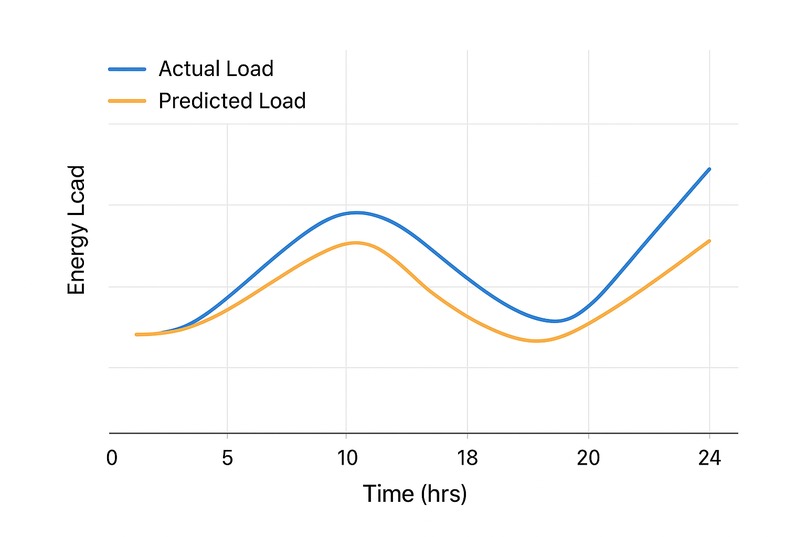
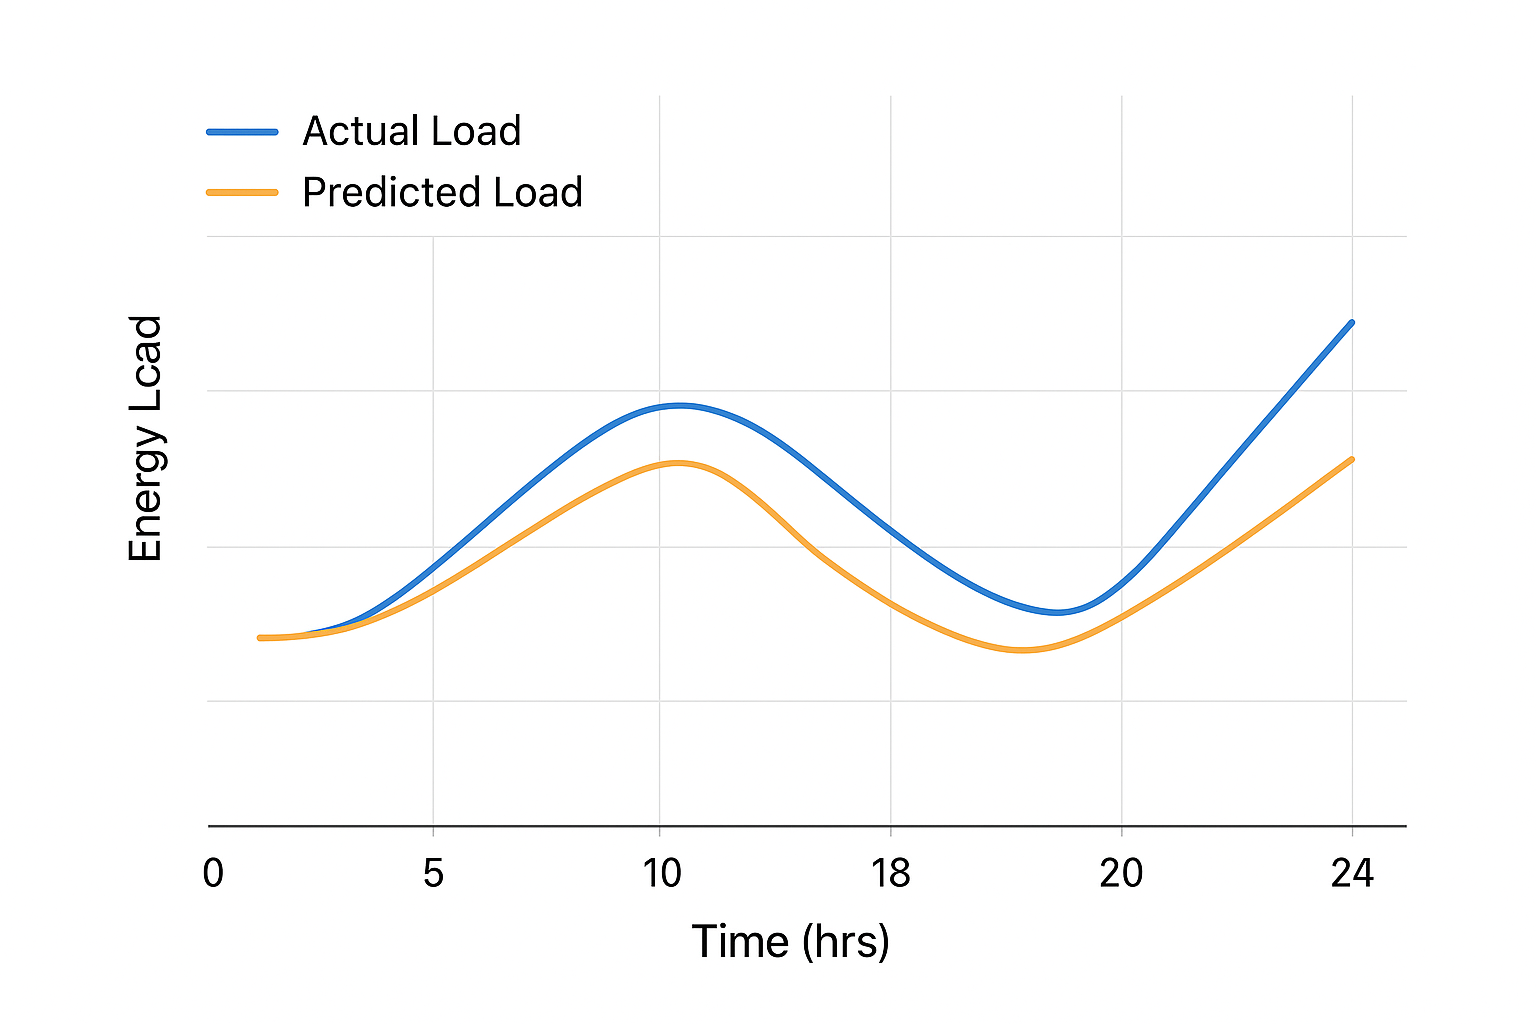
A comparitive graph between actual load and predicted load
-
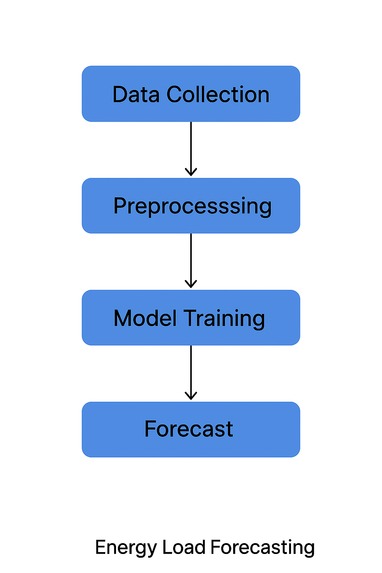
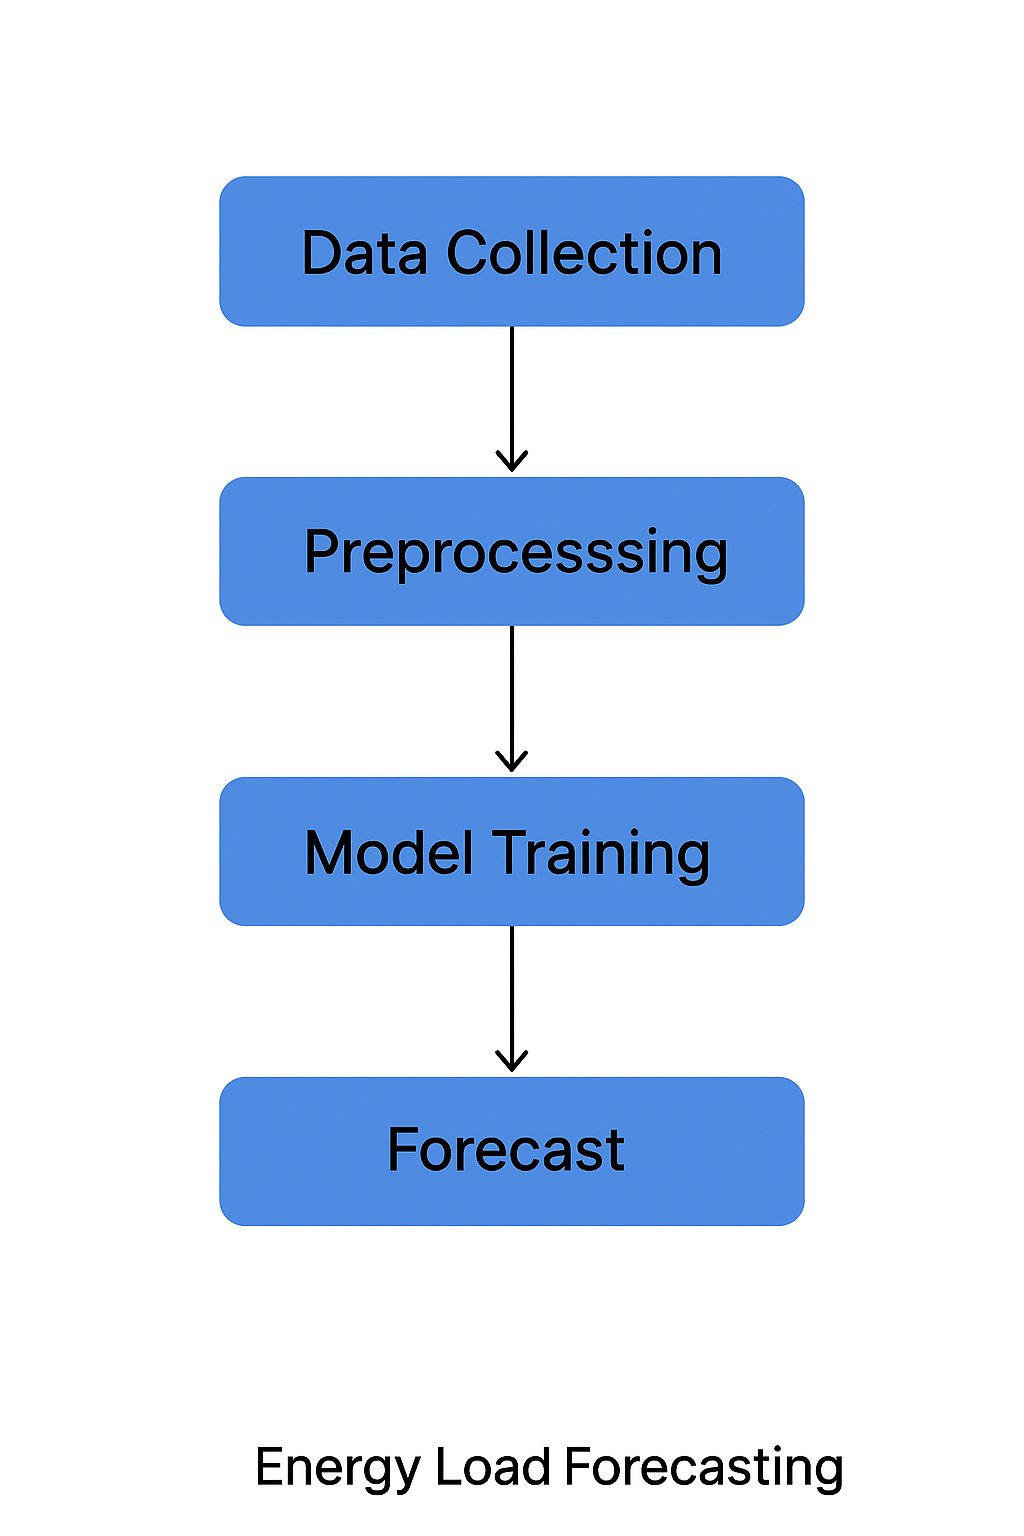
Flowchart
-
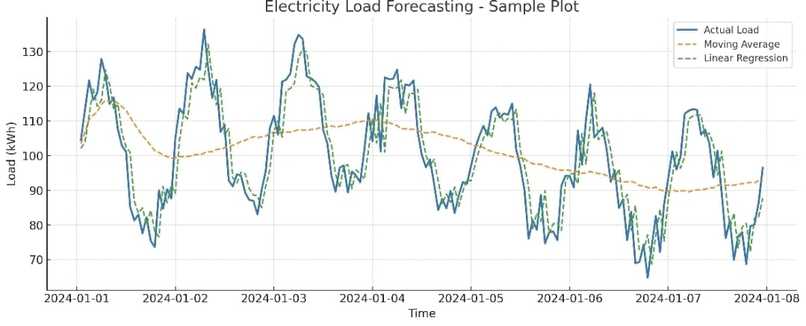
A comparision between Linear Regression and Moving Average , Linear Regression being more accurate.

Inspiration : With the increasing demand for electricity and frequent grid fluctuations, we wanted to explore how data and AI can help predict short-term energy usage. Our inspiration came from the need to build smarter, more reliable power systems that reduce wastage and outages.
What it does :
"PowerPredict" analyzes past energy consumption data and provides short-term forecasts (next few hours or day). These predictions can help utilities plan supply more effectively and ensure stable energy distribution.
How I built it :
- Collected sample datasets of energy consumption in CSV format
- Preprocessed the data using "Python, Pandas, and NumPy"
- Applied "Scikit-learn regression models" to build forecasting models
- Visualized trends and predictions with "Matplotlib"
- Created a simple interactive web app using "Streamlit" to showcase results
Challenges I ran into :
- Finding clean and reliable energy datasets
- Understanding time-series forecasting techniques as beginners
- Handling missing data and irregular time intervals
- Deploying the model into a simple app for demonstration
- Understanding time-series forecasting techniques as beginners
Accomplishments that I'm proud of :
- Successfully building our first energy load forecasting model
- Creating clear visualizations that show actual vs predicted demand
- Learning to deploy a working prototype in a short time frame
- Creating clear visualizations that show actual vs predicted demand
What I learned :
- Basics of time-series forecasting and machine learning
- Importance of data preprocessing and cleaning
- How to build and share interactive apps using Streamlit
- Teamwork and managing tasks under hackathon deadlines
- Importance of data preprocessing and cleaning
What's next for PowerPredict :
- Experimenting with advanced models like LSTM/GRU for more accurate forecasts
- Expanding to real-time data input and live predictions
- Adding renewable energy forecasting (like solar/wind)
- Deploying the app on cloud platforms for broader accessibility
- Expanding to real-time data input and live predictions
Built With
- csv
- matplotlib
- numpy
- pandas
- python
- scikit-learn
- streamlit

Log in or sign up for Devpost to join the conversation.