-
-
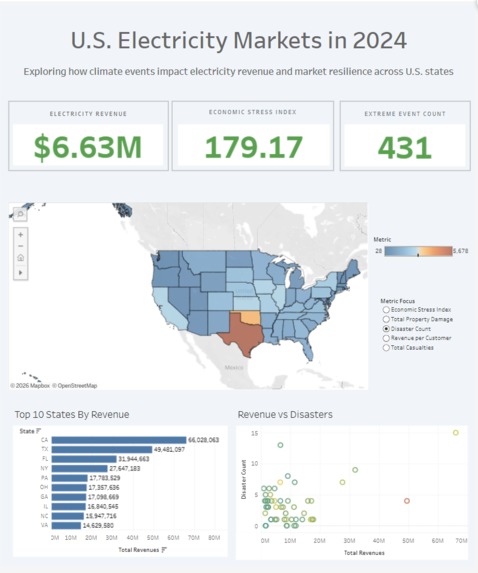
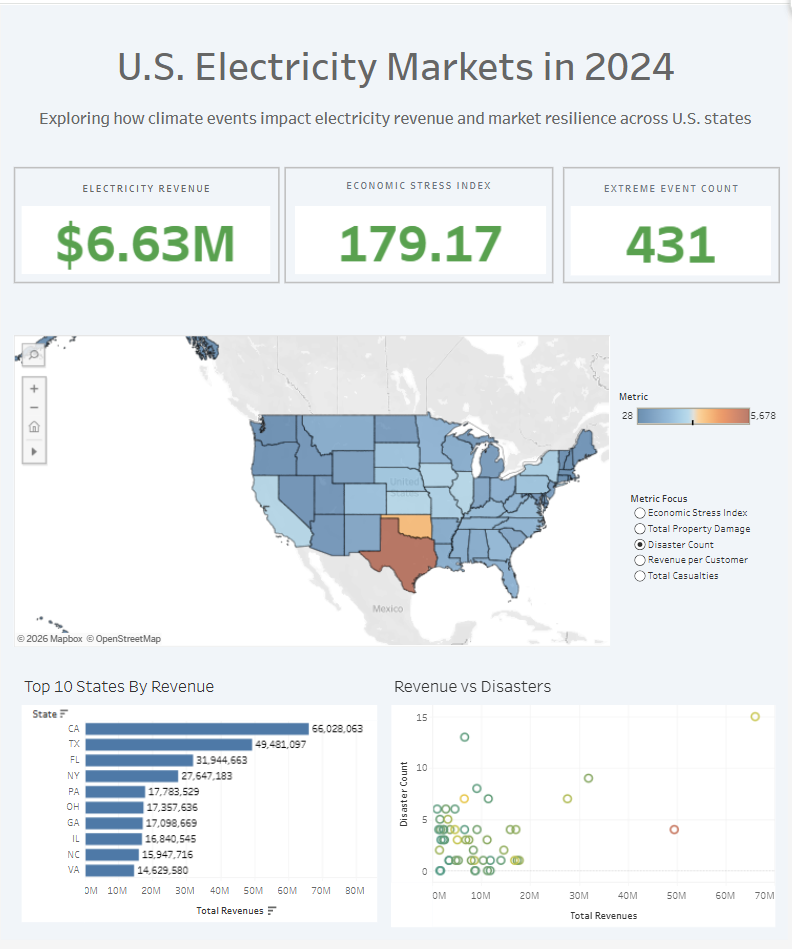
An interactive Tableau dashboard analyzing how disasters impact electricity revenue across U.S. states.
Inspiration
Extreme weather events are becoming more frequent, but their economic impact is often discussed in abstract terms. I was curious about what these events actually mean for critical infrastructure, especially electricity providers that communities rely on during and after disasters. I wanted to explore how extreme events affect electricity revenue at the state level and use Tableau to turn complex public data into something decision-makers can quickly understand.
What it does
This project combines electricity revenue data from the U.S. Energy Information Administration (EIA) with disaster declarations from Federal Emergency Management Agency (FEMA) and extreme weather events from National Oceanic and Atmospheric Administration (NOAA) to analyze how natural disasters impact the electricity sector across U.S. states. This dashboard helps users understand how electricity revenue and exposure relate to extreme weather exposure across U.S. states in 2024.
How I built it
I built this project end-to-end by combining public electricity and disaster datasets, cleaning and aligning them at the state level, and designing an interactive Tableau Cloud dashboard.
U.S. Energy Information Administration (EIA) State-level electricity revenue, sales, and customer data. Sales_Ult_Cust_2024 (2024 final data) https://www.eia.gov/electricity/data/eia861/
Federal Emergency Management Agency (FEMA) Disaster Declarations Declared disaster activity by state. OpenFEMA Dataset Disaster Declarations Summaries – V2. https://www.fema.gov/openfema-data-page/disaster-declarations-summaries-v2
NOAA Storm Events Database (2024 – Locations File) data to measure extreme weather events, property damage, crop damage, and casualties. National Centers for Environmental Information (NCEI), NOAA. File: StormEvents_locations-ftp_v1.0_d2024_c20251204.csv.gz https://www.ncei.noaa.gov/pub/data/swdi/stormevents/csvfiles/
Data Preprocessing
All the data preparation was done in Python (pandas) using Jupyter Notebook.
Key steps included:
- Filtering all datasets to 2024 to ensure consistency.
- Cleaning and converting NOAA fields into numeric values.
- Aggregating NOAA events by state and year to calculate extreme event counts, property damage and crop damage. Aggregating FEMA data by state and year to calculate disaster counts.
- Standardizing state abbreviations so all datasets could be accurately joined
- Merged EIA,FEMA, and NOAA datasets into a single analytical table.
Metric design
From the merged dataset, I derived business-relevant metrics such as: Economic Stress Index
This index combines event frequency, financial impact, and human impact, weighted to reflect how strongly extreme events translate into economic pressure at the state level:
- Extreme Event Count (40%): Captures how often disruptive events occur. Frequent events increase operational strain and recovery costs.
- Property Damage scaled by Total Electricity Revenue ( 30%): Measures the severity of physical damage relative to the size of the state's electricity economy.
- Crop Damage scaled by Total Electricity Revenue (20%): Accounts for indirect economic stress from agricultural losses.
- Total Casualties (10%): Represents human and social impact, acknowledging that severe events impose costs beyond financial losses.
This index was created as a practical way to combine how often extreme events occur, how much damage they cause, and their human impact into a single comparison. The weights are based on domain intuition rather than expert tuning. Frequent events and infrastructure damage tend to create the most consistent pressure, while casualties and proportional economic loss add important context
Tableau dashboard development
I published the final dataset to Tableau Cloud and built the dashboard using:
- KPI cards
- An interactive U.S. state map that updates coloring based on the selected performance metric.
- Interactive filters and parameters allow users to explore different states
- Revenue vs Disasters and States by Revenue plots
- Tooltips to show additional context
All interactivity was implemented natively in Tableau Cloud.
Challenges I ran into
One of the main challenges was working with large public datasets that used different formats and levels of aggregation. Aligning state identifiers and handling inconsistent values required careful preprocessing.
Accomplishments that I'm proud of
I'm proud of building an end-to-end analytics project from raw public data to a fully interactive Tableau dashboard. I also designed a custom Economic Stress Index metric to translate complex disaster and electricity data into a clear and comparable signal.
What I learned
The dashboard shows that extreme events do not impact all states equally, even when electricity revenue is high. Some states experience frequent events but relatively lower economic pressure, while others face fewer events that translate into much higher stress due to damage and casualties relative to revenue. This highlights how exposure, scale, and economic capacity interact differently across states, and why event frequency alone is not enough to understand risk.
What's next for Powering Through Disasters: Electricity Revenue & Risk
With more time, this project could be expanded by:
- Adding multi-year trend analysis
- Modeling predictive risk scenarios


Log in or sign up for Devpost to join the conversation.