-
-
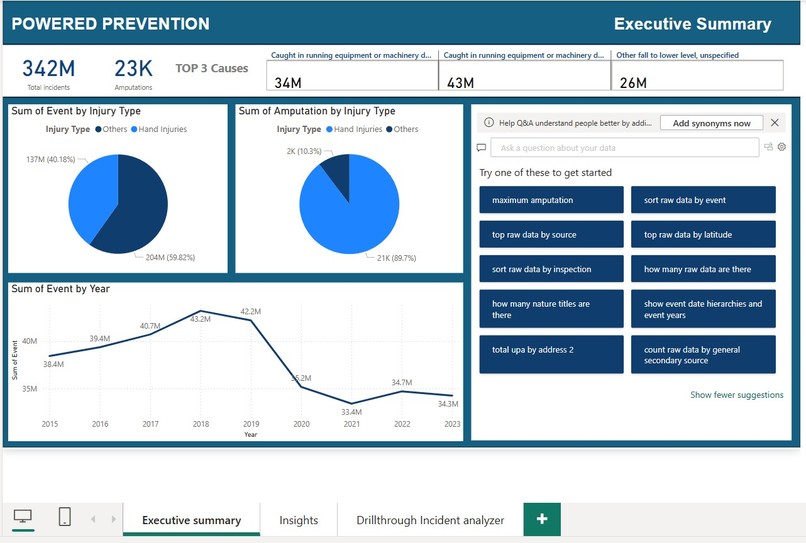
Executive Summary
-
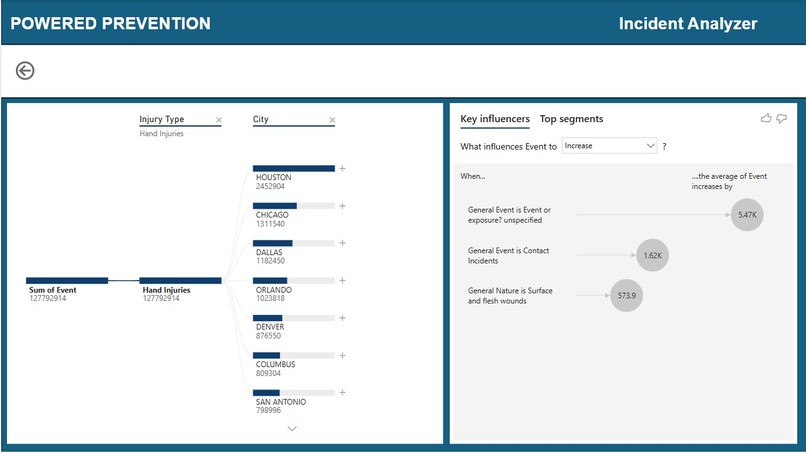
AI insights & incident analyzer
-
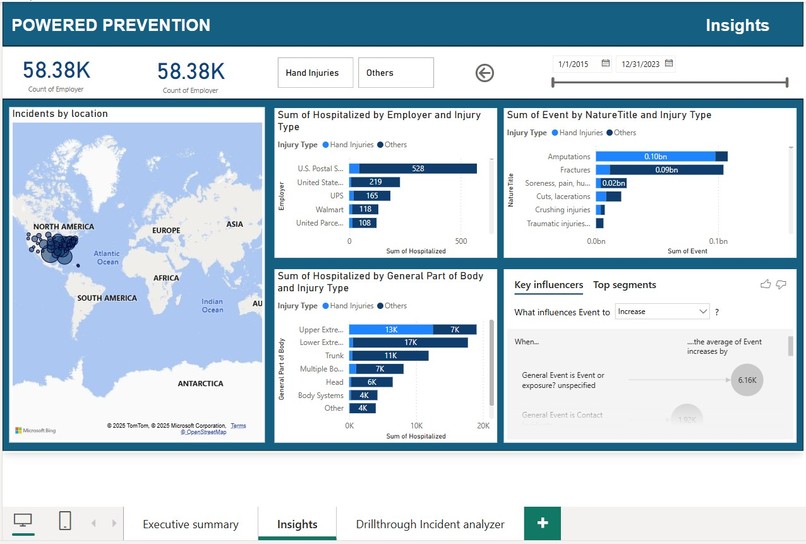
Insights
-
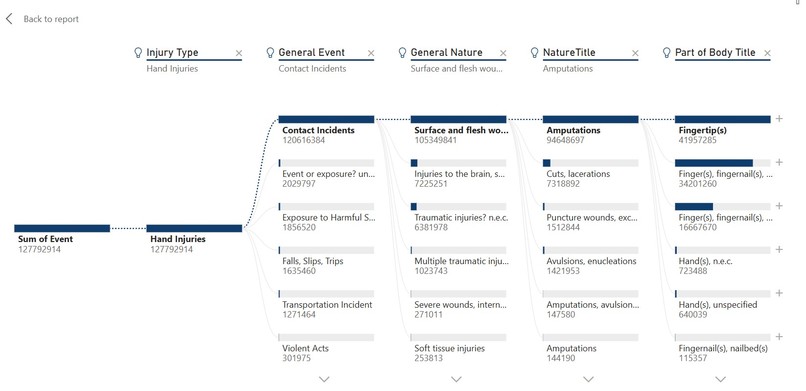
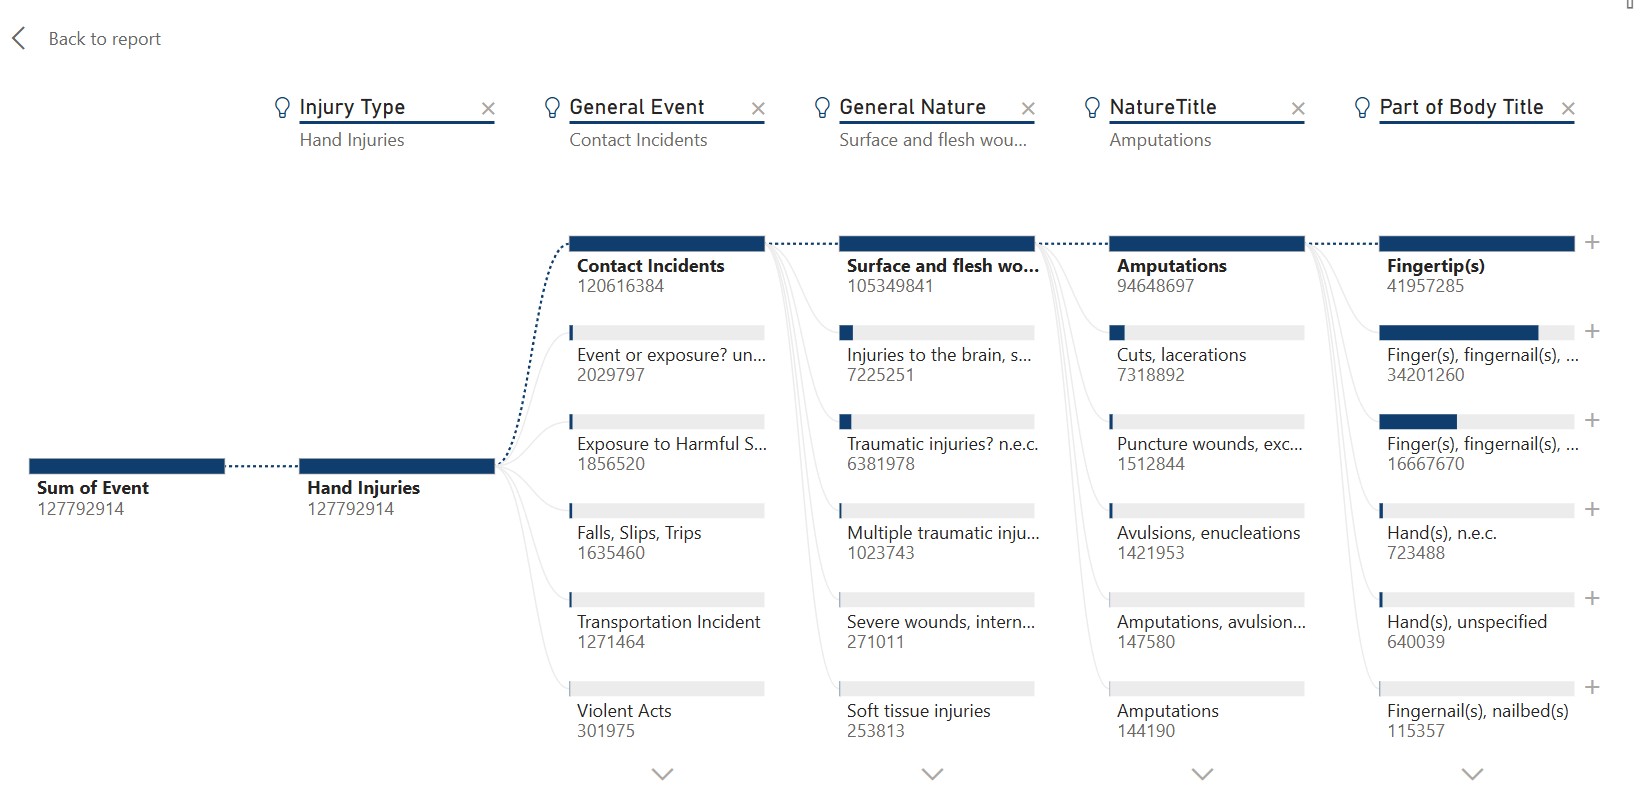
Decomposition Tree analysis
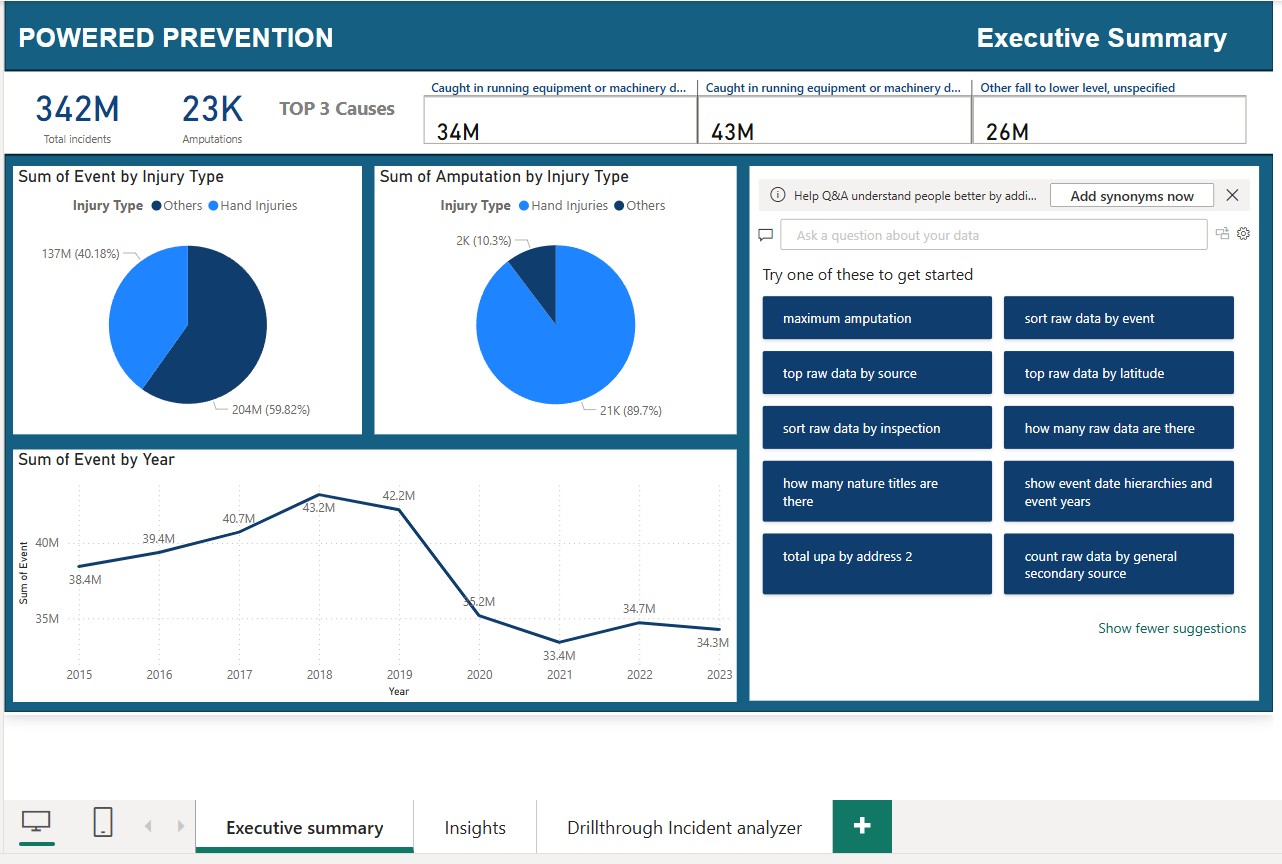
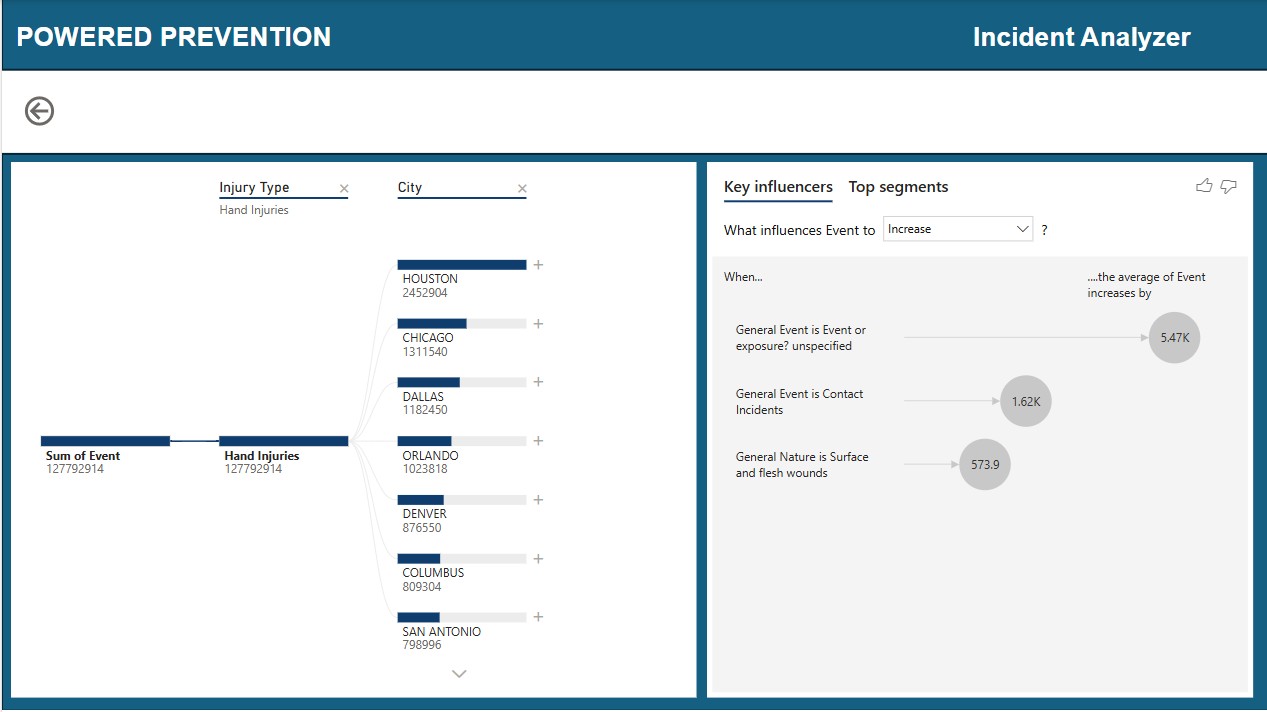
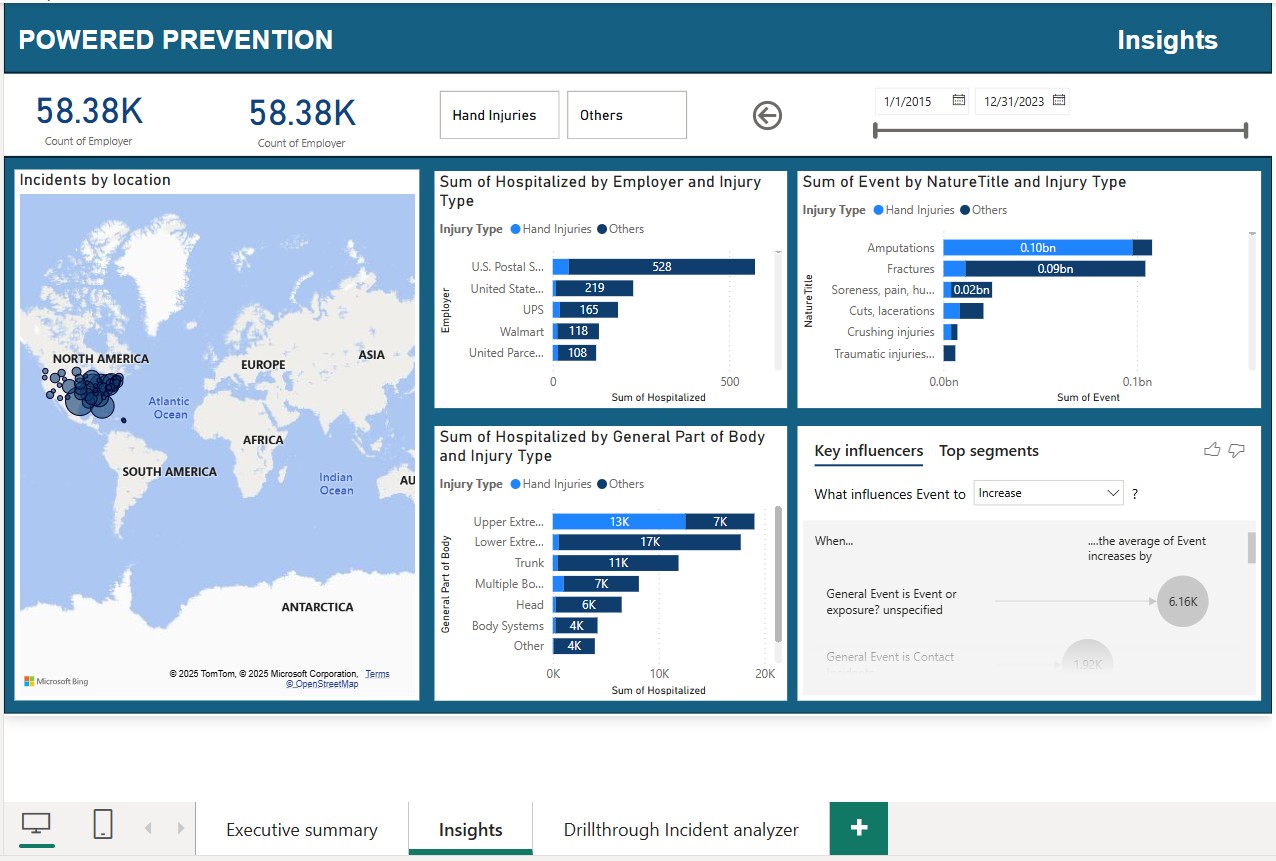
        Coming from a construction background, I know how vital safety is on the job. During my internship as a Safety Enforcement Officer at CBRE, I saw how even small oversights can lead to big consequences. That experience motivated me to use data and dashboards to help prevent injuries before they happen.
          Powered Prevention is a Power BI dashboard that analyzes OSHA injury reports. It focuses on hand injuries in manufacturing and uses AI to pull out key insights from incident descriptions. It helps identify common causes so companies can take action.
How I built it I cleaned the data, filtered for manufacturing hand injuries, and used AI to find patterns in injury descriptions. Then, we built a clear, interactive dashboard in Power BI to show trends, causes, and hotspots. It was a good challenge working with unstructured text data and turning it into useful categories. Making the dashboard both insightful and easy to use also took time and testing.
Through this hackathon I have learned how AI and data visuals can turn raw reports into real-world safety improvements. I also learned the importance of clear, user-friendly design.
As a next advancement, I plan to add predictive features and expand beyond hand injuries. The goal is to build a full safety analytics tool that helps prevent injuries across all types of work.
Built With
- powerbi

Log in or sign up for Devpost to join the conversation.