-
-
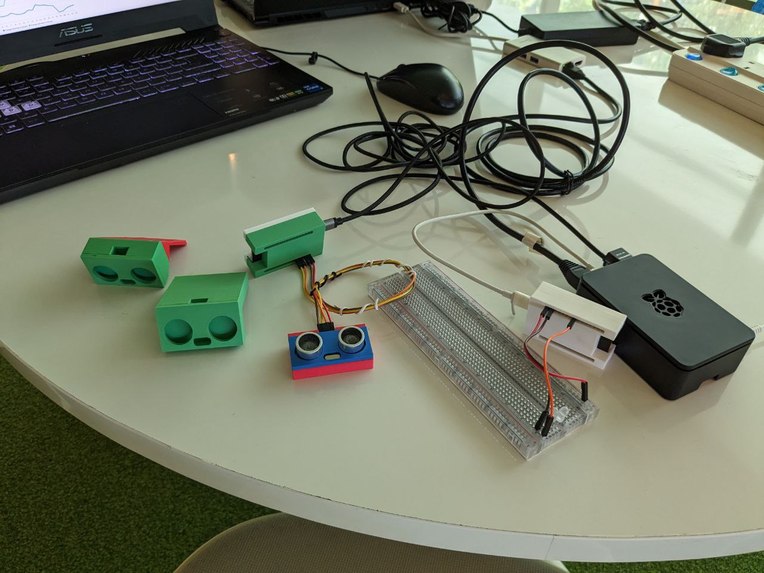
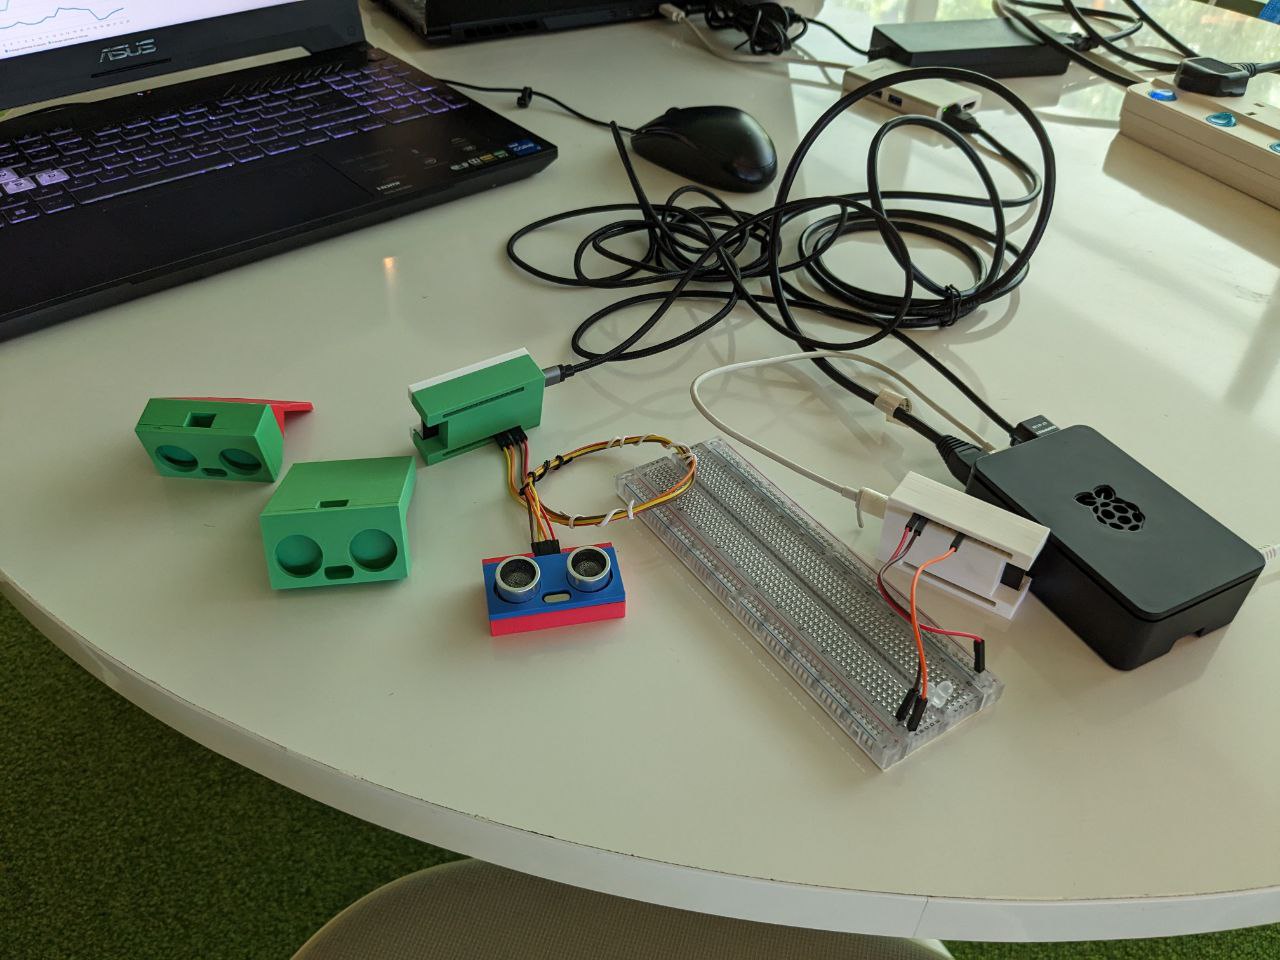
Actual devices
-
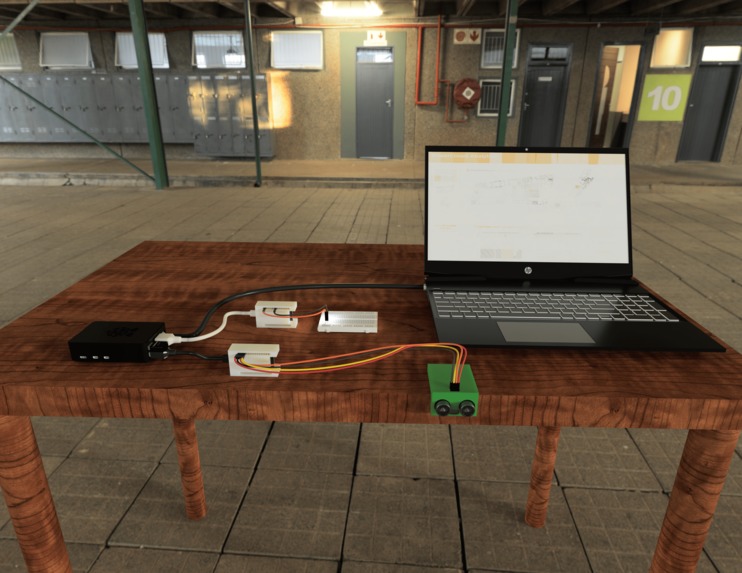
The full setup 1
-
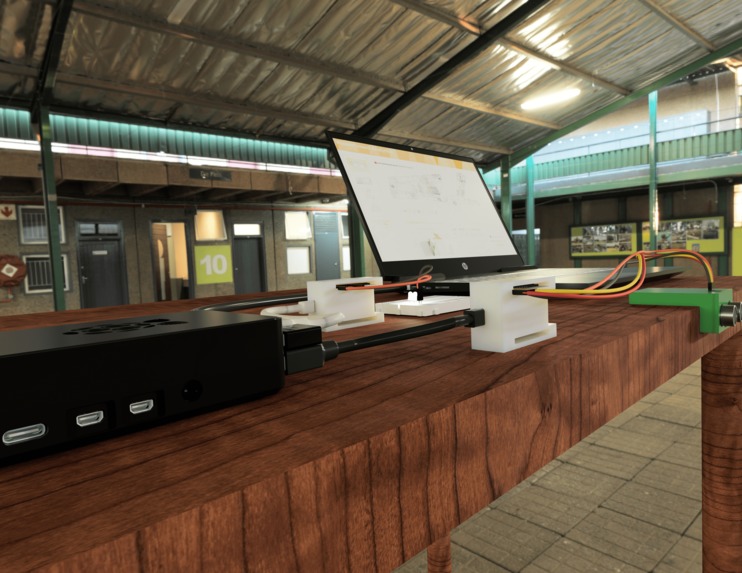
The full setup 2
-
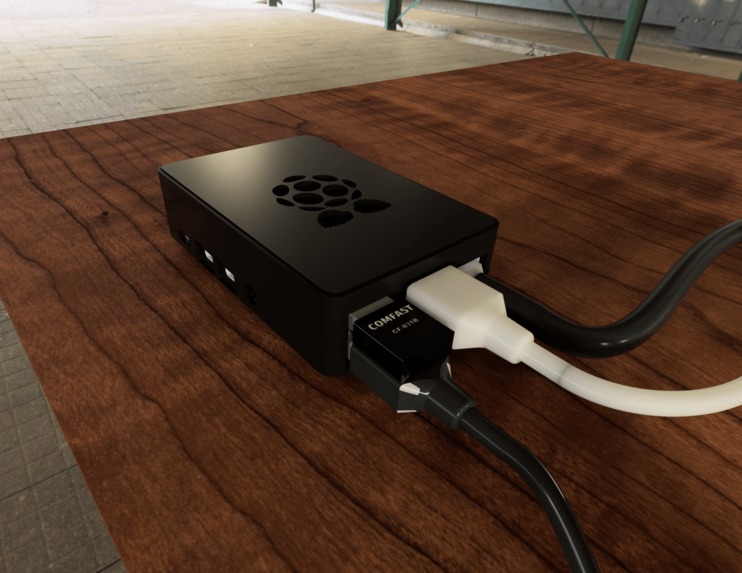
Raspberry Pi
-

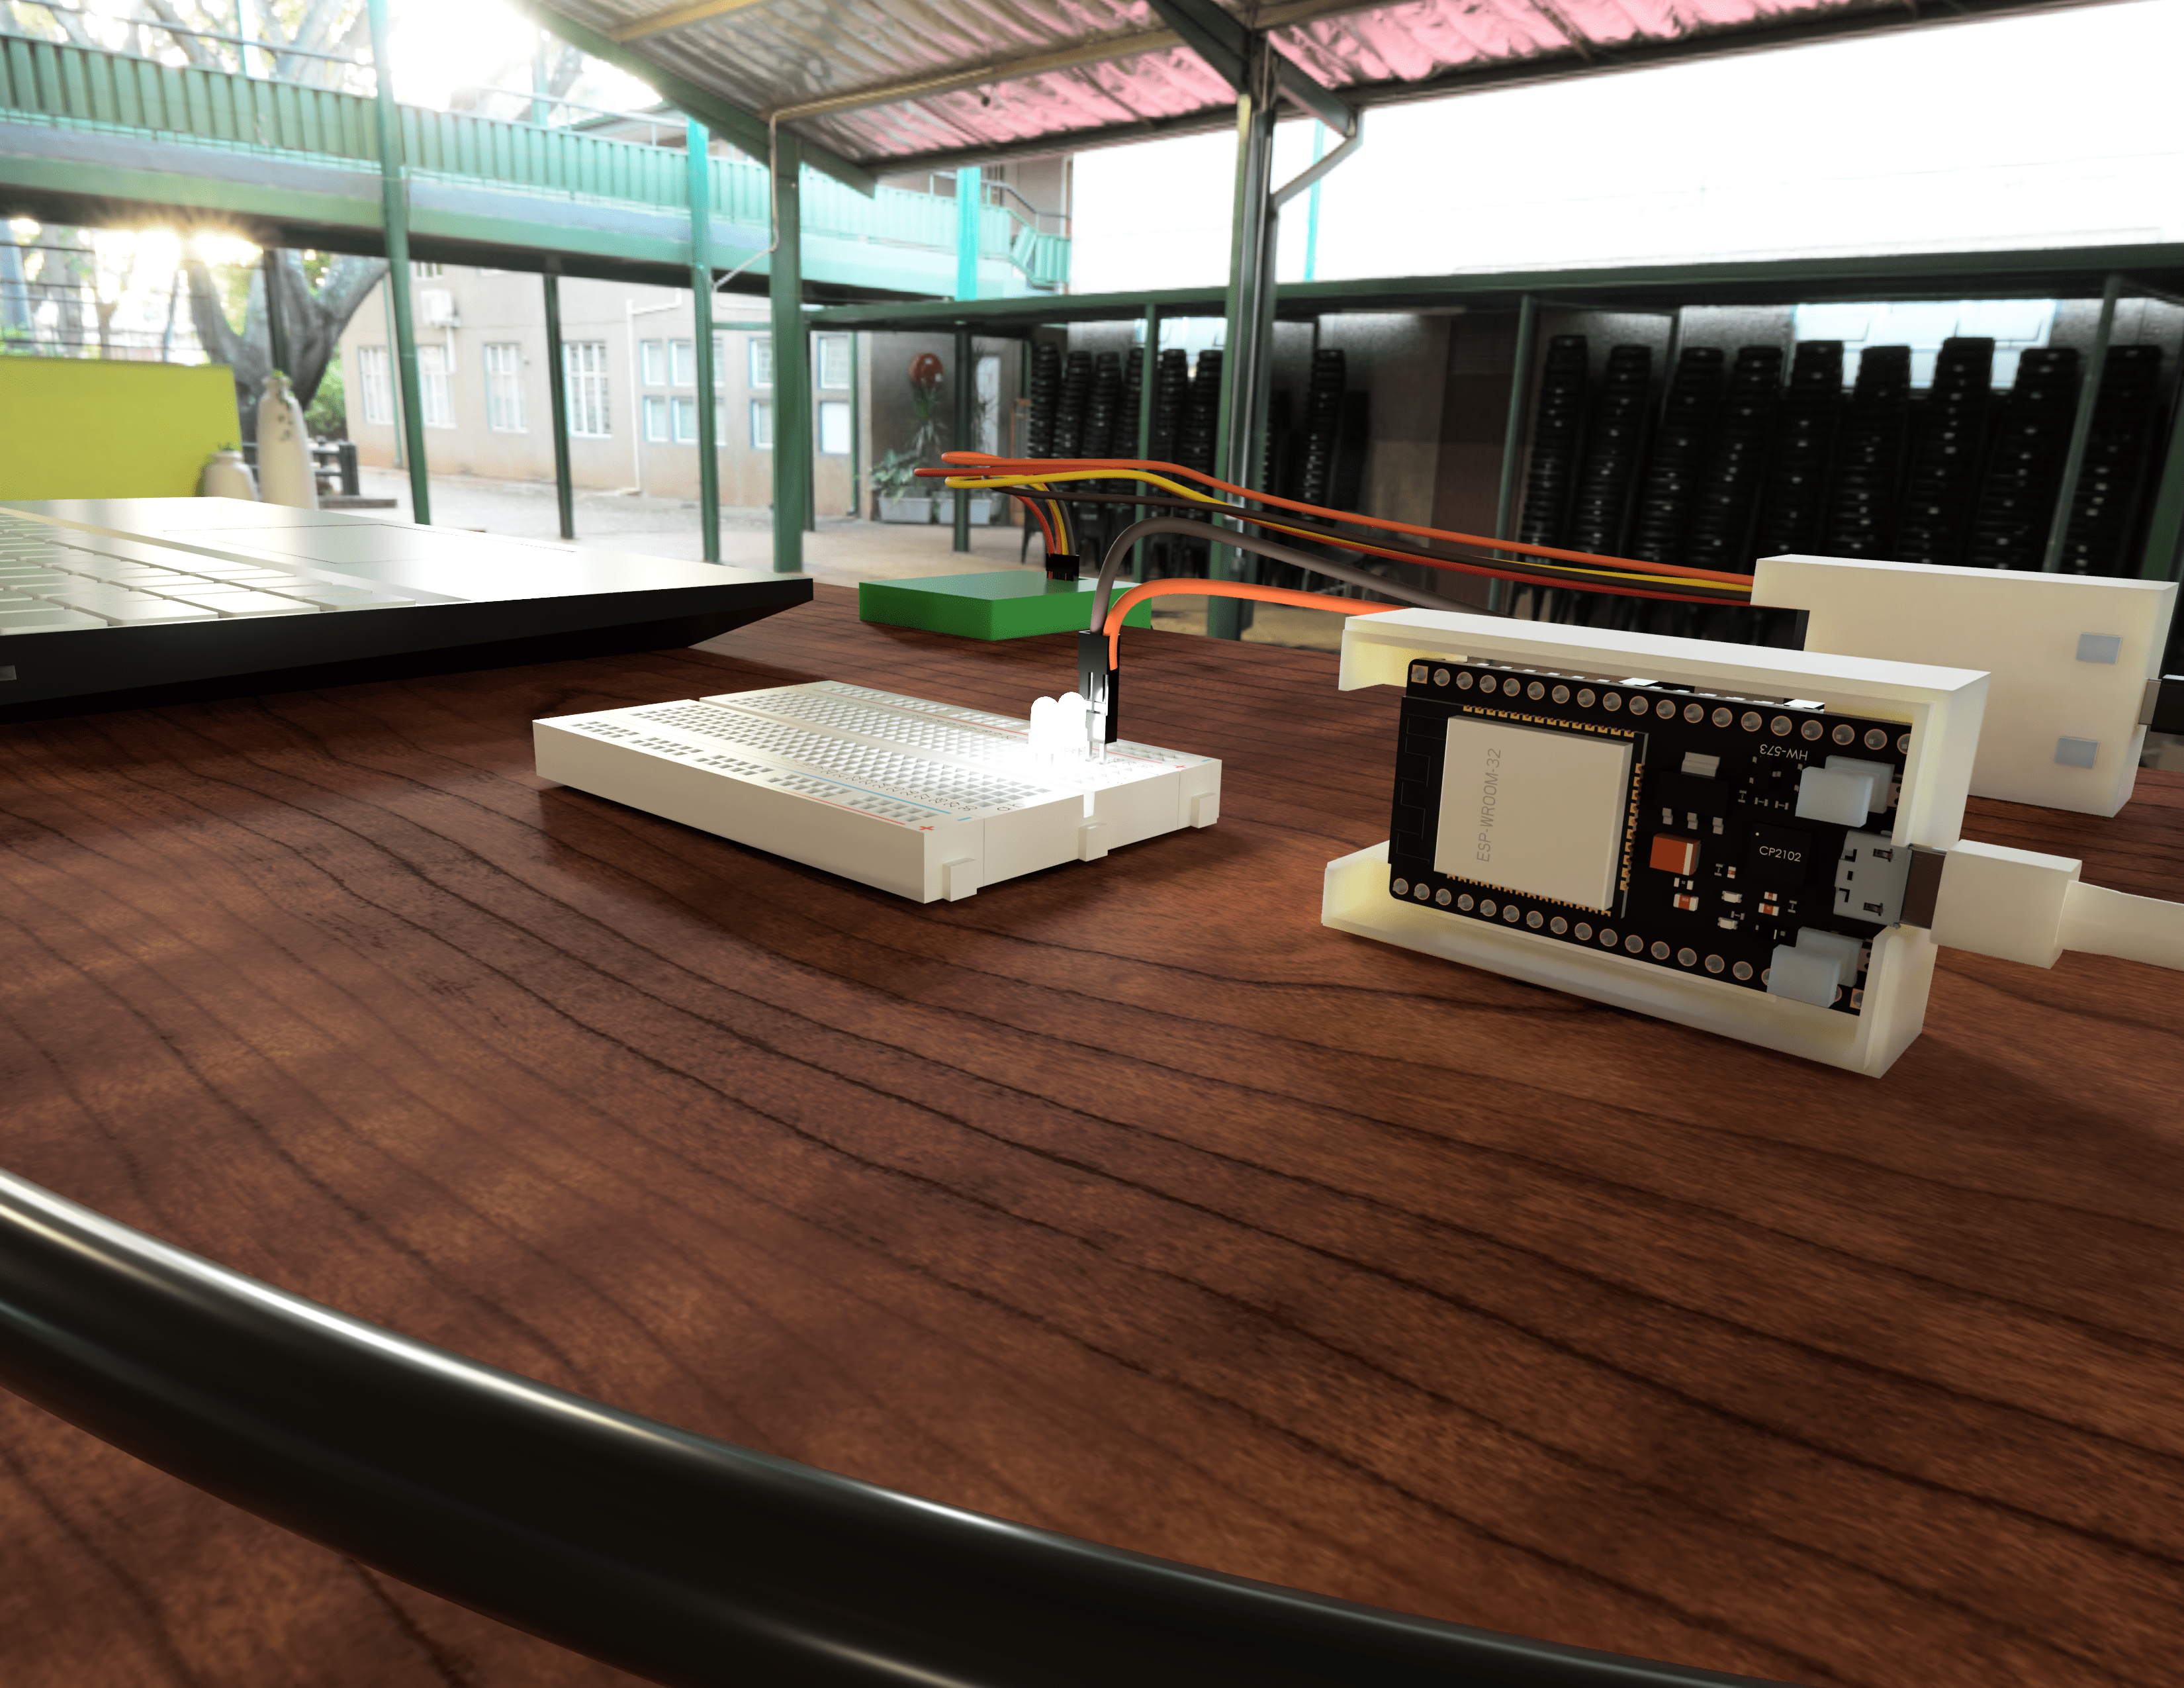
ESP32
-
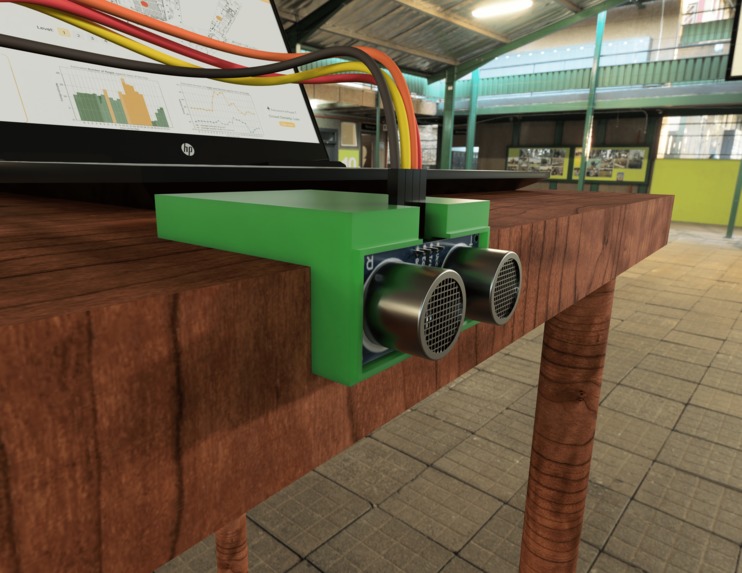
Ultrasonic sensor
-
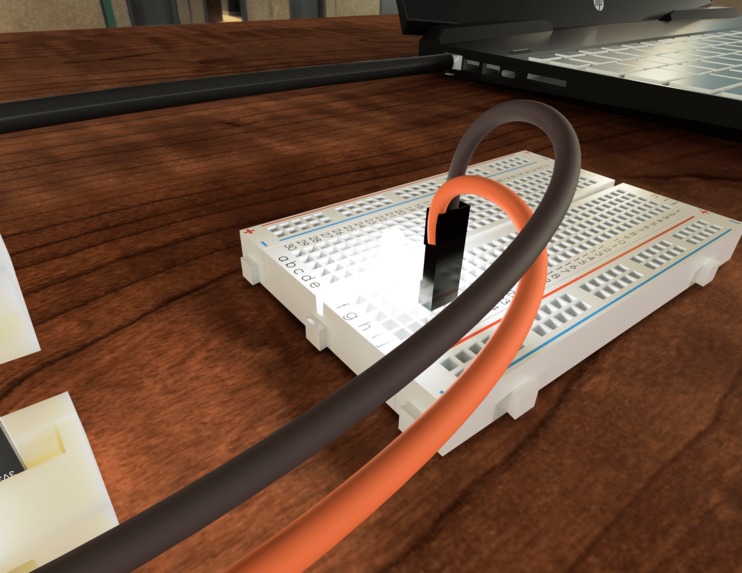
LED circuit to demostrate power output variance
-

The web interface


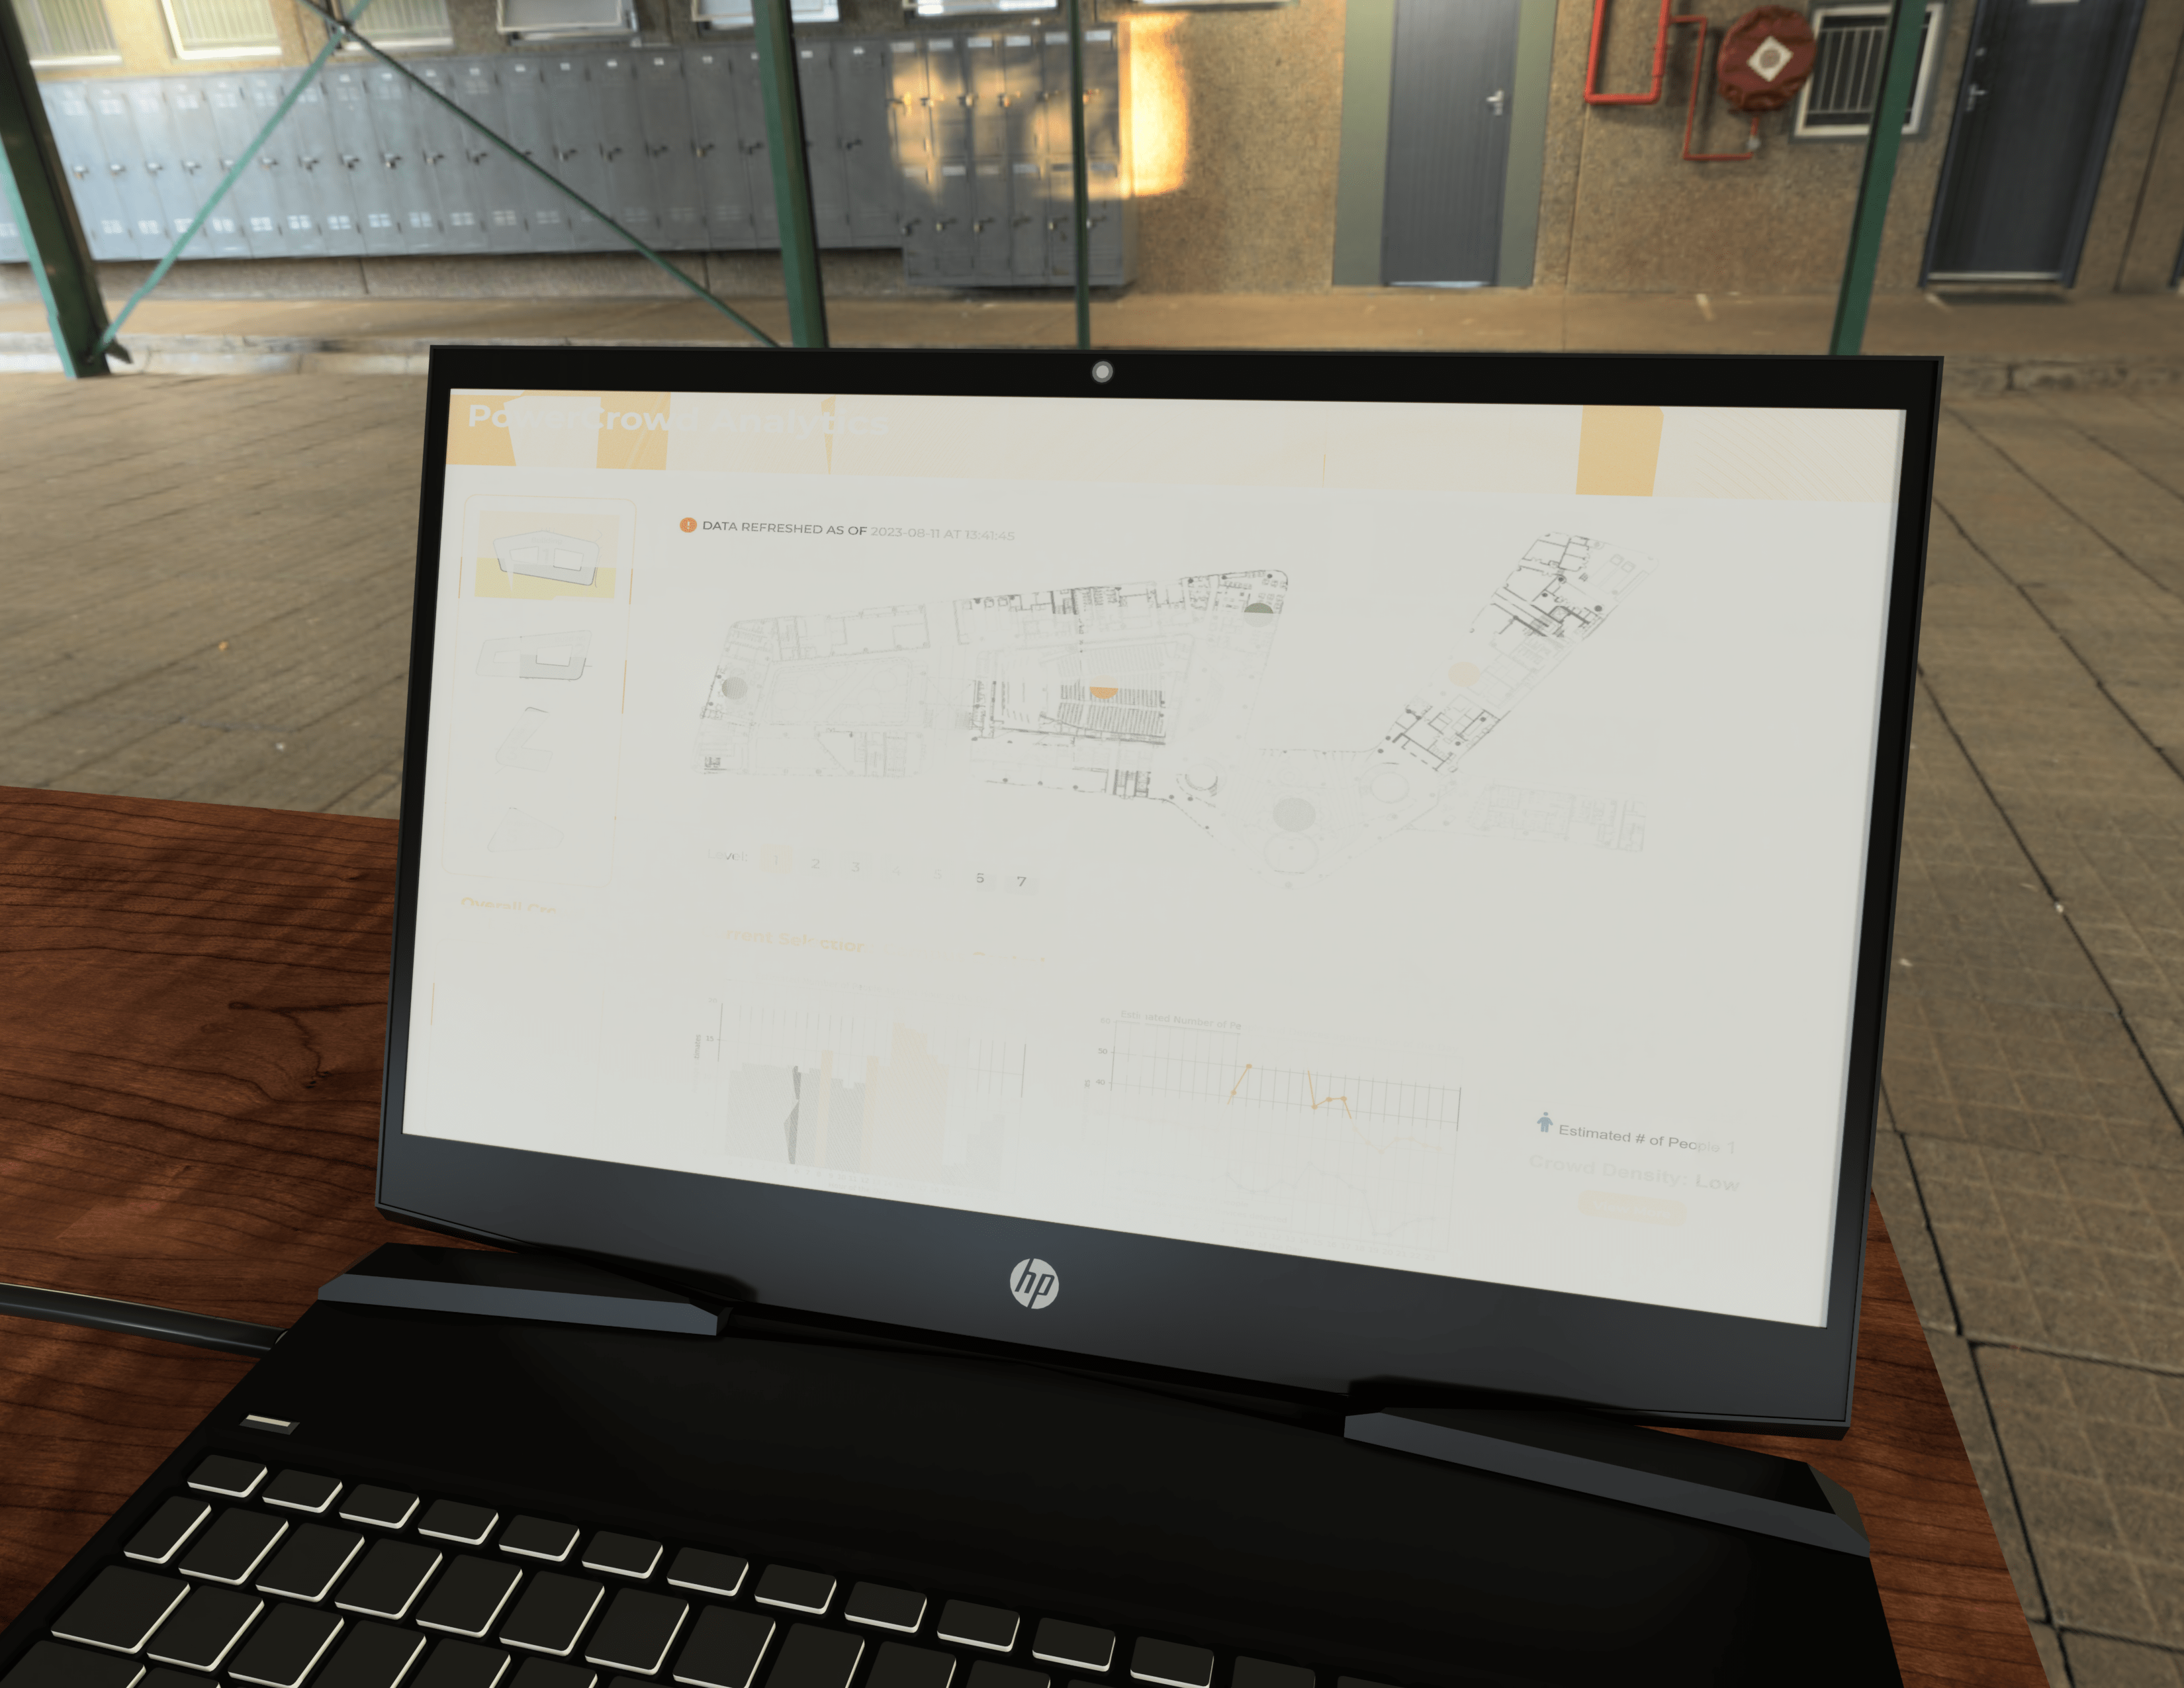
Note: Please look at our report on Google Docs for pictures and a more detailed description of our project! Thank you! ('u')/ link
Inspiration
In the publication Sustainable Architecture, the National Library Board (NLB) discussed how they were able to successfully saving power through varying the amount of power used for lighting in various locations in the NLB Building after hours, which helps them achieve their sustainability goal of using 151.36 kWh/sq m/y in 2012, which was even lower than their expected goal of 178 kWh/sq m/yr (BCA-SIA, 2009).
According to another research Energy Consumption of Escalators, the main factor that affects energy consumption of escalators is the frequency of traffic flow, and it suggested that having a way to monitor the crowd flow for escalator usage would be helpful for reducing the energy consumption of escalators (Uimonen, 2015).
Therefore, based off these examples, our team felt that it we can expand on the concept of changing power usage of facilities such as lights, air conditioning, fans, etc in a building based on the crowd density in an area, so that we can reduce the power used when there is a lower number of people in an area, and also target power reduction specifically in less-crowded areas instead of across the whole building.
Hence, our problem statment is: How might we design a device that can reduce the power consumption in specific areas within a building, by detecting the number of people in the area and determining how many power devices to switch on?
What it does
Our proposed solution is a device which detects the number of devices which have WiFi enabled in each specific area of the building at every point in time, and from there, predict the crowd level at the area at each timing, as well as show how the crowd level varies over different timings. The building managers can then adjust the amount of power supplied to devices which consume power in the area, such as reducing the number of operating air-condition units in an area that is now crowded, reducing the light levels to a minimum in an empty area, or placing escalators on standby mode when no one is detected near them.
The device consists of three parts in order to work: The WiFi device detection system, the mathematical approach for crowd estimation, and the website which displays all the information required by building managers to make an informed decision.
Firstly, the Raspberry Pi will works together with the ESP32 and ultrasonic sensor to detect the number of WiFi-enabled devices in the area, and the number of people entering or leaving the area of interest respectively. These data are consolidated in the Raspberry Pi, and from there, factors such as the person-to-device ratio will be calculated.
After that, a mathematical model is used to calculate the estimated number of people within the area. As the number of devices a person will carry to an area will vary based on the location and purpose of visit, the stabilised Kavg at each area will be different. Thus, having a detection device designated to each area in our current proposal allows for even more accurate predictions specific to each area. . As this device is meant to be permanently fixed at a location, it will also be able to collect enough data over time to reach a stabilised Kavg, which will allow for accurate predictions of crowd levels simply through examining the number of active WiFi devices in an area.
Once all the data is collected by the Raspberry Pi and the calculations are performed, they will be exported into a .csv file, which our website will reference and display them in an easy-to-understand manner for the facility managers.
The website will mainly display a floorplan of the building indicating the crowd density at each area, separated by the different levels the building has. Upon clicking on each area, more detailed information will be displayed.
The facility managers will then be able to quickly determine key decision-making factors, such as the crowd density in specific areas, how the crowd level varies throughout the different timings in the day, and the suggested facilities which they can shut down or reduce the amount of working units, such as lighting and air conditioning for each area.
This will allow them to effectively reduce unnecessary power consumption without adversely affecting the utility of each area, and thus, fulfill the sustainability goal of our project while providing the companies with additional information regarding crowd density, making it a solution that benefits both the environment and the organisation that installs the devices.
How we built it
We first bought an USB WiFi/Bluetooth dongle, which was critical for the Raspberry Pi to be able to detect WiFi devices within the area, so that we can estimate the crowd density. The code used for the detection process is written in a combination of Assembly, C, and C++.
The ESP32 utilises Arduino C++ to convert any detection in people entering or leaving the area by the Ultrasonic sensor into an Error function, which is used in the mathematical model to improve the accuracy of the Raspberry Pi's crowd density estimator.
The website from which the building managers will view the data collected by the Raspberry Pi is made using Javascript, with the help of node.js framework.
Challenges we ran into
One of the major challenges we ran into was having to figure out how USB WiFi chipset worked, in order for us to perform firmware patching. We also encountered setbacks when trying to figure out how to count the number of devices accurately from the full list of devices detected by the Raspberry Pi, as we wanted to avoid counting Access Points or double-counting the same client devices, both of which would decrease the accuracy of our project. Creating a working web interface and integrating Firebase was also difficult to implement, and we had to learn much of these skills along the process.
However, in the end, we are happy to announce that we were able to implement the physical prototype and the website successfully!
Accomplishments that we're proud of
In a short time-frame of 2 days, we were able to implement a physical prototype and a working web interface, as well as create a CAD and animation of our setup for the exhibition visitors to quickly understand our project! More importantly, we truly understood the importance of teamwork, with each member specialising in a task, and clear communication during the process helped us get to where we are now!
What we learned
Through the project, we learnt a lot more about how to utlilse devices such as Raspberry Pi and ESP32, as well as coding languages such as Javascript, C, C++, and Python! We also experimented with different methods to update our website from a .csv files, such as using Firebase.
What's next for Powercrowd Analytics?
We hope to continue developing this idea in the future, as part of our school projects or even part of our personal projects! We believe that it is an interesting idea, and we would love to have more time to test it out and further improve it!

Log in or sign up for Devpost to join the conversation.