POUR — AR Container Volume Estimation App
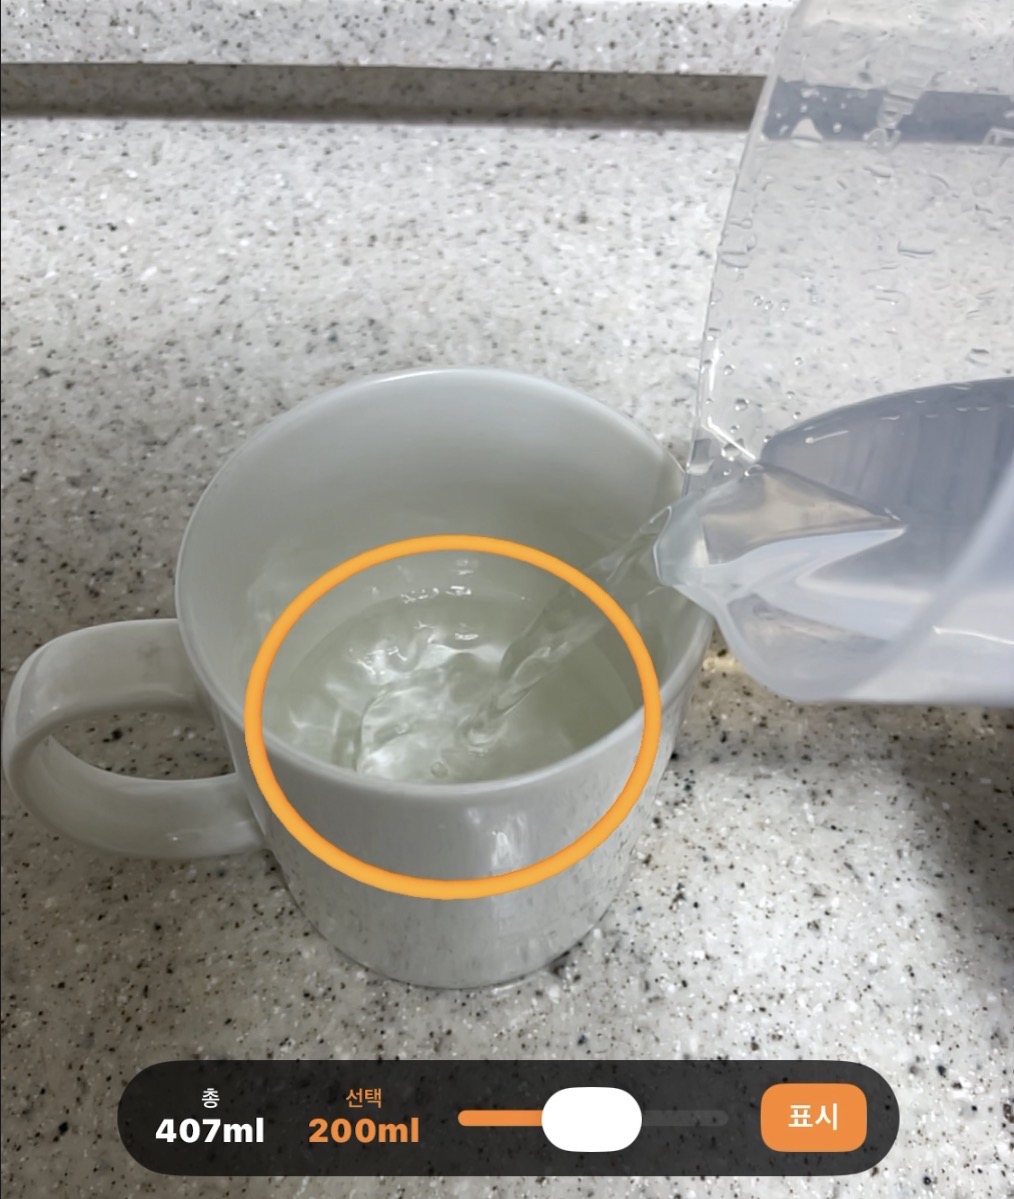
💧 POUR is an AR application that estimates a container’s volume using only a smartphone camera and shows the fill height for a user-specified amount of content.https://github.com/boostcampaitech8/pro-cv-finalproject-cv-06
Project at a Glance
| Category | Details |
|---|---|
| Program | Naver Boostcamp AI Tech, an AI bootcamp founded by NAVER |
| Period | January–February 2026, approximately one month |
| Team | Four members |
| My role | Team Founder and Project Director |
| Product | Smartphone-based AR container-volume measurement app |
| Core technologies | Depth Anything 3, 3D reconstruction, computer vision, ARKit, and ARCore |
| Final prototypes | Client–server iOS app and on-device Android app |
The Problem
People often need to know either the total capacity of an unmarked container or the correct fill height for a specific amount of content (especially when cooking). Doing so normally requires a measuring cup or another calibrated tool.
POUR explored a more convenient alternative: scan a cup or similar container with a smartphone, reconstruct its shape, estimate its volume, and visualize the requested water level in AR.
This required more than predicting a single capacity value. To display the fill height for any requested amount, the system needed to estimate cross-sectional area at different heights and integrate those areas into a volume profile.
Project Direction
As Project Director, I organized and led team meetings, defined the experimental direction, and coordinated parallel development across two application architectures. I also designed experimental reconstruction pipelines and proposed optimization strategies, including segmenting and masking containers in the input images to reduce unnecessary 3D-reconstruction work.
My Core Contributions
- Founded the team and directed a four-person project from concept to prototype.
- Facilitated technical discussions and aligned the team around measurable product goals.
- Designed experimental pipelines combining segmentation, multi-view depth estimation, and 3D reconstruction.
- Proposed using 2D segmentation masks to limit reconstruction to the container region and reduce processing cost.
- Evaluated the trade-offs between server-based and fully on-device inference.
- Investigated TSDF and mesh-based reconstruction as an experimental branch.
- Helped frame the product around both total volume and height-specific volume estimation.
Two Parallel Architectures
The team implemented two approaches in parallel to compare accuracy, latency, privacy, and device constraints.
| Client–Server iOS App | On-Device Android App | |
|---|---|---|
| AR framework | ARKit | ARCore |
| DA3 execution | GPU server (Tesla V100) | Smartphone |
| Data flow | The client uploads captured images; the server performs depth estimation and volume calculation | Images remain on the device; DA3 runs through a mobile inference stack |
| 3D representation | Multi-view point cloud | Multi-view point cloud |
| Volume method | Circle detection across horizontal slices, followed by cross-sectional integration | Circle detection across horizontal slices, followed by cross-sectional integration |
| Primary advantage | Higher compute budget and stronger metric accuracy | Offline operation and improved privacy |
| Primary limitation | Network and server dependency | Mobile memory, model size, and metric-scale accuracy |
Shared Measurement Pipeline
- Capture multiple views — The user records the container from several angles while the AR framework tracks camera pose.
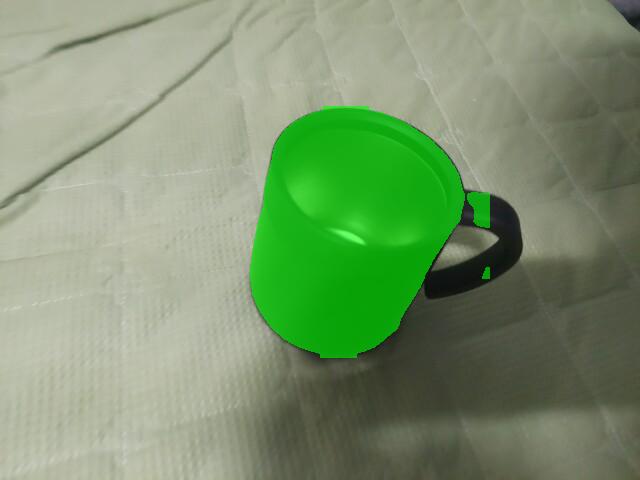
- Segment the container — A segmentation model isolates the relevant object and suppresses background geometry.
- Estimate depth — Depth Anything 3 generates depth information from the selected views.
- Reconstruct a point cloud — Depth, camera intrinsics, and camera poses are combined into a shared 3D coordinate system.
- Find circular slices — The system detects circular cross-sections at multiple container heights.
- Integrate volume — Cross-sectional areas are integrated along the height axis to estimate capacity and build a volume–height relationship.
- Visualize the result — The application presents the estimated volume and the corresponding AR fill level.
Client–Server iOS App
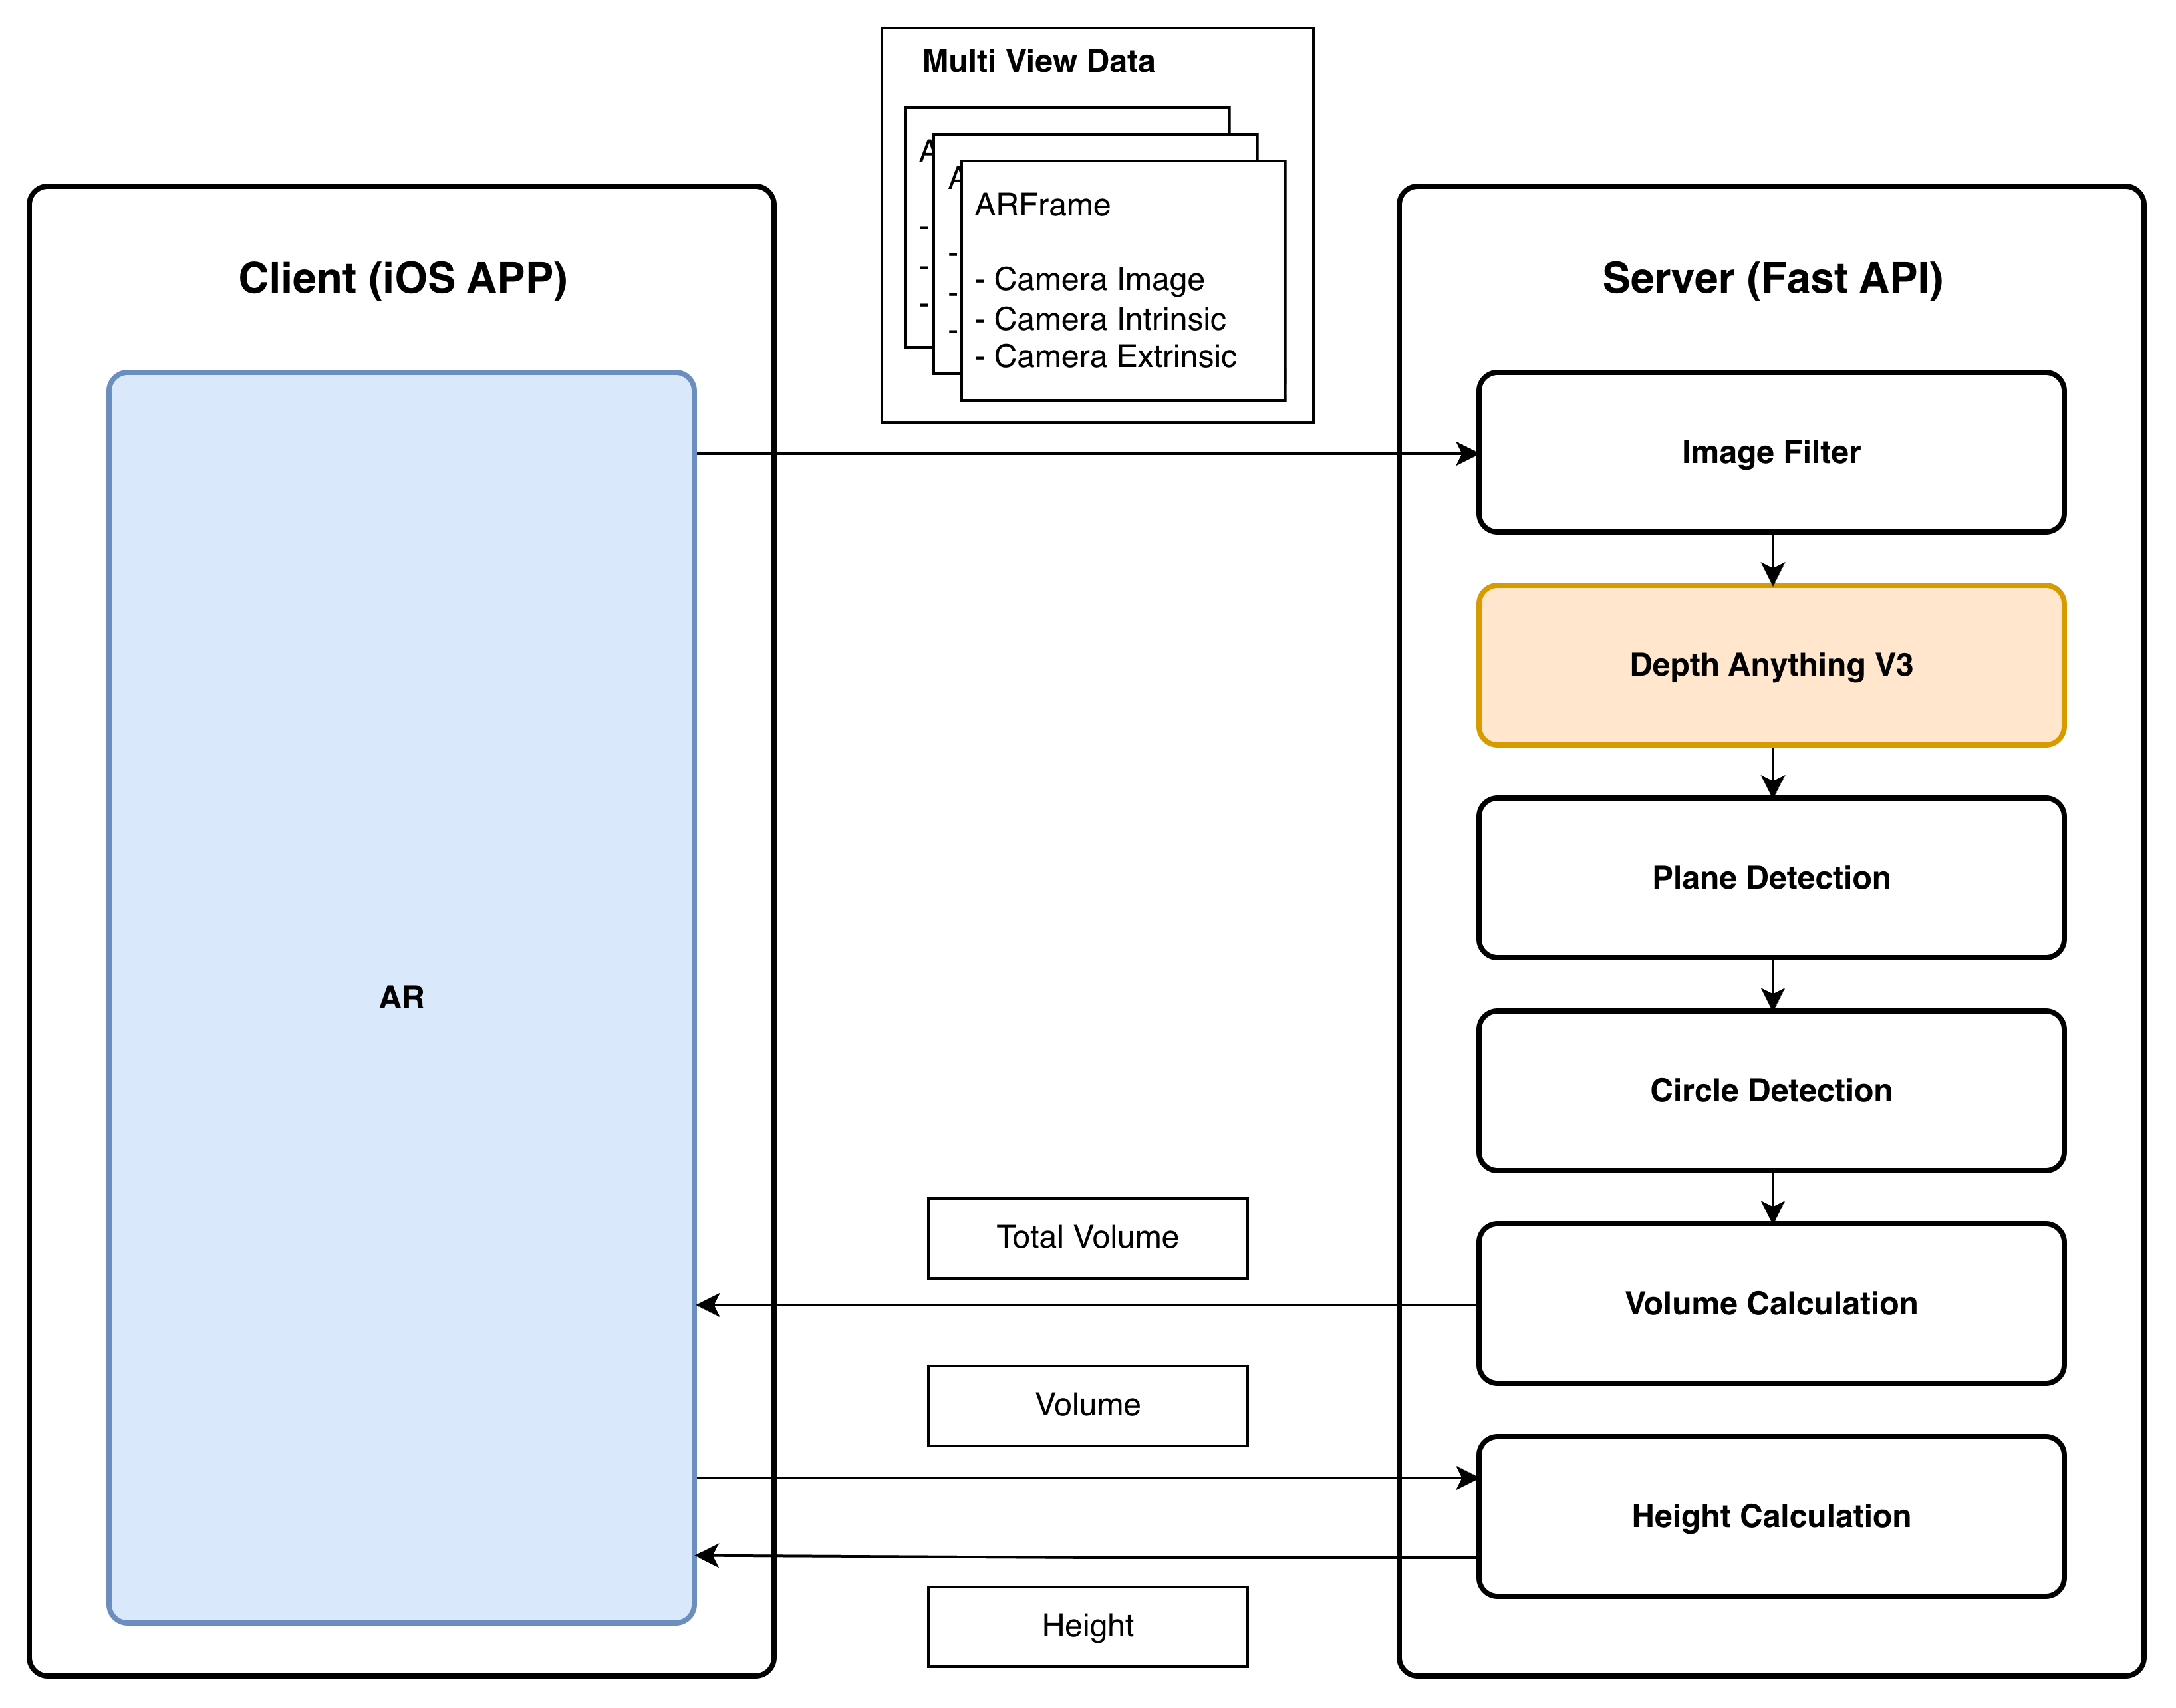
The iOS prototype used ARKit for camera tracking and sent captured images and camera metadata to a server. The server ran DA3 with a larger compute budget, reconstructed the container as a point cloud, and calculated volume from circular slices.
Architecture
- Client: ARKit-based multi-view capture, camera-pose collection, and result visualization.
- Server(Tesla V100): DA3 inference, point-cloud reconstruction, geometric slice analysis, and volume calculation.
- Response: Estimated capacity and information required to display the requested fill height.

Result
ScreenRecording_02-07-2026_19-54-51_1.mov
ScreenRecording_02-07-2026_19-53-24_1.mov
The client–server iOS app measured container volume with more than 90% accuracy in the team’s evaluation. Running DA3 on a server reduced mobile compute constraints and produced the strongest metric result of the two prototypes.
On-Device Android App
The Android prototype used ARCore for camera tracking and ran DA3 directly on the smartphone. Its purpose was to test whether the complete workflow could operate without uploading user images to an external server.
Architecture
- Capture and pose tracking: ARCore collected multiple images with camera extrinsics and intrinsics.
- Mobile inference: An FP16 ONNX version of DA3 ran through ONNX Runtime, with Qualcomm QNN acceleration where supported.
- Memory control: Images were processed in small overlapping batches to avoid out-of-memory failures.
- 3D reconstruction: Depth maps were unprojected and fused into a point cloud.
- Volume calculation: Circular slices were detected at different heights and integrated into a volume estimate.
Mobile Optimization
The on-device path introduced constraints that did not exist on the server: limited memory, large model files, unsupported mobile operations, and the need to recover metric scale reliably.
Key optimizations included:
- FP16 model conversion to reduce model size.
- Separate posed and unposed model exports for ONNX’s static graph.
- Sliding-window batch inference with overlap between adjacent batches.
- Explicit model-session resets to release inference memory.
- Progressive visualization of masks, depth maps, point clouds, and results.
Device Prototype
On-device prototype test 1
On-device prototype test 2
Result
The Android app successfully ran DA3 on the device and produced a 3D reconstruction. However, the reconstructed geometry did not provide sufficiently accurate metric scale, so the final volume estimate remained unreliable.
Segmentation Optimization
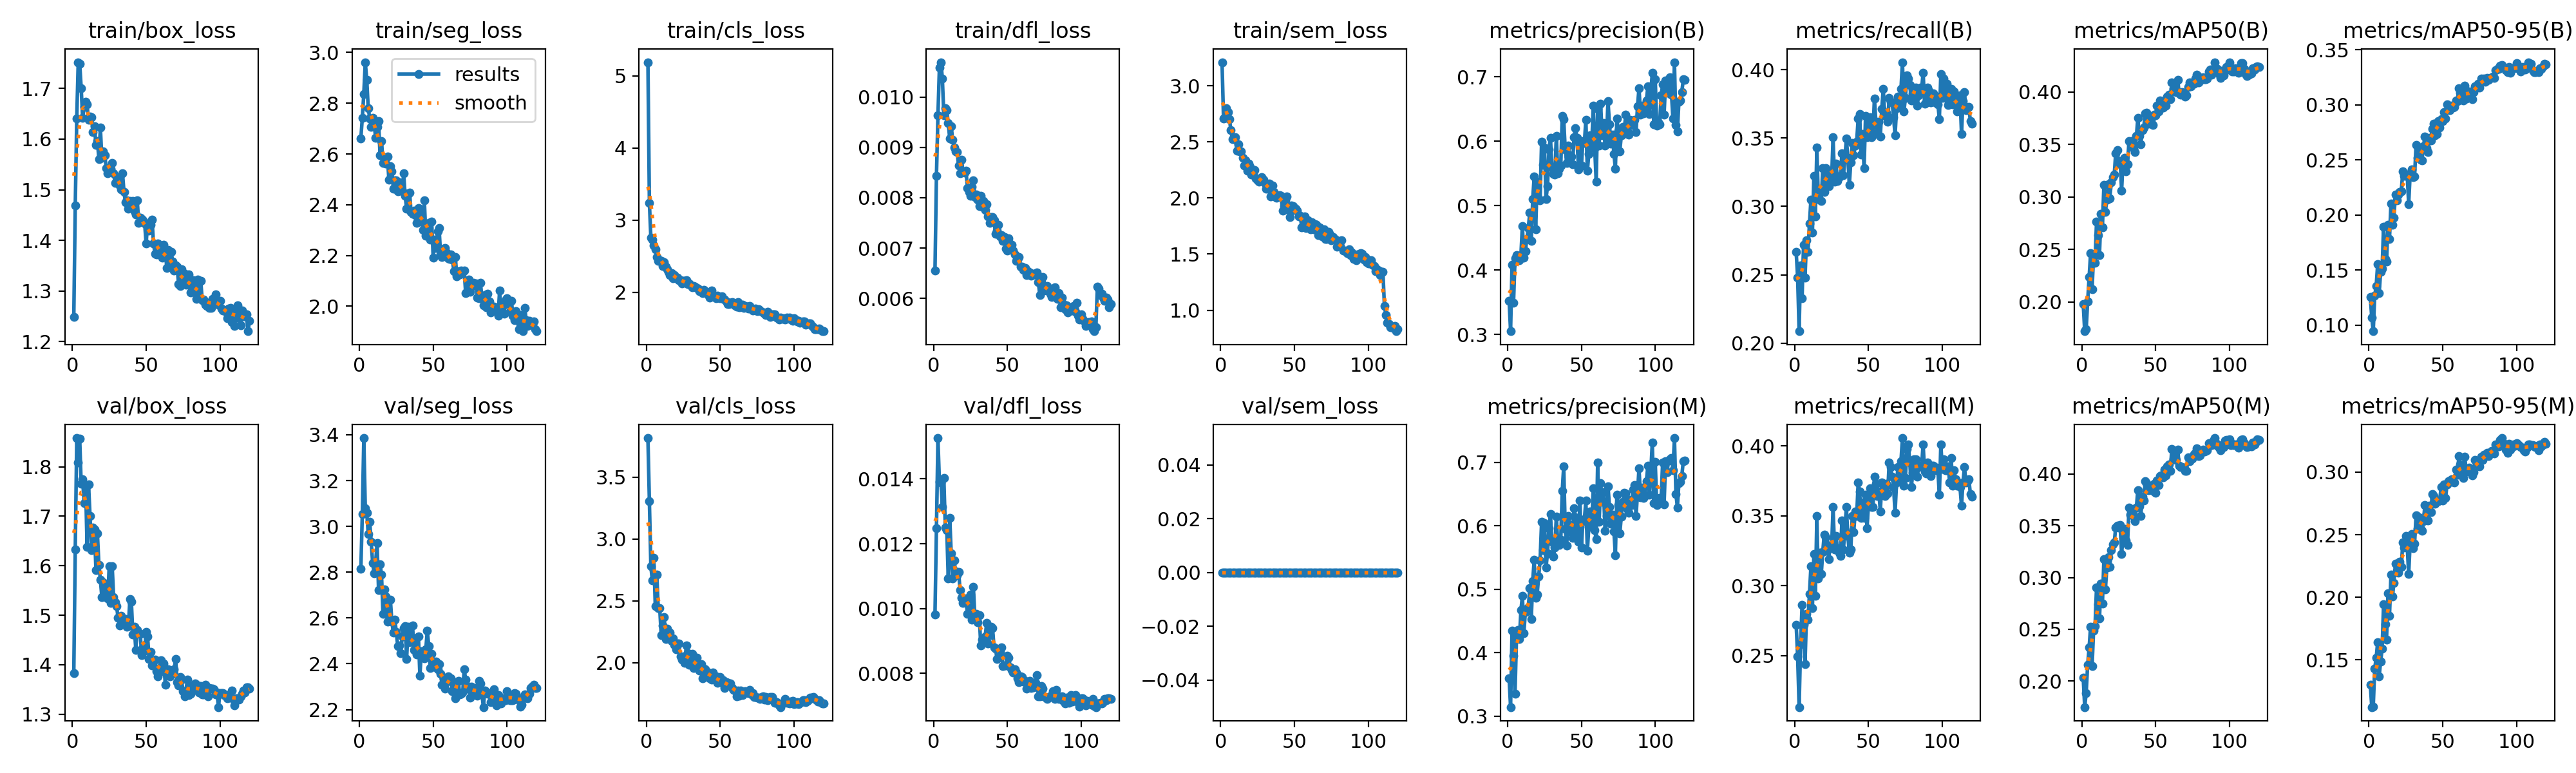
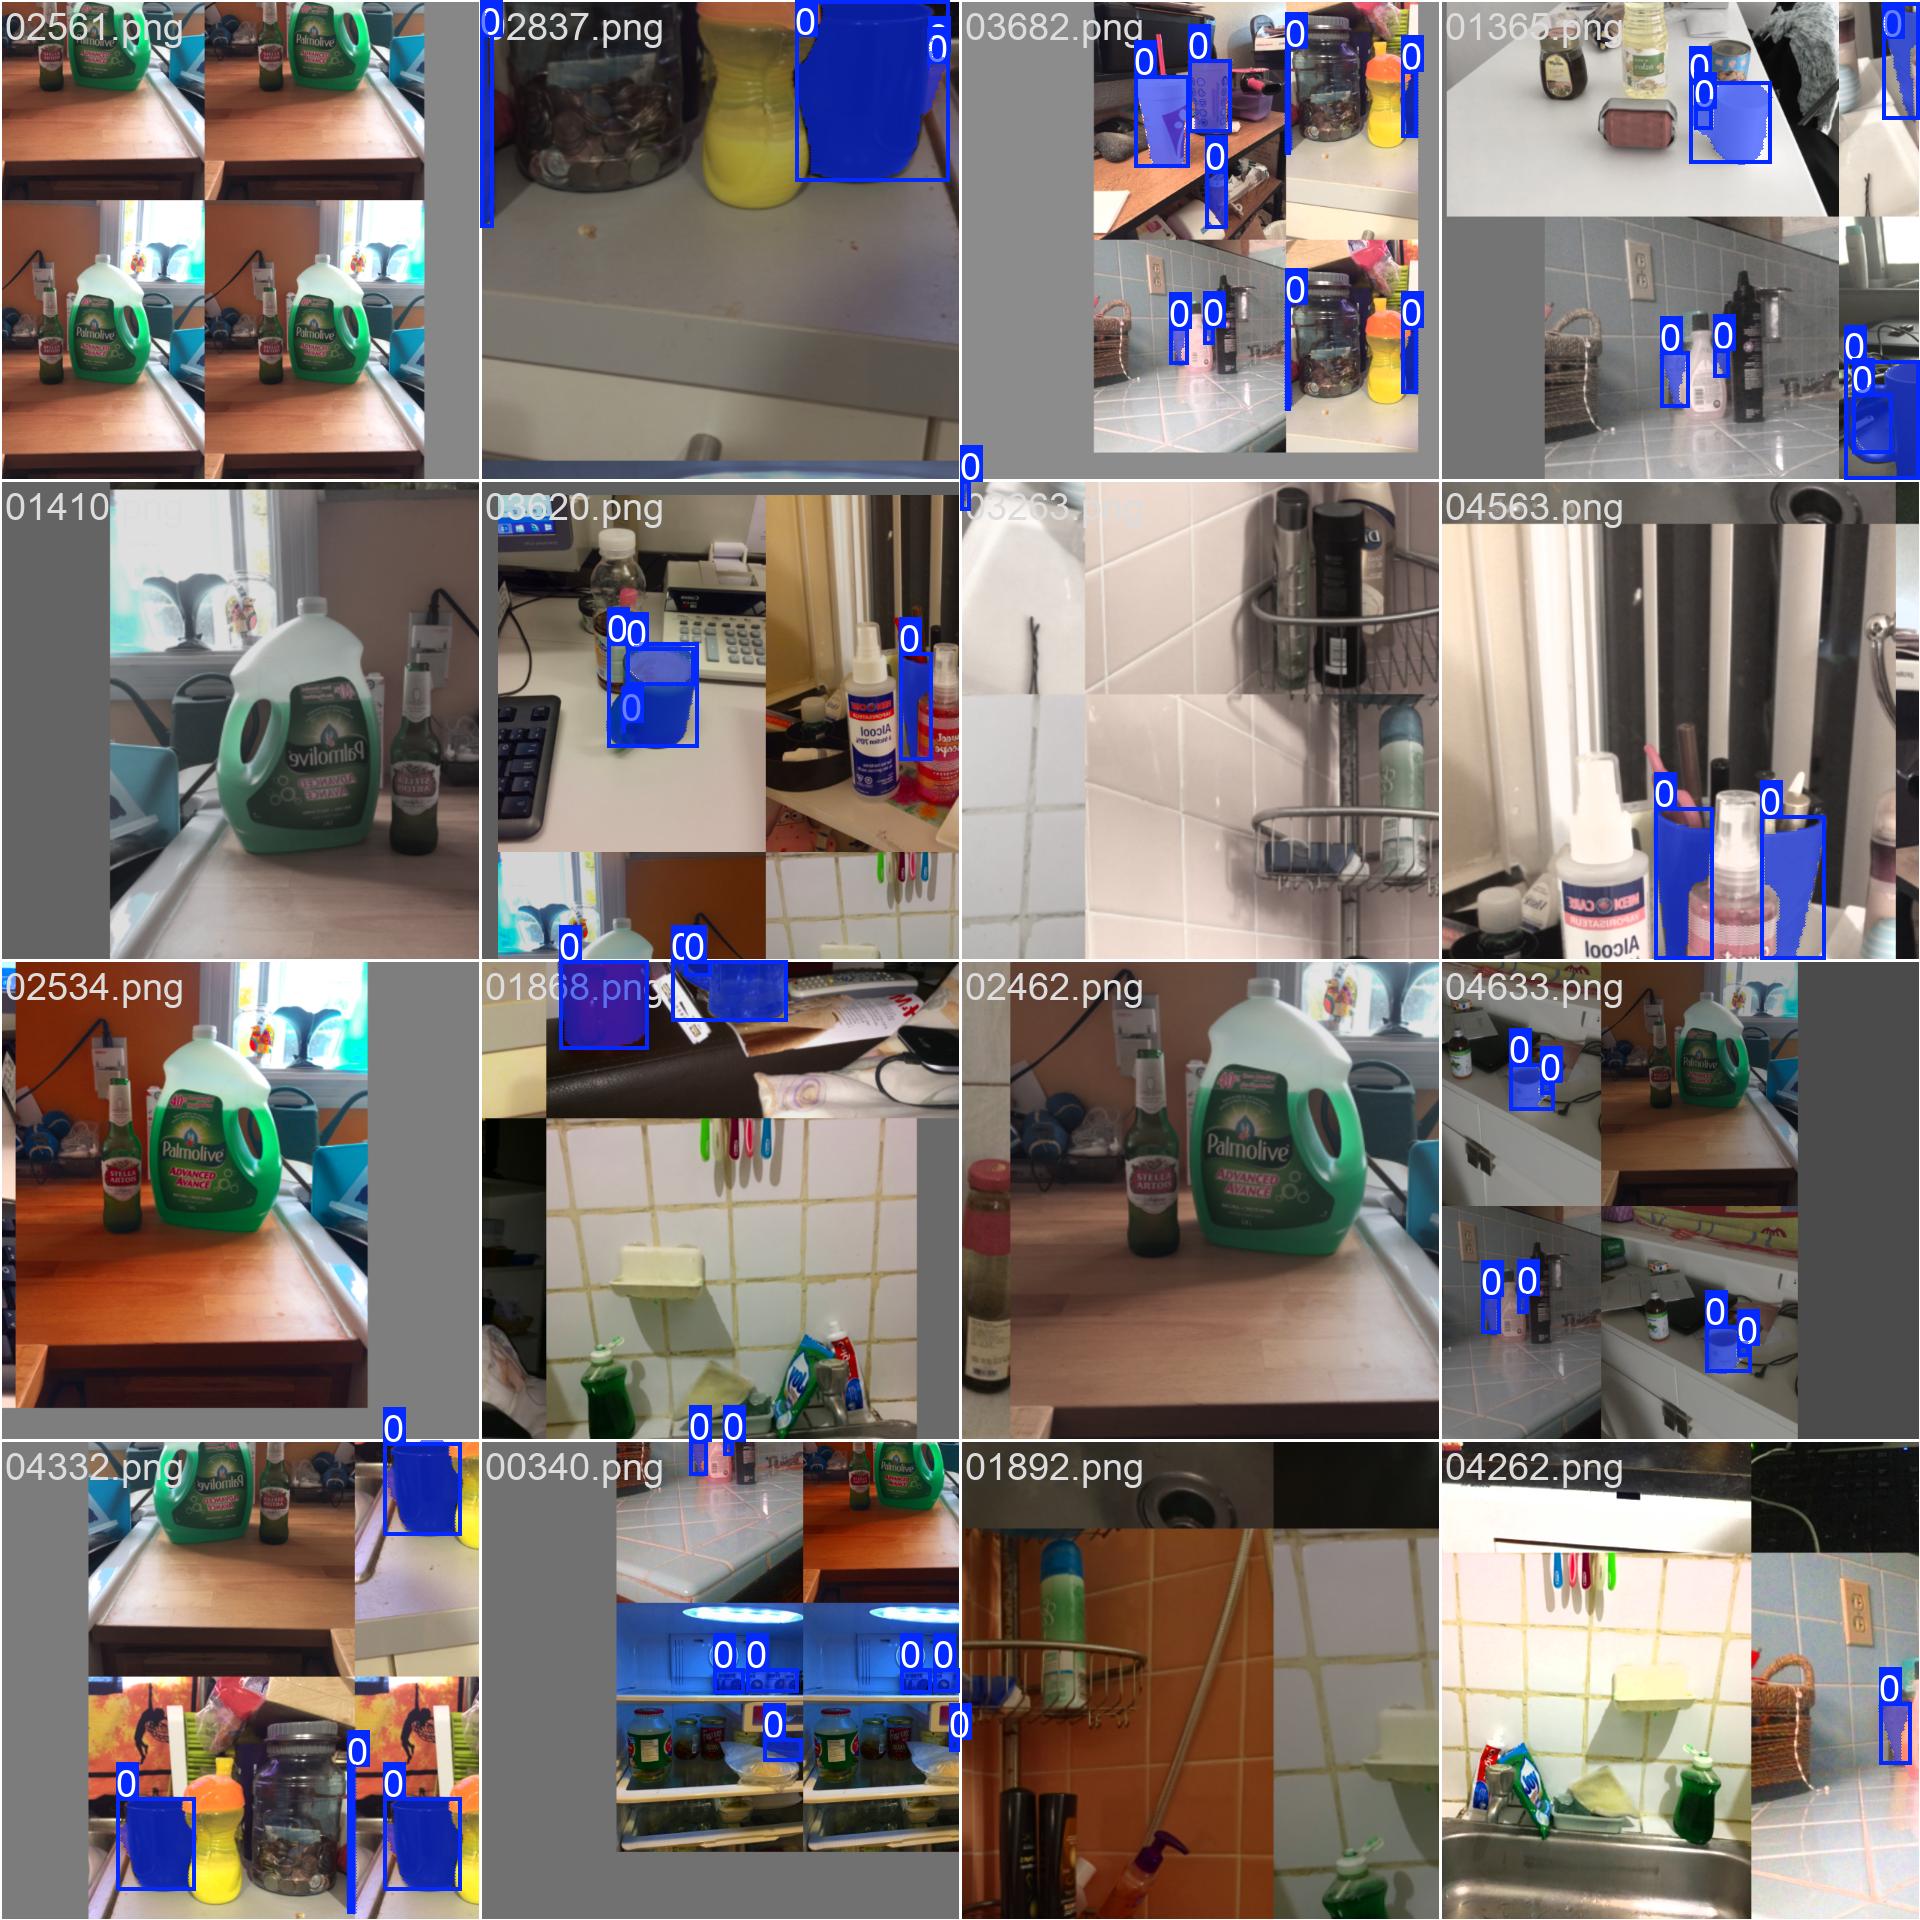
Accurate container masks help remove the table, background, and unrelated geometry before reconstruction. Large segmentation models produced strong masks but were too slow for the intended workflow, so the team used a large model to generate labels and fine-tuned a lightweight segmentation model for faster inference.
Approximately 5,000 kitchen-container images were labeled for this process.
- Training epochs: 120
- Image size: 640
- Batch size: 16


Experimental TSDF and Mesh Branch
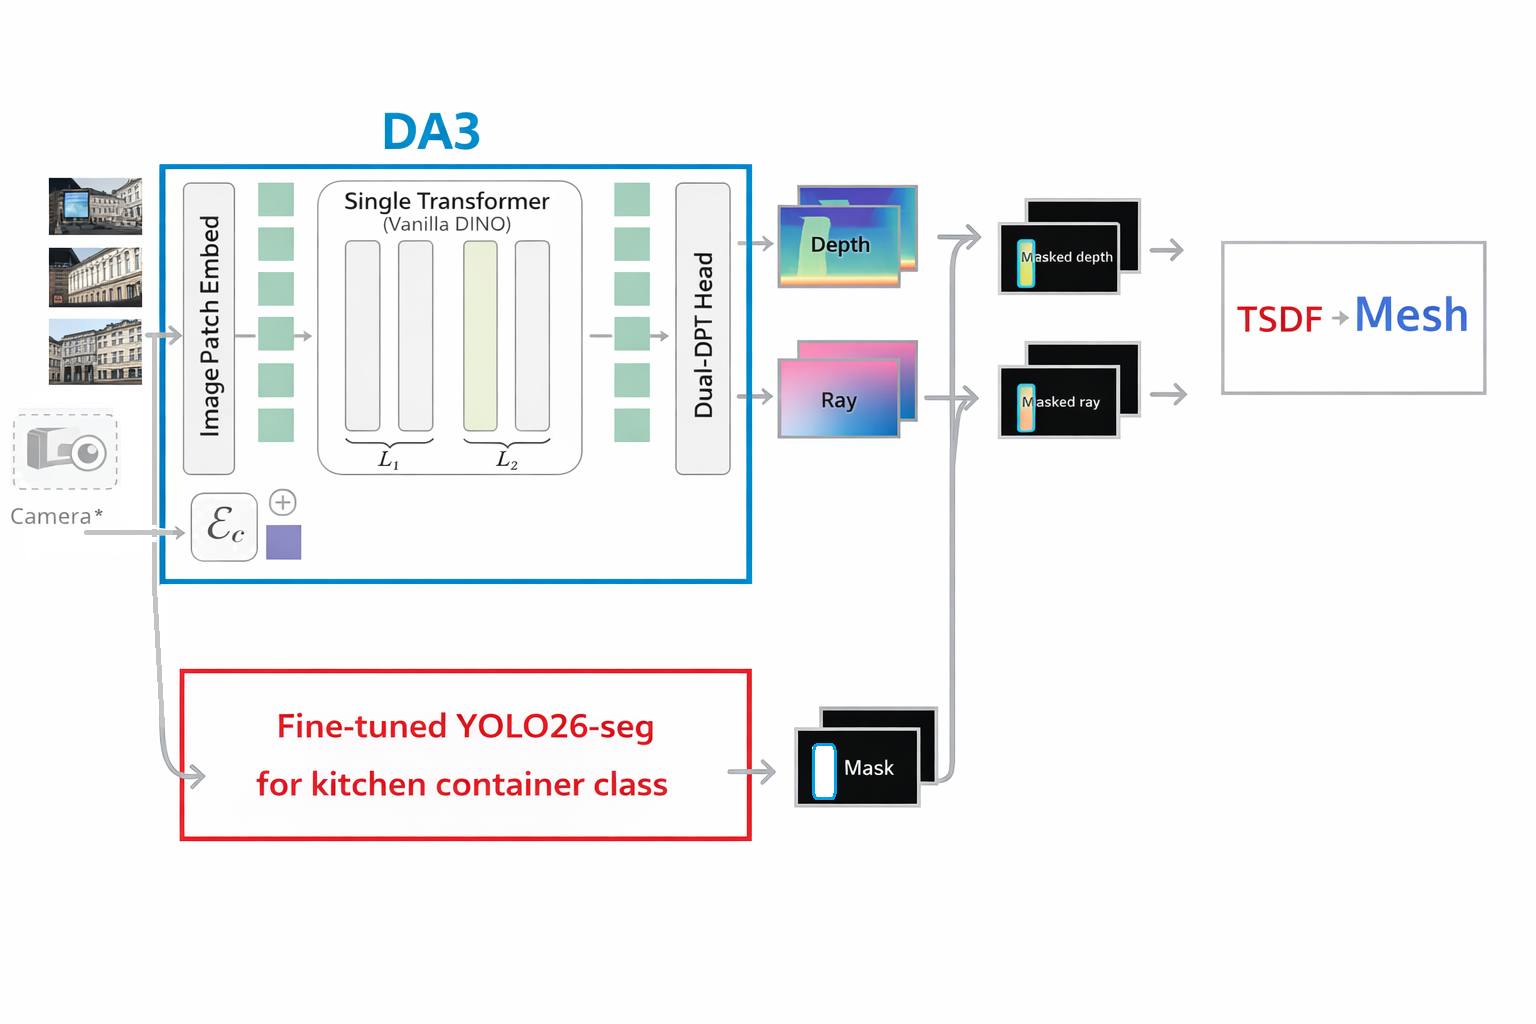
I also designed and tested an alternative pipeline that selected camera-pose-diverse frames, applied segmentation masks, fused masked depth into a TSDF, and extracted a mesh with Marching Cubes.

Free_Online_Tool_to_View_3D_PLY_Files_Online_-ImageToStl-_Chrome_2026-01-28_10-46-41.mp4
This approach could represent shapes that were not perfect surfaces of revolution, but it required sufficient observations of the entire container wall. It remained an experiment and was not integrated into the final iOS or Android applications.
The Hardest Geometric Challenge
Concave containers create self-occlusion: the outer wall blocks the camera’s view of recessed regions. As a result, depth estimates in concave areas are less reliable, and missing geometry propagates into the reconstructed point cloud and volume calculation.
This is a fundamental observation problem rather than only a model problem. Potential mitigations include scan-coverage guidance, more viewpoints, confidence-aware filtering, shape priors, or explicit uncertainty ranges.
Results
| Prototype | What Worked | Remaining Limitation |
|---|---|---|
| Client–server iOS app | Completed the full capture-to-volume pipeline and achieved more than 90% volume-measurement accuracy | Required image upload, network access, and server compute |
| On-device Android app | Ran DA3 locally and successfully reconstructed a 3D point cloud | Metric scale was inaccurate, making the final volume estimate unreliable |
What I Learned
- A project director must turn uncertain research questions into parallel, testable engineering paths.
- Product requirements should determine the geometric representation: arbitrary fill-height visualization requires more than a single capacity prediction.
- Segmentation is valuable not only for accuracy but also for reducing reconstruction cost.
- Server inference can provide stronger metric results, while on-device inference introduces meaningful privacy and offline-use benefits.
- Successful 3D reconstruction does not guarantee accurate metric measurement.
- Concavity, transparency, reflectivity, and incomplete viewpoint coverage remain major challenges for camera-based volume estimation.
Next Steps
- Reducing computation time
- Improve metric-scale recovery for the on-device pipeline.
- Add scan guidance that detects insufficient coverage and concave blind spots.
- Evaluate accuracy on a controlled set of containers with known ground-truth volumes.
- Quantify uncertainty and display confidence intervals with each result.
- Explore model distillation and mobile-friendly depth architectures.
- Compare point-cloud slice integration with learned or prior-based shape completion.
Resources
Built With
- arcore
- arkit
- python

Log in or sign up for Devpost to join the conversation.