- 💡 Inspiration
The idea for Pothole Radar didn't come from a single dramatic moment — it came from a pattern we couldn't unsee. 📰😔 As a student, I kept coming across news articles and reports about people getting seriously injured, or even losing their lives, because of poorly maintained roads and undetected potholes. 🛣️⚠️ What struck me most wasn't just the tragedy of each individual story — it was realizing how preventable so many of these incidents were, if only someone had reported the hazard in time and the right people had actually seen it.
That question stuck with me: if potholes are dangerous enough to make headlines again and again, why does reporting one still feel like shouting into a void? 🕳️📢 So I decided to actually test it myself — and quickly discovered the same broken system these articles kept hinting at. Municipal reporting forms were outdated, didn't accept photo uploads 📷🚫, offered zero map feedback 🗺️❌, and gave no visibility into whether a report would ever be reviewed, let alone acted on.
That gap between "this is genuinely dangerous" and "there's no real way to flag it before someone gets hurt" became the driving force behind this project. I realized this wasn't just a local annoyance — it was a systemic failure playing out across cities everywhere: 🌍
🙈 Citizens are blind — no tracking, no transparency, no feedback loop, even when lives are at stake. 🏚️ Cities are under-equipped — buried in scattered, unstructured complaints with no way to tell which hazards are truly life-threatening.
So I set out to build something that could close that gap: a transparent, community-first command center for road safety — one that helps everyday citizens report hazards before they turn into headlines, and gives city workers the smart tools to act fast on the ones that matter most. 🛠️✨
- 🏗️ How We Built It
We engineered Pothole Radar from the ground up to be fast, responsive, and deeply data-driven. Every design decision was made with one goal in mind: remove friction for citizens and add intelligence for cities. 🚀
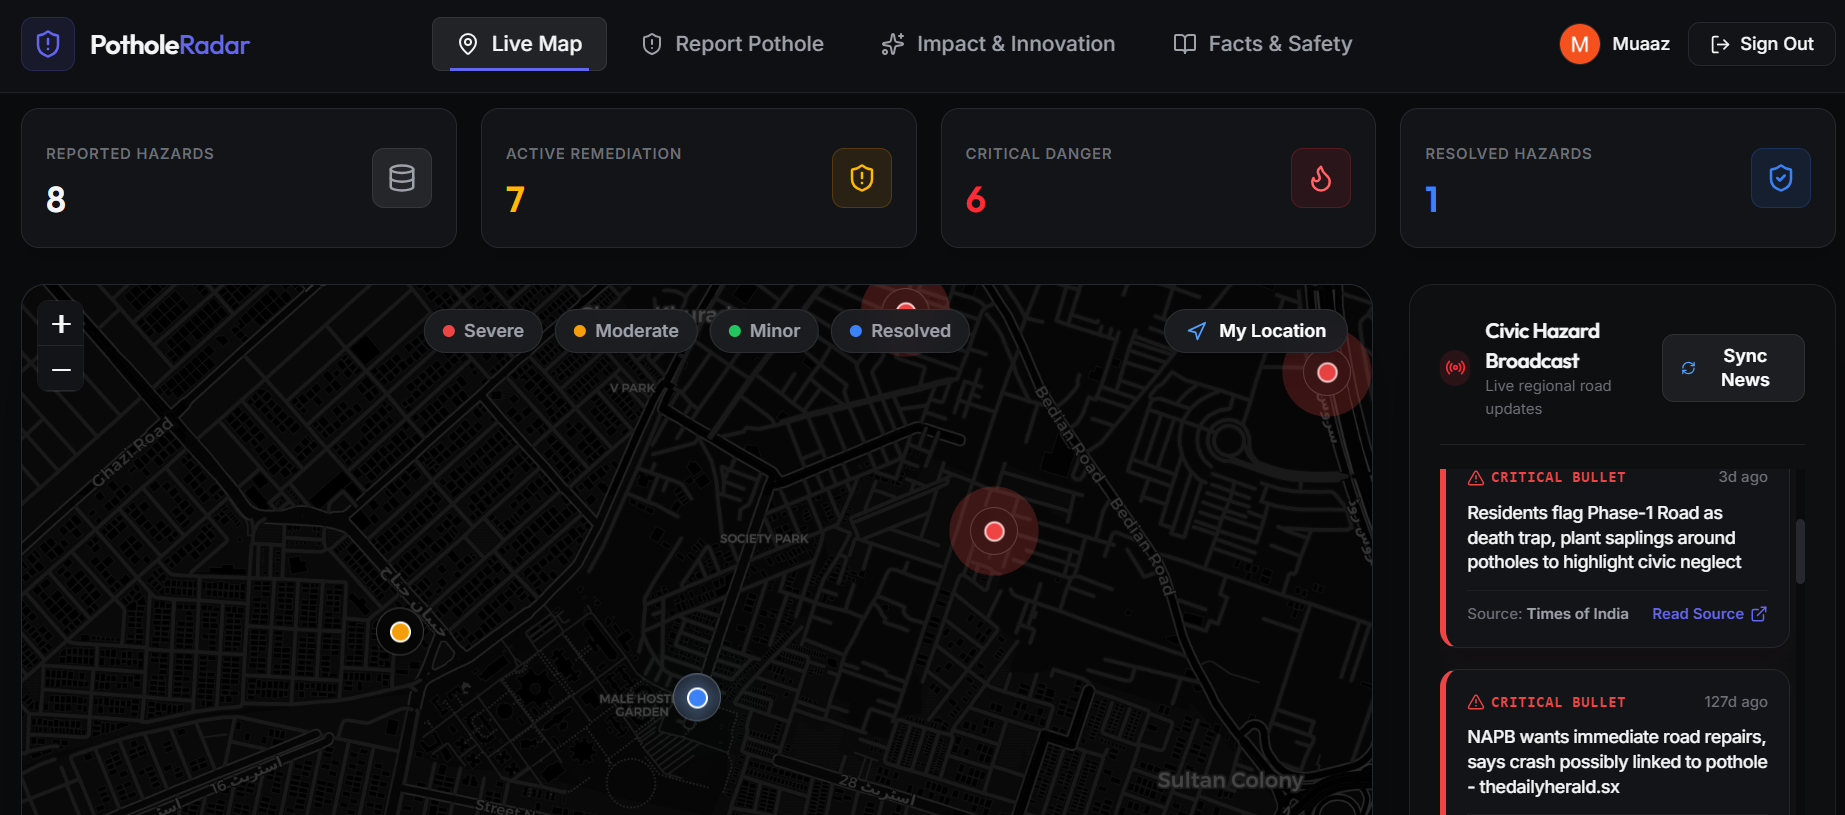
🖥️ The Telemetry Interface Built on React 19 ⚛️ and Vite ⚡ for a snappy, modern front-end experience, with Leaflet 🗺️ powering our interactive mapping system. Pothole coordinates render dynamically on the map in real time, so users can instantly see hazards in their neighborhood, zoom into their street, and understand exactly what's been reported nearby — no more guessing, no more black-box forms.
☁️ The Backend & Storage We chose Firebase Firestore 🔥 to handle real-time data synchronization — meaning the moment someone reports a pothole, it appears live on every other user's map, instantly. 📡 Firebase Auth 🔐 secures our admin dashboard, giving municipal teams a safe, permissioned space to manage, verify, and resolve reports without exposing sensitive controls to the public.
Together, this stack turns a slow, bureaucratic process into something that feels alive — a living map of a city's road health, updating in real time. 🌆💚
- 📚 What We Learned
🤖 AI Changes Everything for Civic Tech One of our biggest "aha!" moments was realizing just how much AI-assisted verification could transform civic infrastructure reporting. By integrating the Google Gemini Vision API 👁️✨, we built a system where users simply snap a photo of a pothole — and the AI automatically analyzes the image to estimate hazard severity, with impressively high reliability. 📸➡️📊
This was huge. It meant municipal workers no longer had to manually sift through hundreds of blurry photos trying to judge "is this bad enough to fix first?" The AI does the heavy lifting instantly, saving hundreds of hours of manual validation work and letting city crews focus on what matters most: actually fixing roads. 🛣️🔧
🎯 The Prioritization Engine We knew that if we just let every report pile up in a flat list, cities would get overwhelmed fast. 😵💫 So we built a smart Prioritization Engine — an algorithmic scoring system that automatically ranks every hazard on the map based on three key factors working together:
🔥 Severity — how dangerous is the damage? (Minor, Moderate, Severe) 👍 Community upvotes — how many people have confirmed this is a real, urgent problem? ⏳ Time elapsed — how long has this report been sitting unresolved?
The engine blends these signals so that severe, highly-upvoted hazards bubble straight to the top of the queue for immediate attention 🚨, while older, lower-priority tickets naturally fade down the list over time instead of clogging up the system forever. It's essentially a self-organizing to-do list for city maintenance crews — no manual triage, no spreadsheets, no guesswork. Just smart, automatic prioritization that keeps the most dangerous problems visible. ✅
- 🧗 Challenges We Faced
🧩 Duplicate Telemetry Prevention Once real users started testing the app, we quickly ran into a messy problem: when multiple people report the same pothole from slightly different locations, the map gets cluttered with duplicate pins. 📍📍📍 This wasn't just visually confusing — it also skewed our prioritization data.
Our fix? We built a geospatial proximity detection system that calculates the real-world distance between any two reported locations. If a new report lands suspiciously close to an existing one — close enough to obviously be the same pothole — the system automatically flags a potential conflict. Instead of creating a cluttered duplicate, the user is prompted to upvote the existing report instead. 🙌 This single feature dramatically cleaned up our map and made our data far more trustworthy for cities to act on.
📱 Mobile Geolocation Fallbacks Mobile browsers are notoriously unreliable when it comes to GPS permissions. 😤 Many devices silently restrict location access or fail without any clear error message — which could've completely broken our core reporting flow before users even got started.
To guarantee a frictionless experience no matter what, we built:
🌐 Custom IP-based geolocation fallbacks for when GPS access fails or is denied 🖱️ Drag-and-drop map markers so users can manually fine-tune or correct their pin placement in seconds
The result: reporting a pothole always works, on any device, in any condition — no dead ends, no frustration. 💪
Built With
- ai
- auth
- firebase
- firestore
- gemini
- leaflet.js
- react
- scrapping
- tailwind
- typescript
- vite
- web


Log in or sign up for Devpost to join the conversation.