PostalRx: Environmental Chronic Disease Risk Intelligence
"Your city. Your risks. Your health."
Inspiration
It started with a simple question I couldn't answer:
Why do people in some cities get sicker than others — and why does nobody talk about it?
I live in Punjab, Pakistan. I knew the air wasn't clean. But I had no idea how bad it really was until I started researching for this project. What I found was shocking:
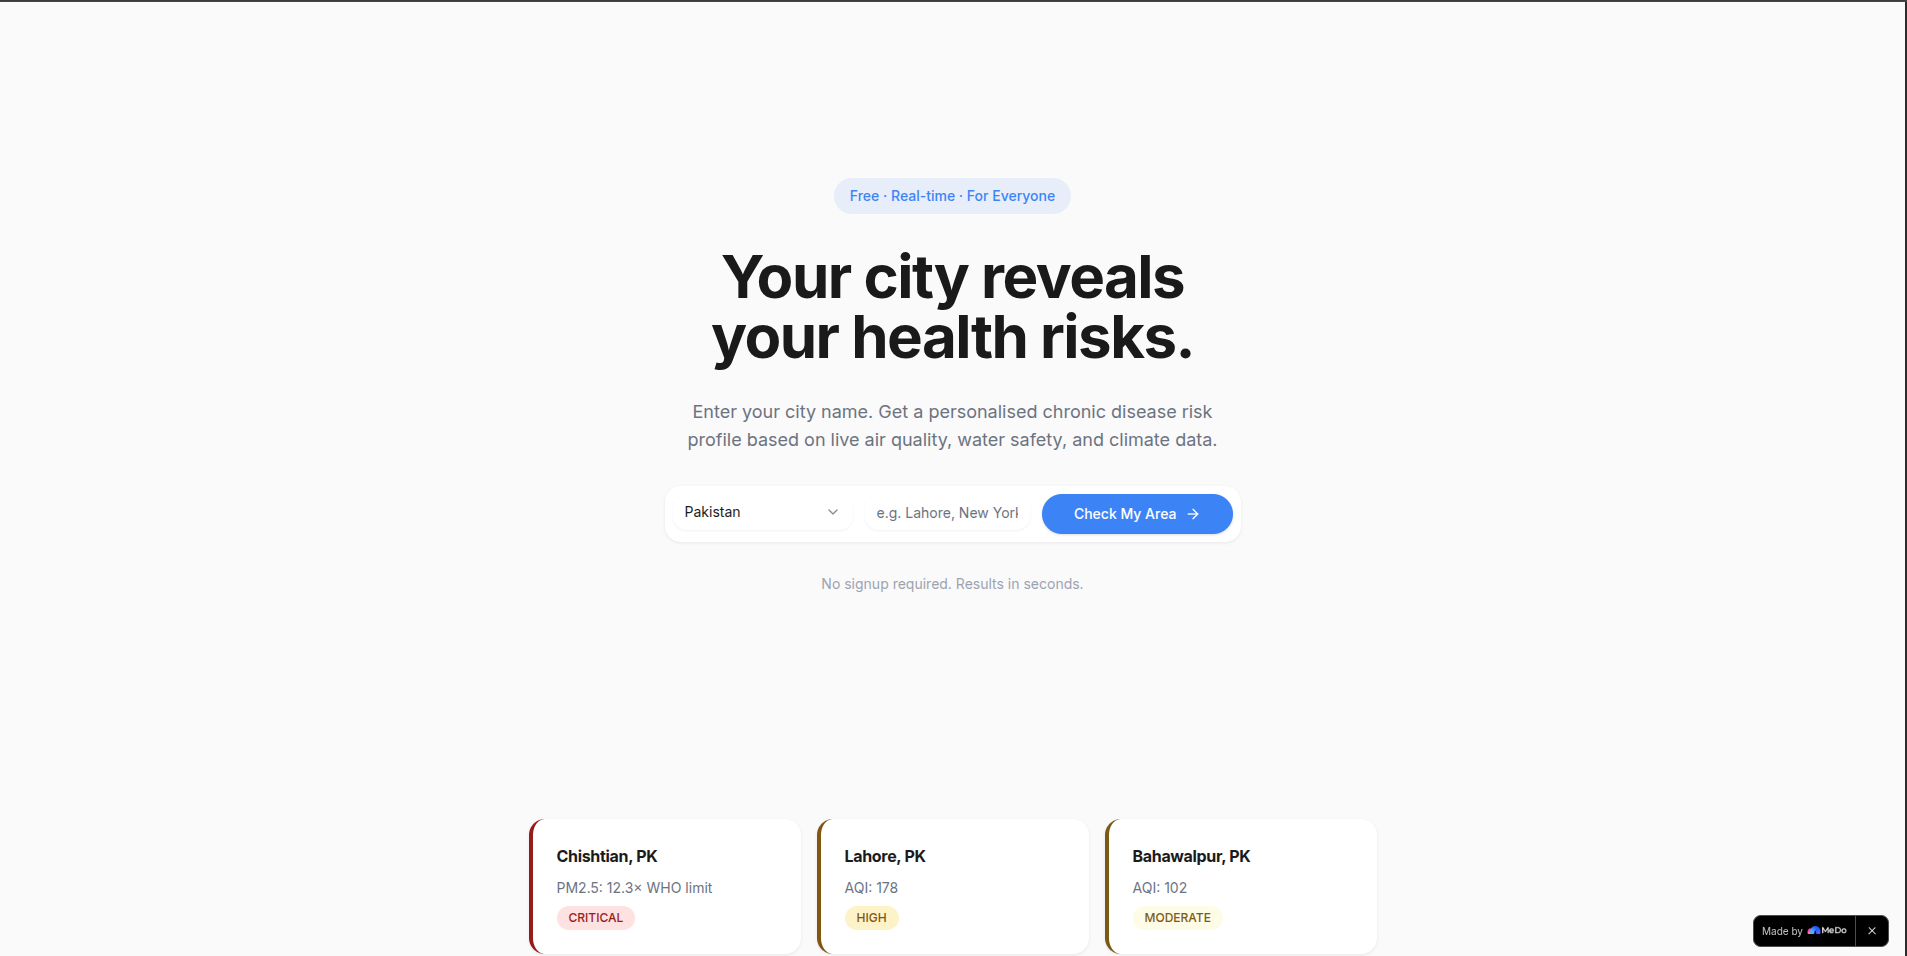
- Chishtian has PM2.5 levels at 12.3× the WHO annual safe limit
- Taunsa Sharif has E. coli detected in 100% of drinking water sources tested across 20 localities
- Bahawalpur recorded PM2.5 of 82.4 µg/m³ during peak months — nearly 17× the WHO guideline
These aren't statistics from a distant country. These are cities where real people — my neighbours, my family — live and breathe every single day. And almost none of them know what their environment is doing to their health.
That realisation became PostalRx.
What Problem It Solves
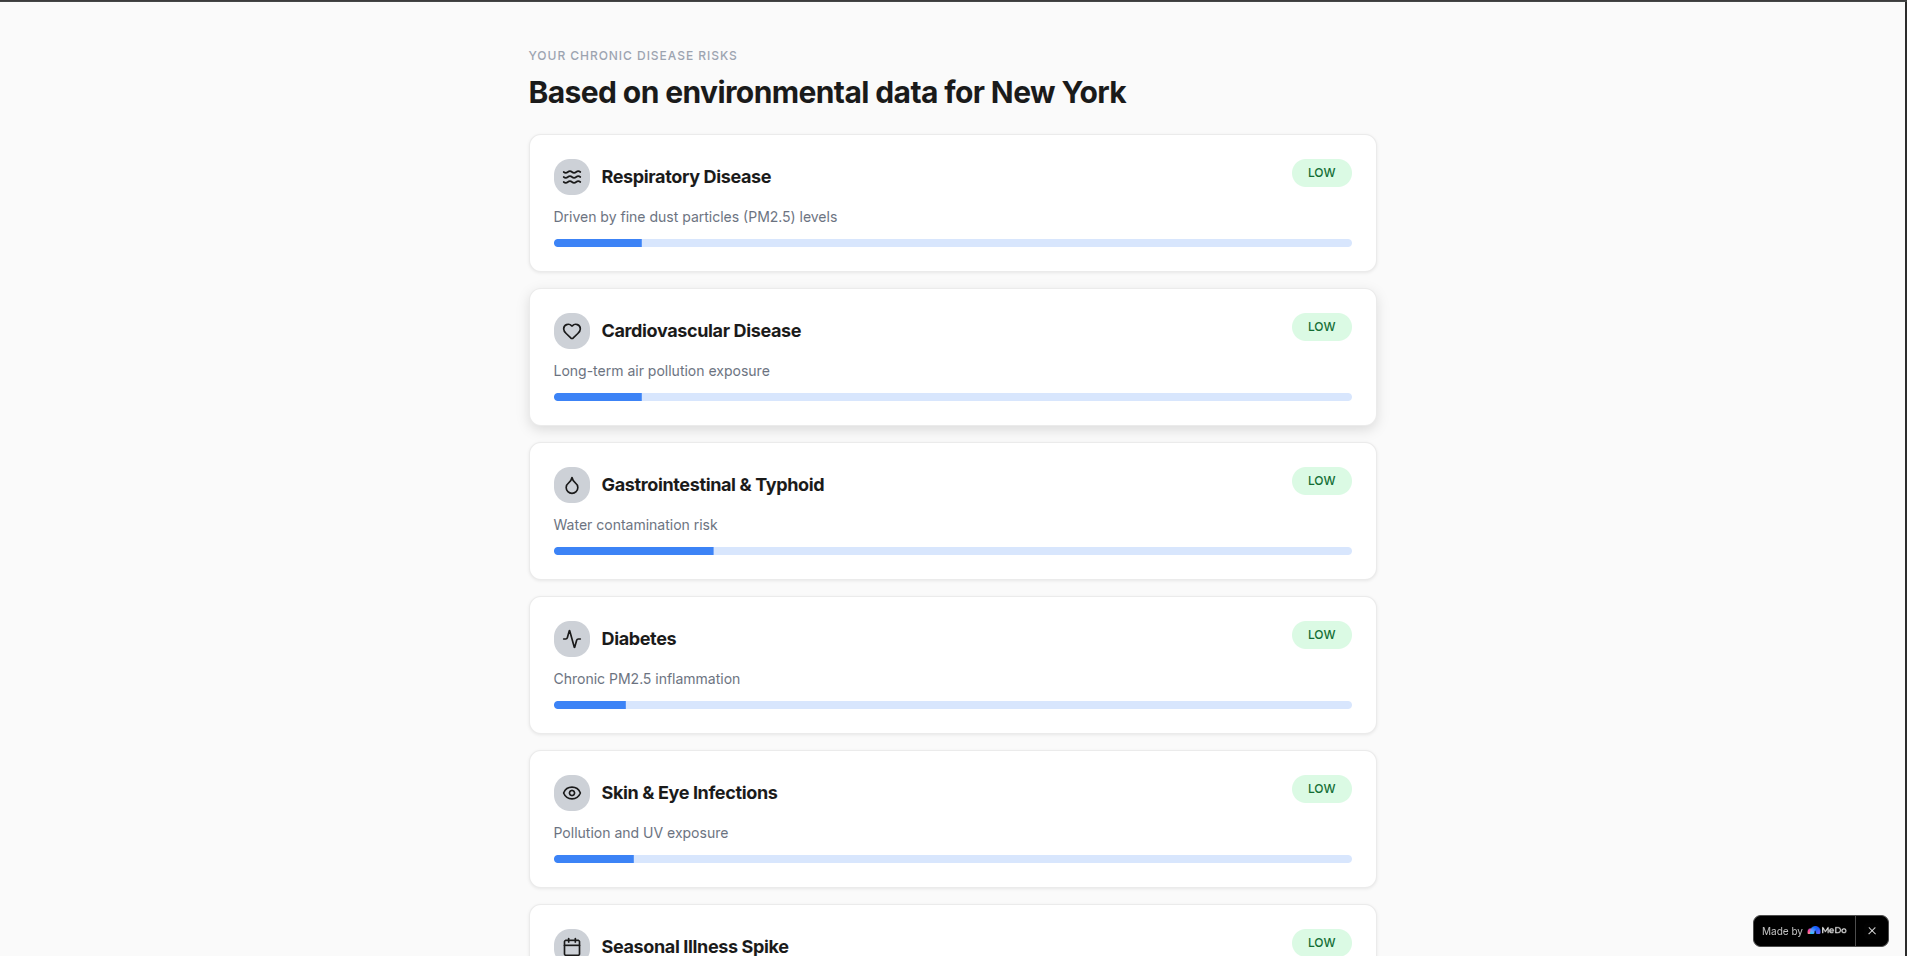
Chronic disease doesn't happen overnight. It builds slowly through years of environmental exposure — polluted air, contaminated water, toxic soil. The science is clear:
The relationship between PM2.5 exposure and mortality risk follows a well-established dose-response curve. Epidemiological studies model excess mortality risk $\Delta M$ as:
$$\Delta M = M_0 \cdot (e^{\beta \cdot \Delta C} - 1)$$
Where:
- $M_0$ = baseline mortality rate
- $\beta$ = concentration-response coefficient (~0.0058 for cardiovascular causes)
- $\Delta C$ = change in PM2.5 concentration (µg/m³)
For a city like Chishtian where $\Delta C \approx 61.5\ \mu g/m^3$ above the WHO limit of $5\ \mu g/m^3$, this translates to a cardiovascular mortality risk increase of approximately 42% for long-term residents.
Yet no consumer tool existed to translate this science into plain language for ordinary people. PostalRx fills that gap.
How I Built It
I built PostalRx entirely using MeDo — describing every component in natural language and letting MeDo handle the code generation, API integration, and deployment.
The Conversation-Driven Build Process
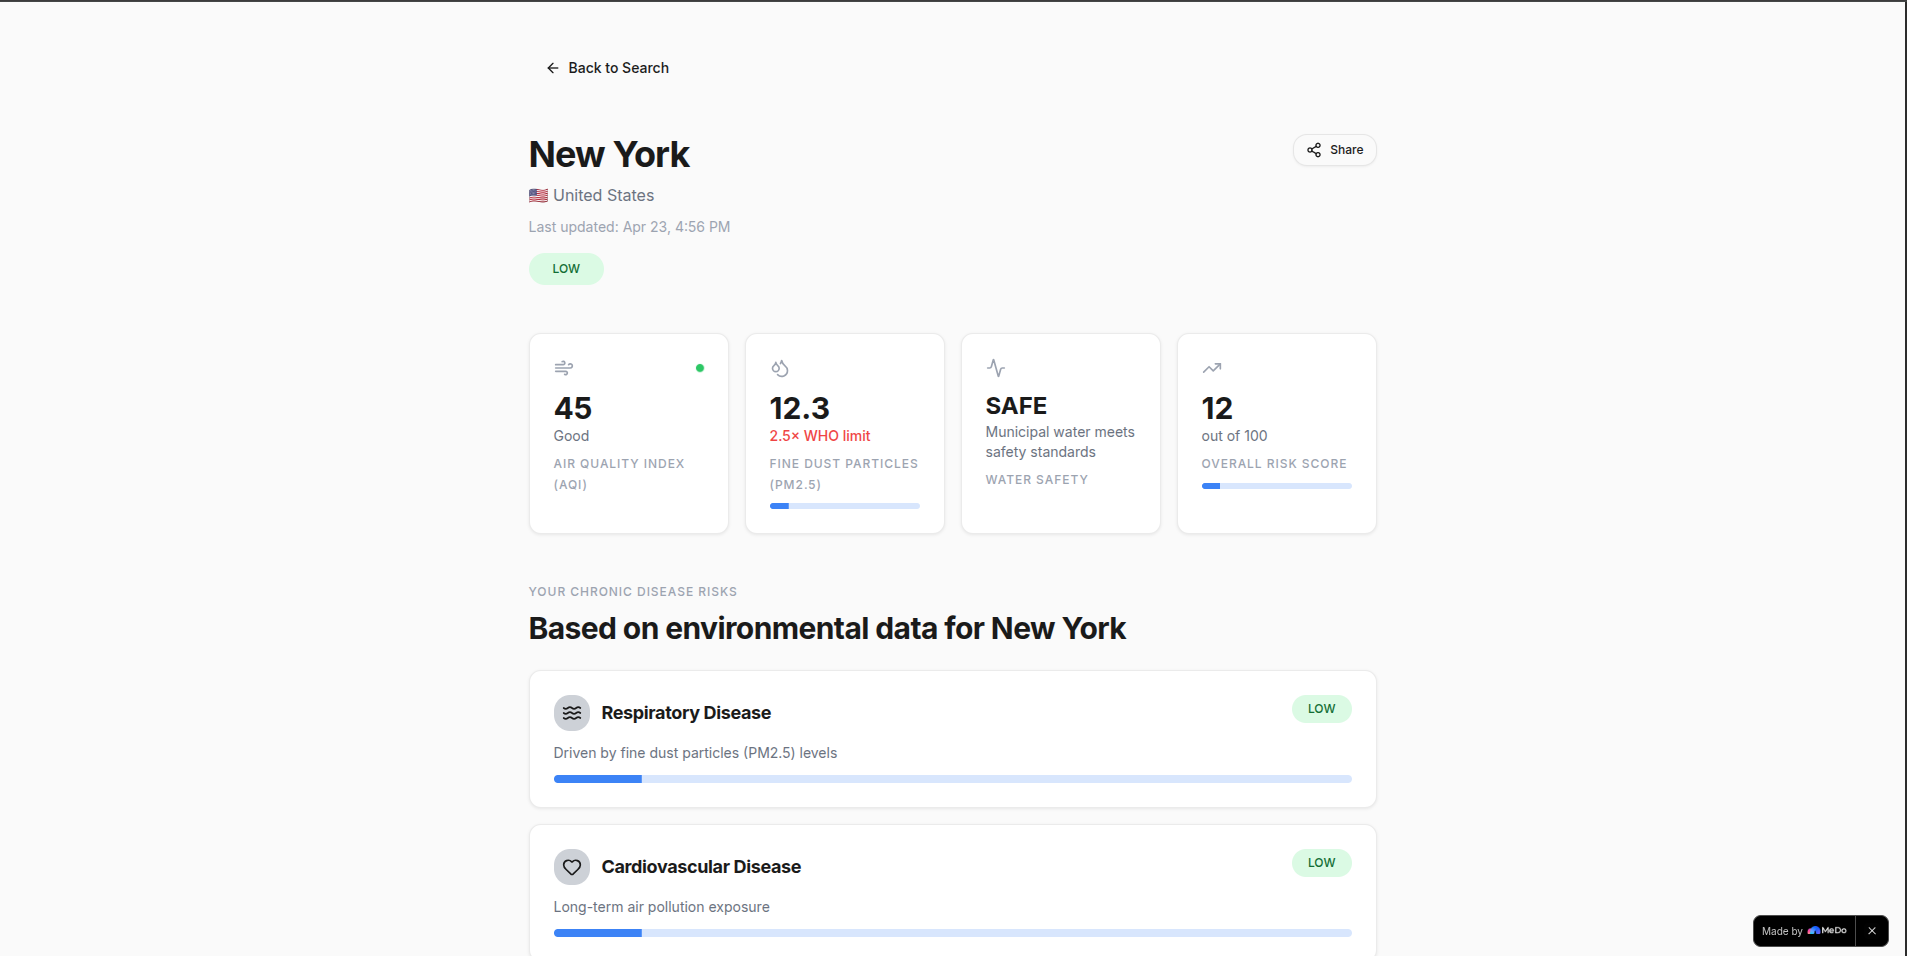
Step 1 — Product Spec I started by describing the full product vision to MeDo: a health risk dashboard that takes a city name + country and returns a personalised disease risk profile. I specified the design system, color palette, typography, and layout rules in detail.
Step 2 — API Integration I asked MeDo to integrate:
- IQAir API — for live AQI and PM2.5 data by city
- Open-Meteo API — for temperature, humidity, UV index
- Google Places API — for nearby clinic and hospital discovery
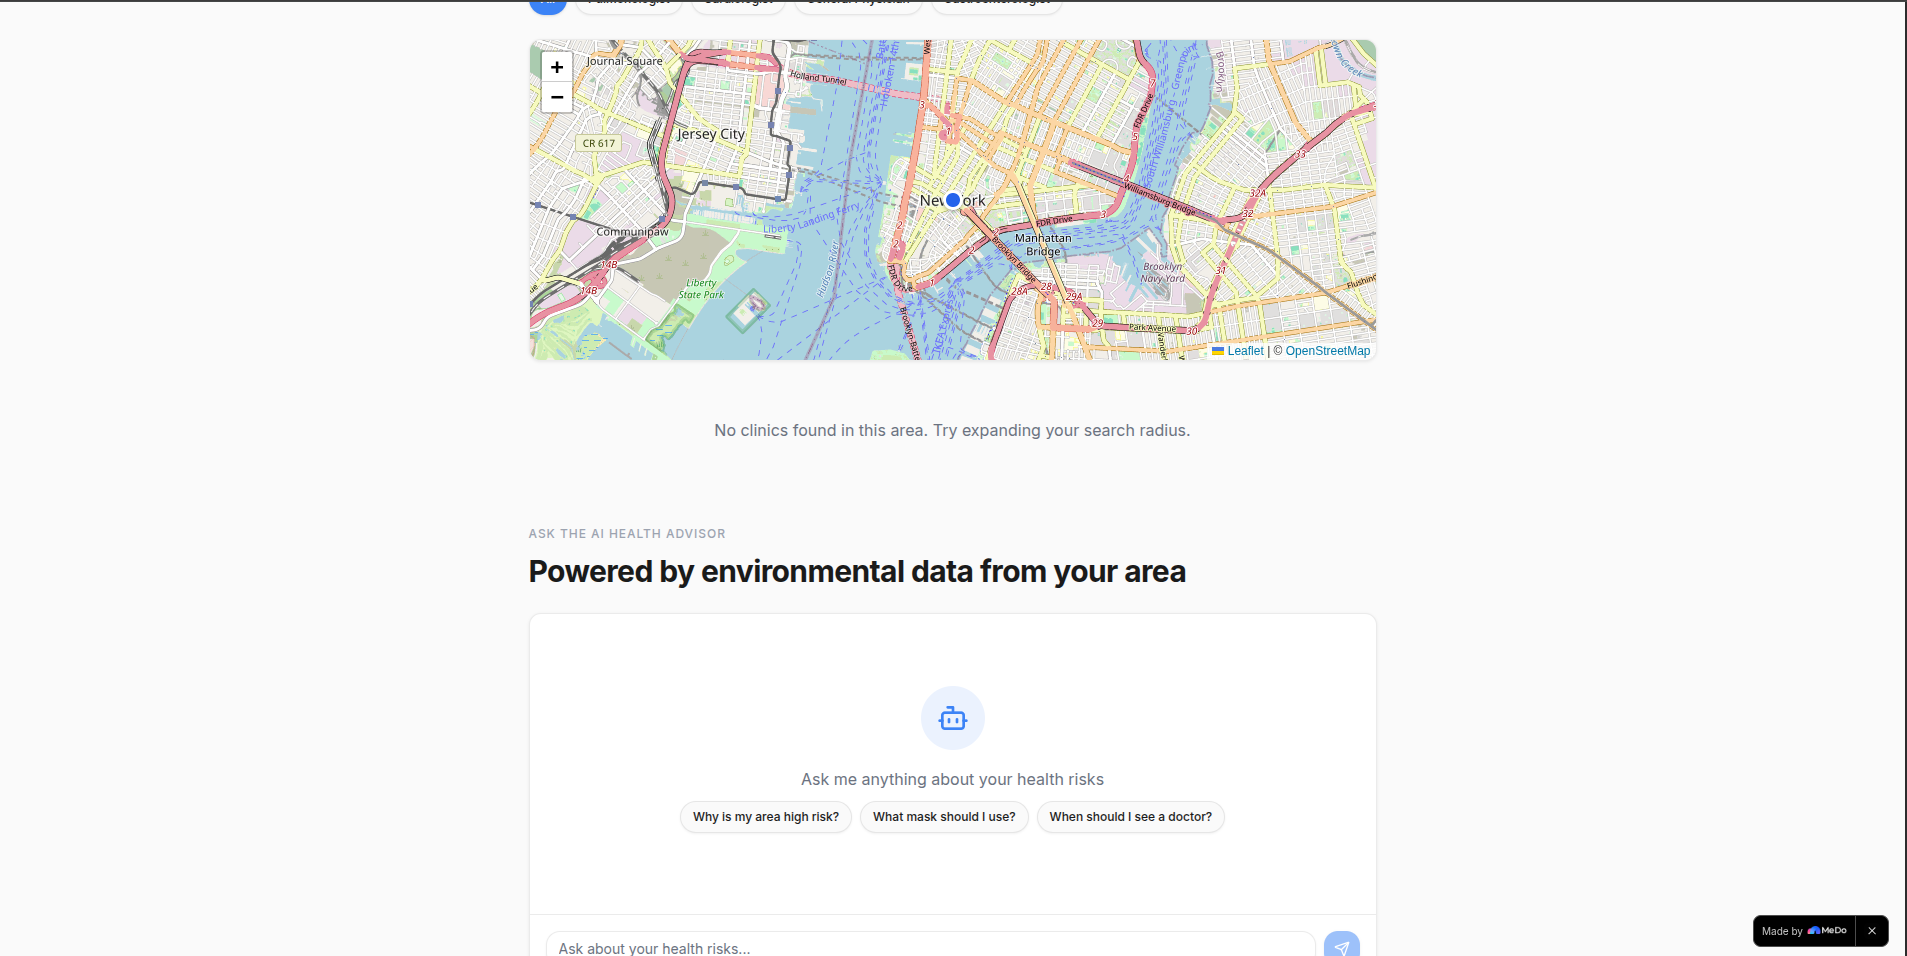
- Leaflet.js — for the interactive clinic locator map
Step 3 — Risk Scoring Logic I defined the scoring formula and MeDo implemented it:
The overall risk score $R$ is computed as a weighted sum:
$$R = 0.40 \cdot S_{PM2.5} + 0.35 \cdot S_{AQI} + 0.15 \cdot S_{water} + 0.10 \cdot S_{climate}$$
Where each sub-score $S_i \in [0, 100]$ is normalised against WHO and regional thresholds.
Risk levels are then classified:
$$\text{Risk Level} = \begin{cases} \text{LOW} & R \leq 25 \ \text{MODERATE} & 25 < R \leq 50 \ \text{HIGH} & 50 < R \leq 75 \ \text{CRITICAL} & R > 75 \end{cases}$$
Step 4 — AI Health Advisor I prompted MeDo to build a context-aware AI chat panel. The AI receives the city's full risk profile as context and responds in plain, jargon-free English — always under 100 words, always ending with a prompt to see a doctor for serious symptoms.
Step 5 — Clinic Locator The most complex feature. MeDo generated the full clinic discovery flow: Google Places query → map rendering → clinic cards with ratings, distance, open/closed status, and specialty filtering based on the user's dominant risk.
Step 6 — Deploy One click. MeDo deployed the full app to a public URL instantly.
Challenges I Faced
1. API Data Gaps for Smaller Cities
IQAir has excellent coverage for major cities but smaller towns often lack ground-level monitoring stations. I solved this by falling back to satellite-modelled AQI data and regional averages when live station data wasn't available — and clearly labelling estimated vs. live data in the UI.
2. Making Science Accessible
The hardest design challenge wasn't technical — it was language. Terms like "PM2.5", "AQI", and "fecal coliform" mean nothing to most people. I iterated with MeDo on plain English rewrites for every technical concept, adding tooltips and "what this means for you" callout boxes throughout.
3. Clinic Locator Accuracy
Google Places returns businesses broadly. I had to build specialty-matching logic that maps a user's dominant disease risk to the most relevant clinic type — so a user with CRITICAL respiratory risk sees pulmonologists first, not dentists.
4. Responsible AI Messaging
An AI health advisor can easily cross the line into fake diagnosis. Getting the AI system prompt right — helpful but never diagnostic, informative but always deferring to doctors — required careful iteration.
What I Learned
MeDo is fastest when you give it complete context. The more precisely I described the design system, API behaviour, and UX logic upfront, the less back-and-forth was needed.
Environmental health data is shockingly accessible — but nobody has connected it to consumer-facing tools in a meaningful way. PostalRx is genuinely filling a gap that shouldn't exist.
Simplicity is the hardest feature to build. Making a complex, data-heavy product feel effortless for a non-technical user took more design thinking than any of the API work.
Real data tells better stories than fictional ones. The moment I plugged in real cities and saw Chishtian's 12.3× WHO limit appear on screen — that's when I knew this product mattered.
What's Next
- [ ] Expand water quality data with regional government datasets
- [ ] Add historical AQI trend charts (7-day, 30-day)
- [ ] Push notifications for dangerous pollution spikes
- [ ] Multi-city comparison mode
- [ ] Urdu and regional language support for South Asian users
Built with MeDo. Inspired by the cities I call home.
Built With
- leaflet.js
- openai
- react
- vite

Log in or sign up for Devpost to join the conversation.