-

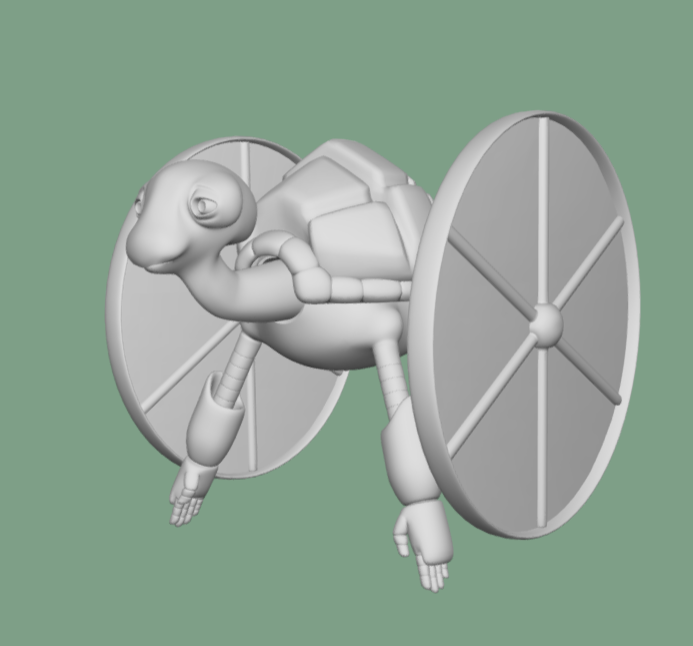
HERMAN (HARDWARE MODEL)
-

FRONT VIEW OF MODEL
-

MOTHERBOARD
-

LIVE MAP
-

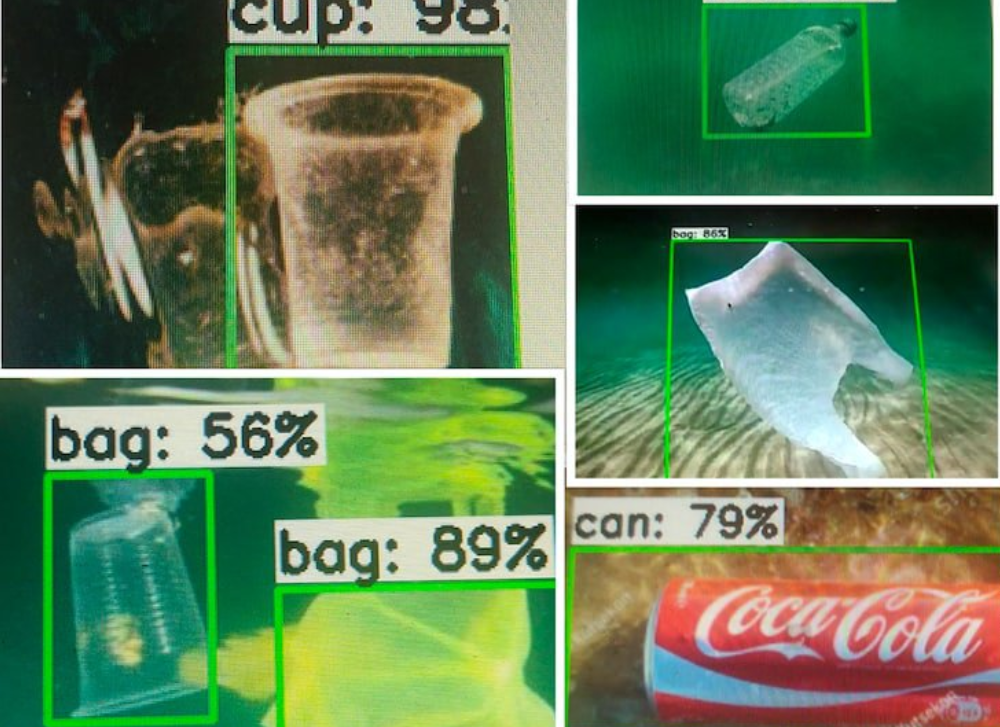
COMPUTER VISION MODEL TRAINED ON IMAGES OF WASTE AND DEBRIS SCALING OFF DESIRED OUTPUT
-

SIGNALS FROM HOTSPOTS


Project Type : Working Prototype
Summary
Herman, Poseidon's last hope, a robot turtle going to save the ocean like a superhero. Herman is designed to detect, monitor, and quantify marine debris with the use of machine learning algorithms, real-time high precision object detection programs and an eco-friendly look in the ocean; because the fishes need to feel safe too. Herman serves to provide safe automated surveillance in the ocean and also report data essential for predicting waste hotspots based on other factors like ocean current, temperature, and concentrations of algae that develop due to the presence of waste and greenhouse gases -- which is very important in solving the challenge.
Inspiration
We realized that there wasn't any map that shows you the concentration of wastes dumped in the water bodies and due to this most of the people were unaware of the fact, as to how badly the marine debris is affecting the organisms within as well as we human beings. So we wanted to communicate with the mass about this buried and serious issue of marine debris by building a live map that would monitor the amount of plastics and their age; hence we chose this problem statement.
How we built it
Our project is divided into two sections : the hardware (the model that's structured in the form of a turtle and likewise would be released on to the water bodies) and the software (the server and user end part that would update the map information regarding the concentration and hotspots of marine debris).
HARDWARE Components for the eyes:
- Raspberry Pi Camera Module 2 - 4 pieces for the anterior part of the turtle and for the pivot areas of the turtle propellers
- White LEDs for illumination under the sea Motherboard (shell):
- Raspberry pi 4 - running the TensorFlow model and sending feedback through saildrone. Covered by a 3D printed water resistance shell-like case
--> Wheels
- Servo motors : mobility in the ocean using tracked distance mapping and pathfinder Modeling of the wheels will have small flaps inclined at the vertices of the perpendicular bars that hinge the wheel into shape. This will serve to displace water when the servo motors are activated, causing the wheel to rotate and move Herman the turtle. But for the lateral character movement, Herman is going to rely on servo motors controlling the limbs. The use of both limbs to steer left and right in water will enhance faster completion of tasks in a defined automated area.
MODE OF OPERATION
- Our hardware is developed through an AI route-mapped robot model that uses an OpenCV trained image data Tensorflow model to detect, monitor and quantify plastic waste under the ocean and report instances of found material as api queries to server.
- Live frames from the raspberry pi camera modules will be analyzed for signs of plastic waste from trained data on how plastics in the ocean will look like. Output data will then be recorded and saved on the raspberry pi model B storage device.
- The Quantified data will include picture frames of debris in the ocean ,which will be classified by the model and update it to our server.
- Our hardware model will be Integrated with the Saildrone(NASA) platform api for the sole purpose of sending parsed data from observational routines in the ocean to a server for live map showcase and analysis
SOFTWARE
- Initially we started with creating a web based UI for our web app. While using our webapp, our end user would initially encounter our home page, which has a navigation bar, to redirect you to pages that contain our live map which shows the hotspots of the shores where marine debris were identified, virtually reality based hardware model, documentation (giving a brief insight about the available datasets) and the creators of this project. The UI was built purely through HTML,CSS and JS.
- We developed our live map through the available open datasets, that contained the plastic wastes collected/identified by individuals(localites/organization) in the seashore and henceforth performed visualization and analysis on them.
- The live map was developed using ArcGis Software tool and the visualization for the datasets were made using Jupyter Notebook.
- For object detection we used tflite model(single shot detectors).
- Furthermore, we would be integrating multiple datasets from the NASAs portal, so that it can contribute in finding the hotspots of the marine debris and also develop a roadmap for the hardware model. For eg : the sentinel data obtained from esa that shows the chlorophyll concentration in the water bodies, can help us predict which zones are likely to have wastes. Greater concentration of chlorophyll, means there is a greater chance of the debris being identified. Also the data from NASA can be used to measure the oceanic temperature and the greenhouse gas rate and likewise predict the chances of marine debris being there.
Challenges we ran into
CHALLENGES FACED WHILE BUILDING THE HARDWARE MODEL
- We faced a couple of challenges for selecting the components for hardware as we wanted to make it as much as environmental and pocket friendly.
- Choosing the algorithm was a difficult task and we had to resort to a heuristic approach
- During code execution we faced a couple of problems as our systems didn't provide a very high computational speed .
- Sometimes our model gave wrong results or very less accuracy, for eg: when our model was shown the picture of a plastic bottle it detected it as a plastic bag
CHALLENGES FACED WHILE BUILDING THE SOFTWARE MODEL
- It was quite hard to find accurate datasets as there were multiple options available
- Cleaning the datasets took a long time as the datasets were huge
- Direct datasets regarding the marine debris weren't available. So had to resort other way and perform analysis and assumptions from the existing datasets.
- The software tool we are using to develop a map that said the concentration of marine debris on the shores only supported importing a limited amount of data
How we plan on advancing our prototype
- Initially we used the datasets from noaa that contained the data on the debris waste updated by the app users and likewise we optimized and built a precise map that shows the sea shore hotspots of marine debris along with a detailed explanation of the type and concentration of the waste found.
- We would be integrating multiple datasets from the NASAs portal, so that it can contribute in finding the hotspots of the marine debris and also develop a roadmap for the hardware model.
- The sentinel data obtained from esa that shows the chlorophyll concentration in the water bodies, can help us predict which zones are likely to have wastes. Greater concentration of chlorophyll, means there is a greater chance of the debris being identified. Also the data from NASA can be used to measure the oceanic temperature and the greenhouse gas rate and likewise predict the chances of marine debris being there.
- The sentinel-5P data obtained from esa would allow us to monitor the tropospheric nitrogen level over the ocean and derive assumption about the concentration of the waste. The same applies for the methane level tracker datasets obtained from Global Monitoring library. We would combine these two datasets along with other datasets from NASA such as the NASA Ocean Biogeochemical Model assimilating satellite chlorophyll data(that measures the oceanic temperature), the polar path finder data from nsdic that monitors the motion of the ice (as Sea ice accumulates more than its fair share ) so as to monitor where the plastic waste is coming from and henceforth build a roadmap for our hardware model, the information from airsar along track giving us an idea about the oceanic wave speed and direction.
- We would be integrating all these datasets and henceforth derive a predictive model that would predict the concentration and hotspots for marine debris and build a road map for our hardware model.
What we learned
- Our team compromised of diverse backgrounds. So in a nutshell, we got to learn a lot from each other and also were able to help the other when they were stuck at some instance.
- We also expanded our idea, by considering and putting forward each one of our thoughts . Through this approach we were also able to resolve the problem we were facing. For eg: when one of our team member had difficulty in visualizing the data , the other would work along with team member and together they would solve the problem , quickly as well as precisely
Conclusion
Since our team is majorly focused on fusing tech with climate change , we hope to advance and take our project further, so that as human beings we can utilize our potential and play a part in fighting climate change
{The snapshots of our working prototype and the 3D view of our hardware model are inserted in the beginning}
{Also we have uploaded a presentation in place of video}


Log in or sign up for Devpost to join the conversation.