Inspiration
Food insecurity and food waste are rising at the same time, a contradiction that exposes major inefficiencies in our agricultural system. While millions struggle to access fresh food, large amounts of produce never make it to consumers due to spoilage, mismanagement, and broken supply chains. I wanted to create a tool that helps us see where the system is breaking, using real USDA data from 2022–2023. PortPlateAI was inspired by the need to make agricultural data more transparent, accessible, and actionable for anyone looking to understand and reduce waste.
What it does
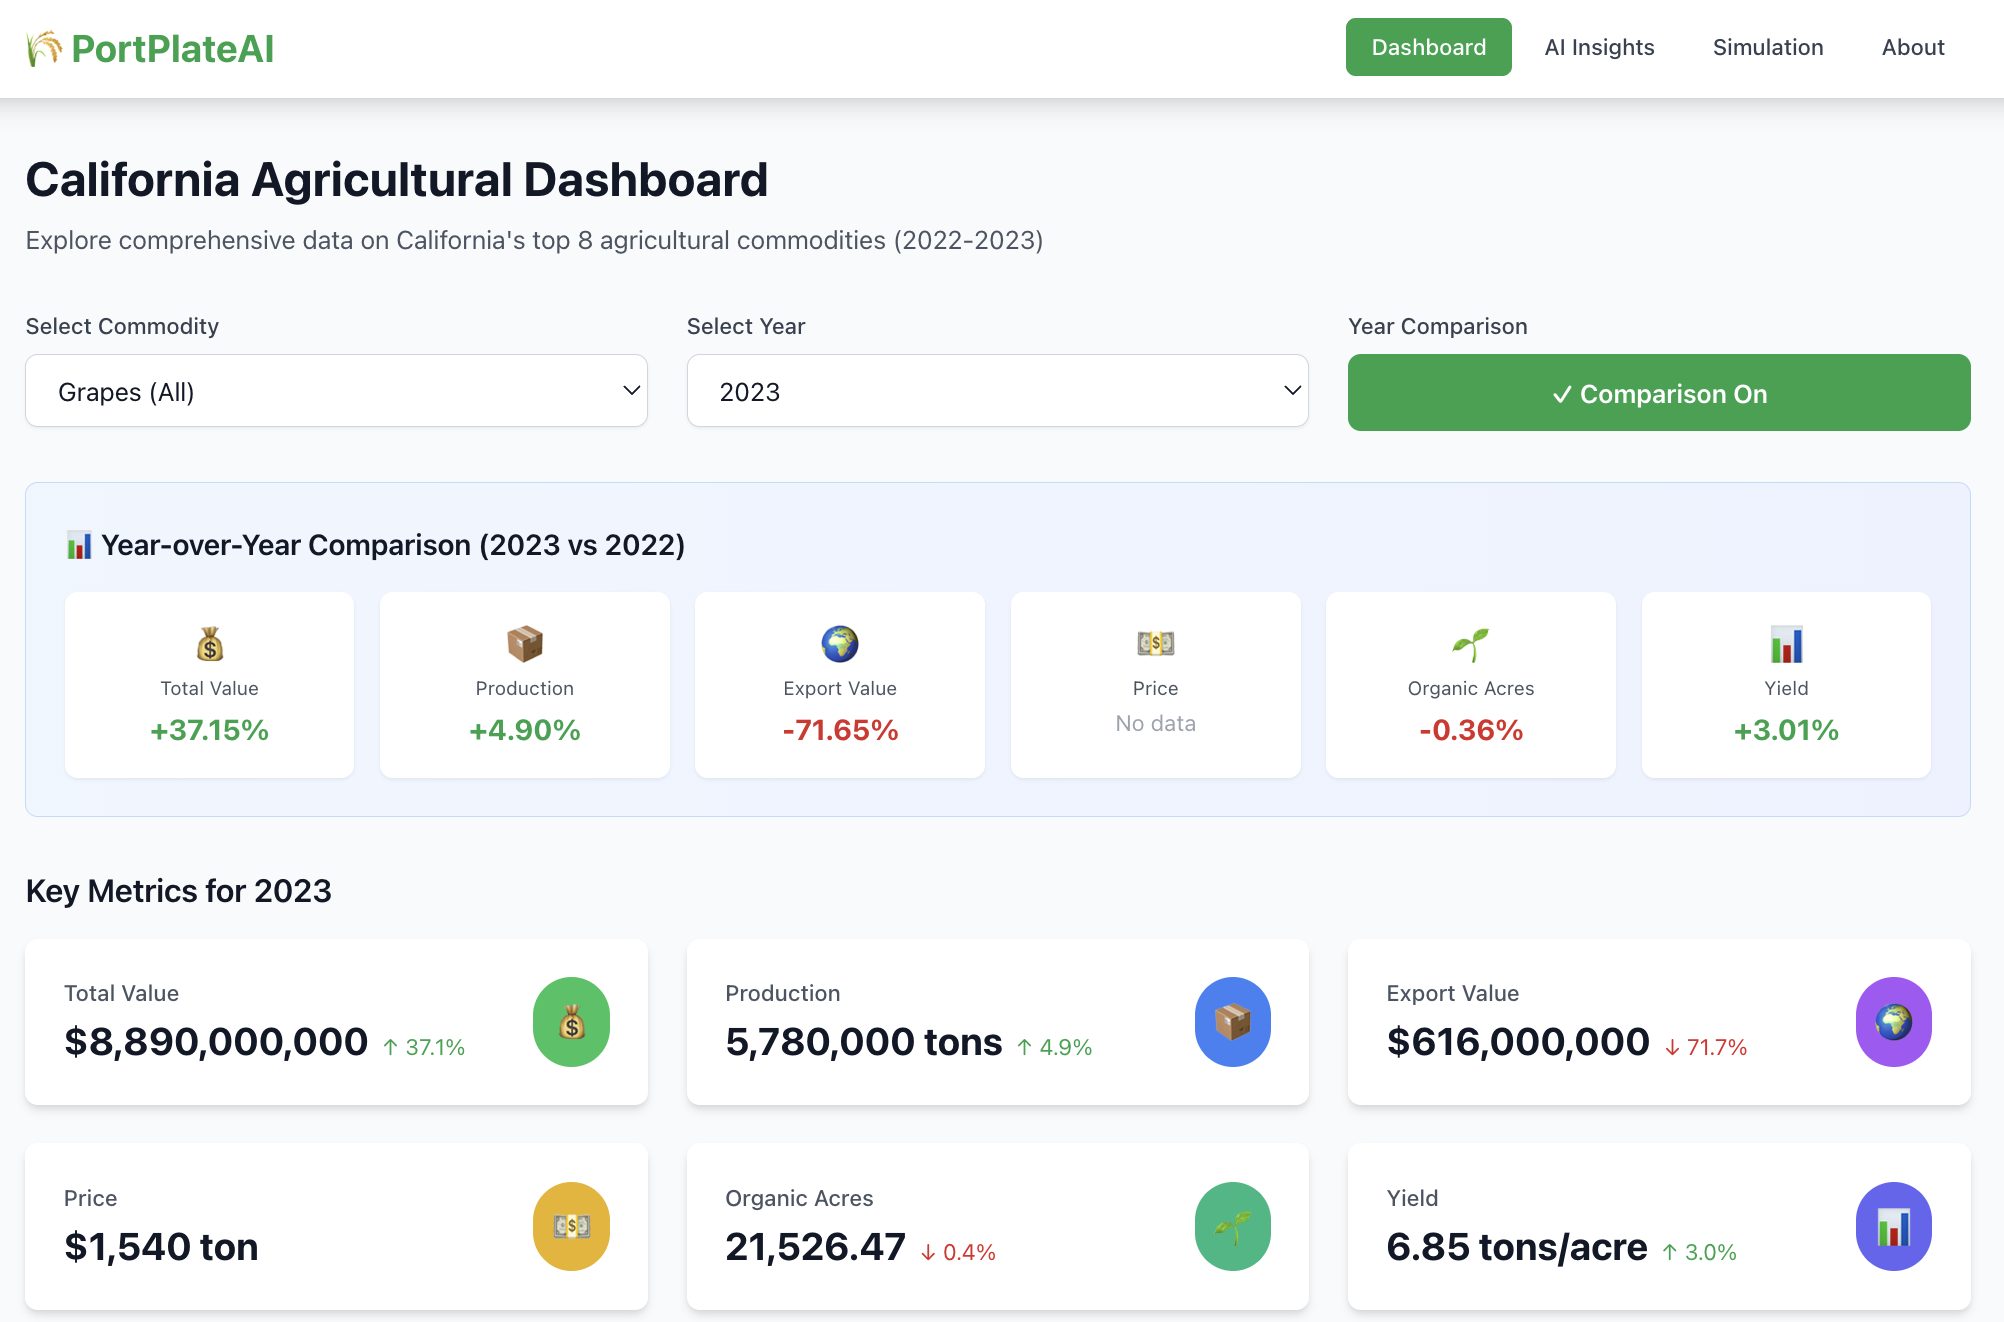
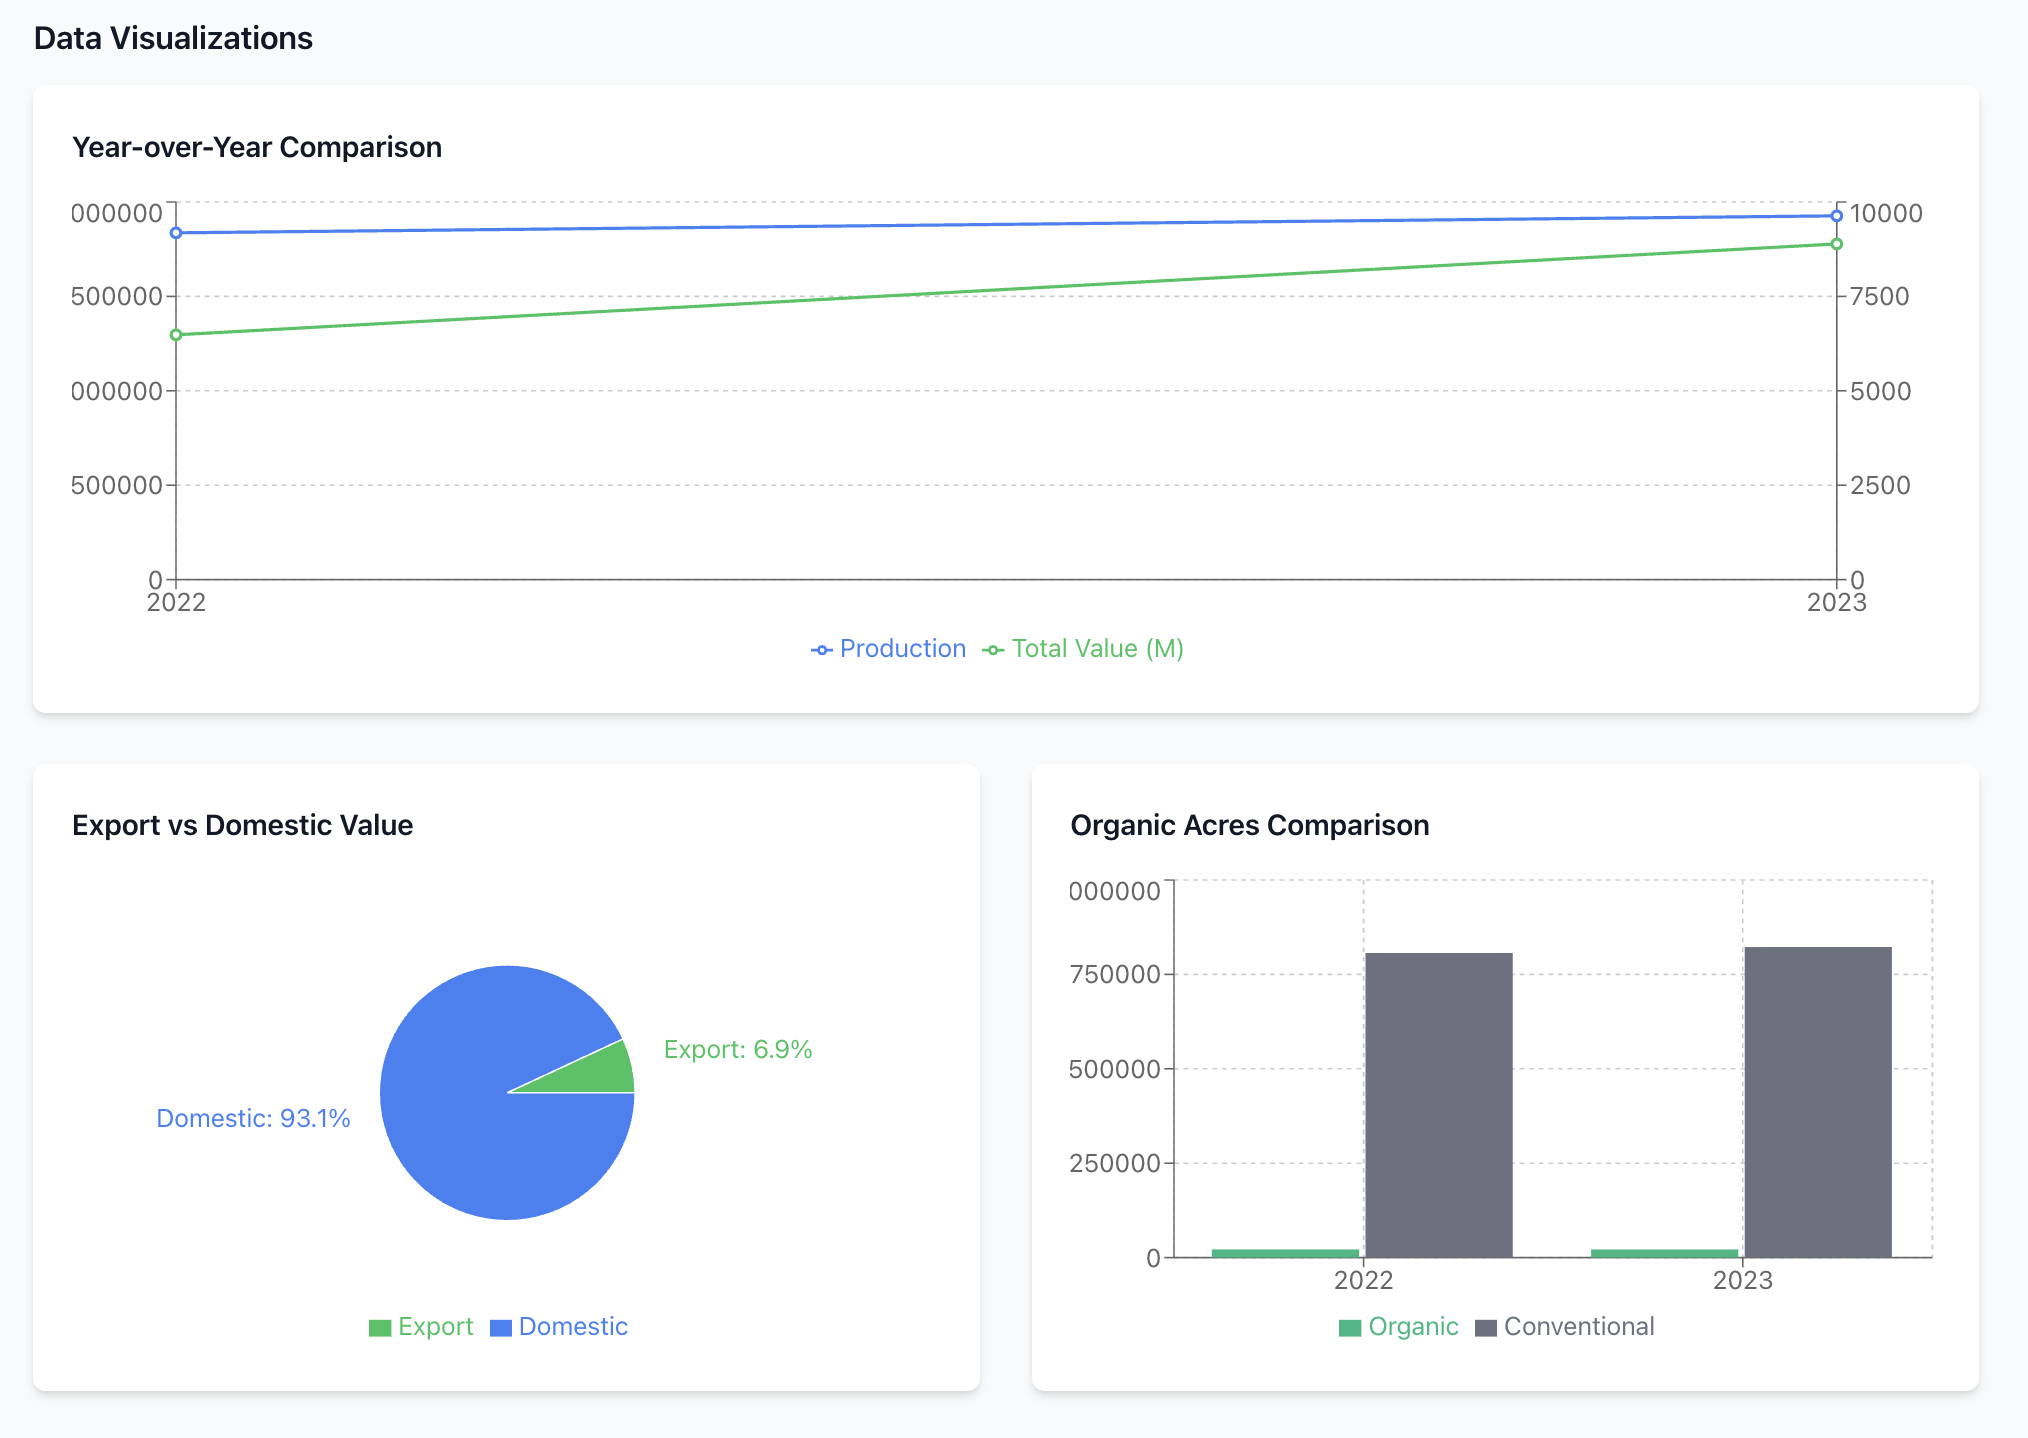
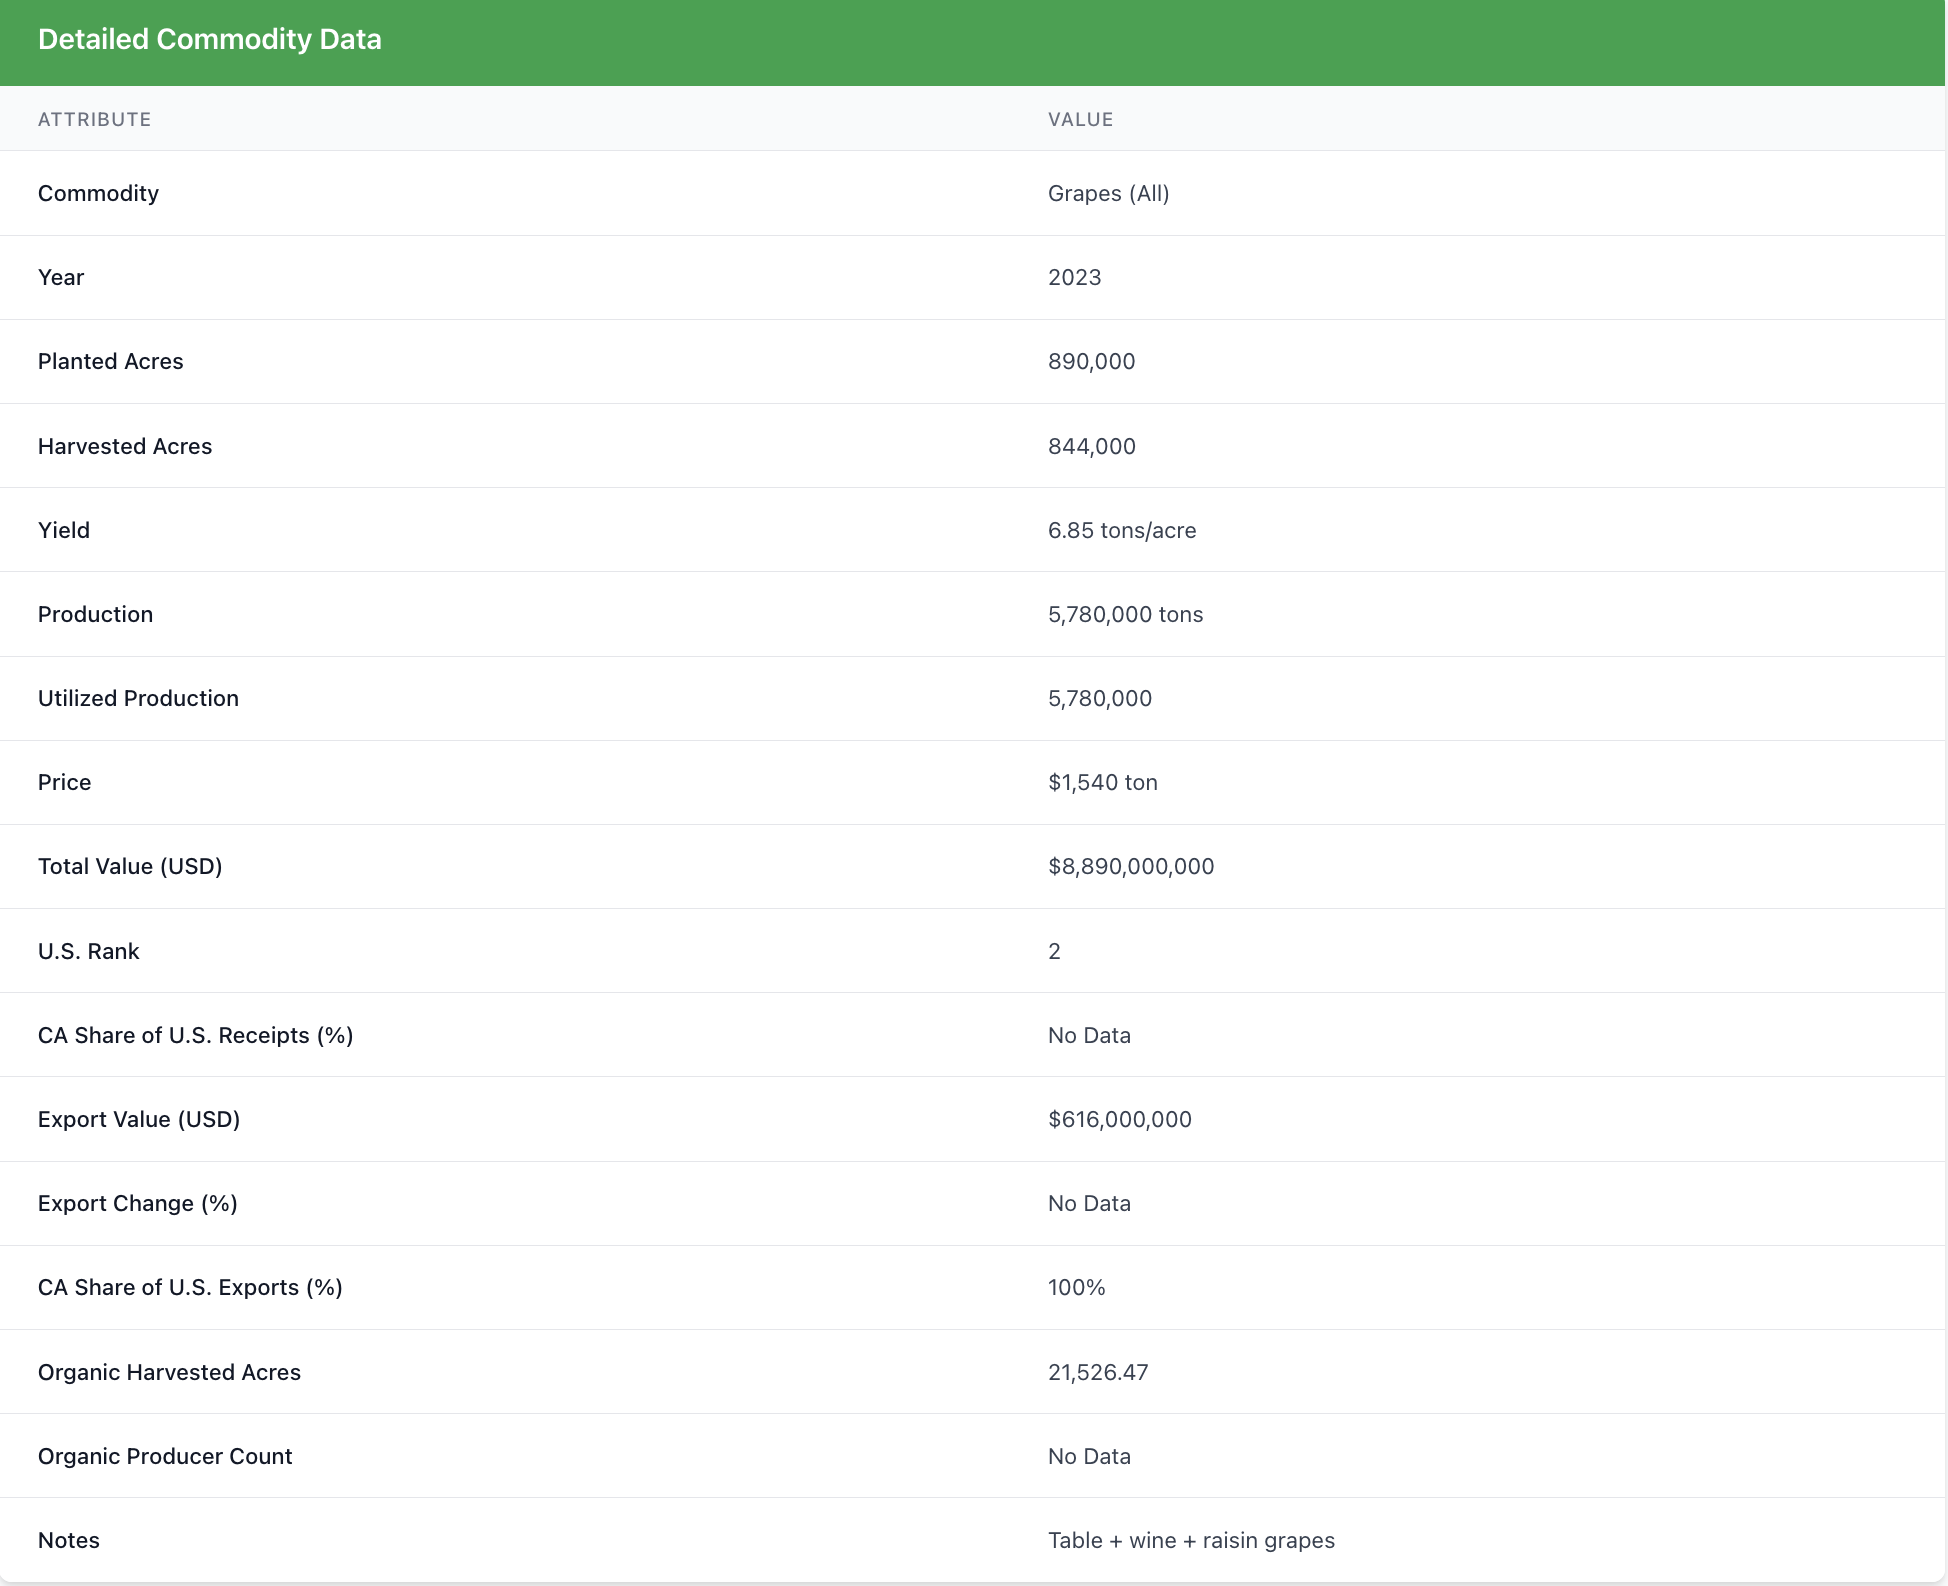
PortPlateAI is an interactive analytics dashboard that transforms USDA agricultural data into clear, visual insights. It allows users to:
- Explore commodity trends and revenue breakdowns
- Compare multiple commodities side-by-side
- Simulate spoilage using mathematical decay models
- Upload CSV datasets for instant visualization
- View county-level production patterns across California -Prepare the data for future AI or machine learning analysis The platform turns complex datasets into intuitive, data-driven stories that help users understand how food moves through the system, and where it’s lost.
How we built it
The platform was built using React and Vite for speed, TailwindCSS for styling, and JavaScript charting tools for visualizations. A CSV ingestion pipeline processes USDA data, while spoilage simulations use simple exponential decay models. The project is structured with reusable components and an AI-ready architecture, making it easy to scale and integrate future machine learning features.
Challenges we ran into
One major challenge was cleaning and standardizing USDA datasets, which varied in format and completeness. Building accurate yet intuitive spoilage models required experimentation. Ensuring that charts loaded smoothly with large datasets and keeping the interface responsive also took careful optimization. Each challenge helped improve the design and structure of the dashboard.
Accomplishments that we're proud of
We successfully transformed raw USDA reports into an easy-to-use interactive dashboard. The spoilage simulation engine, data ingestion pipeline, and responsive UI all came together to create a clear experience for exploring agricultural trends. We are especially proud of how scalable and organized the architecture is, making future expansion simple.
What we learned
This project taught us how to extract insights from real-world datasets and communicate them through clean visual design. We learned about agricultural trends, spoilage behavior, and how data-driven tools can help address food waste. On the technical side, we deepened our skills in React, TailwindCSS, data parsing, and building maintainable front-end systems.
What's next for PortPlateAI
Next, we plan to integrate machine learning models to predict spoilage and yield, automate USDA data collection, and expand the dashboard with more commodities and analytics. We also hope to add forecasting tools, backend storage, and more advanced insight modules. The long-term goal is to help reduce waste and support smarter decisions across the food system.
Built With
- css
- csv
- html
- javascript
- node.js
- react
- tailwindcss
- vite

Log in or sign up for Devpost to join the conversation.