PortfolioIQ — Equity Risk & Returns Engine
Inspiration
As mathematics students, we wanted to bridge the gap between theoretical finance and real market data. Managing a ₹10,00,000 hypothetical portfolio across 15 NSE stocks pushed us to think like actual quant analysts.
What We Built
A complete equity analysis pipeline covering:
- Task 1: Fetched 2 years of daily OHLCV data (Jan 2023 – Dec 2024) for 15 NSE stocks using yfinance
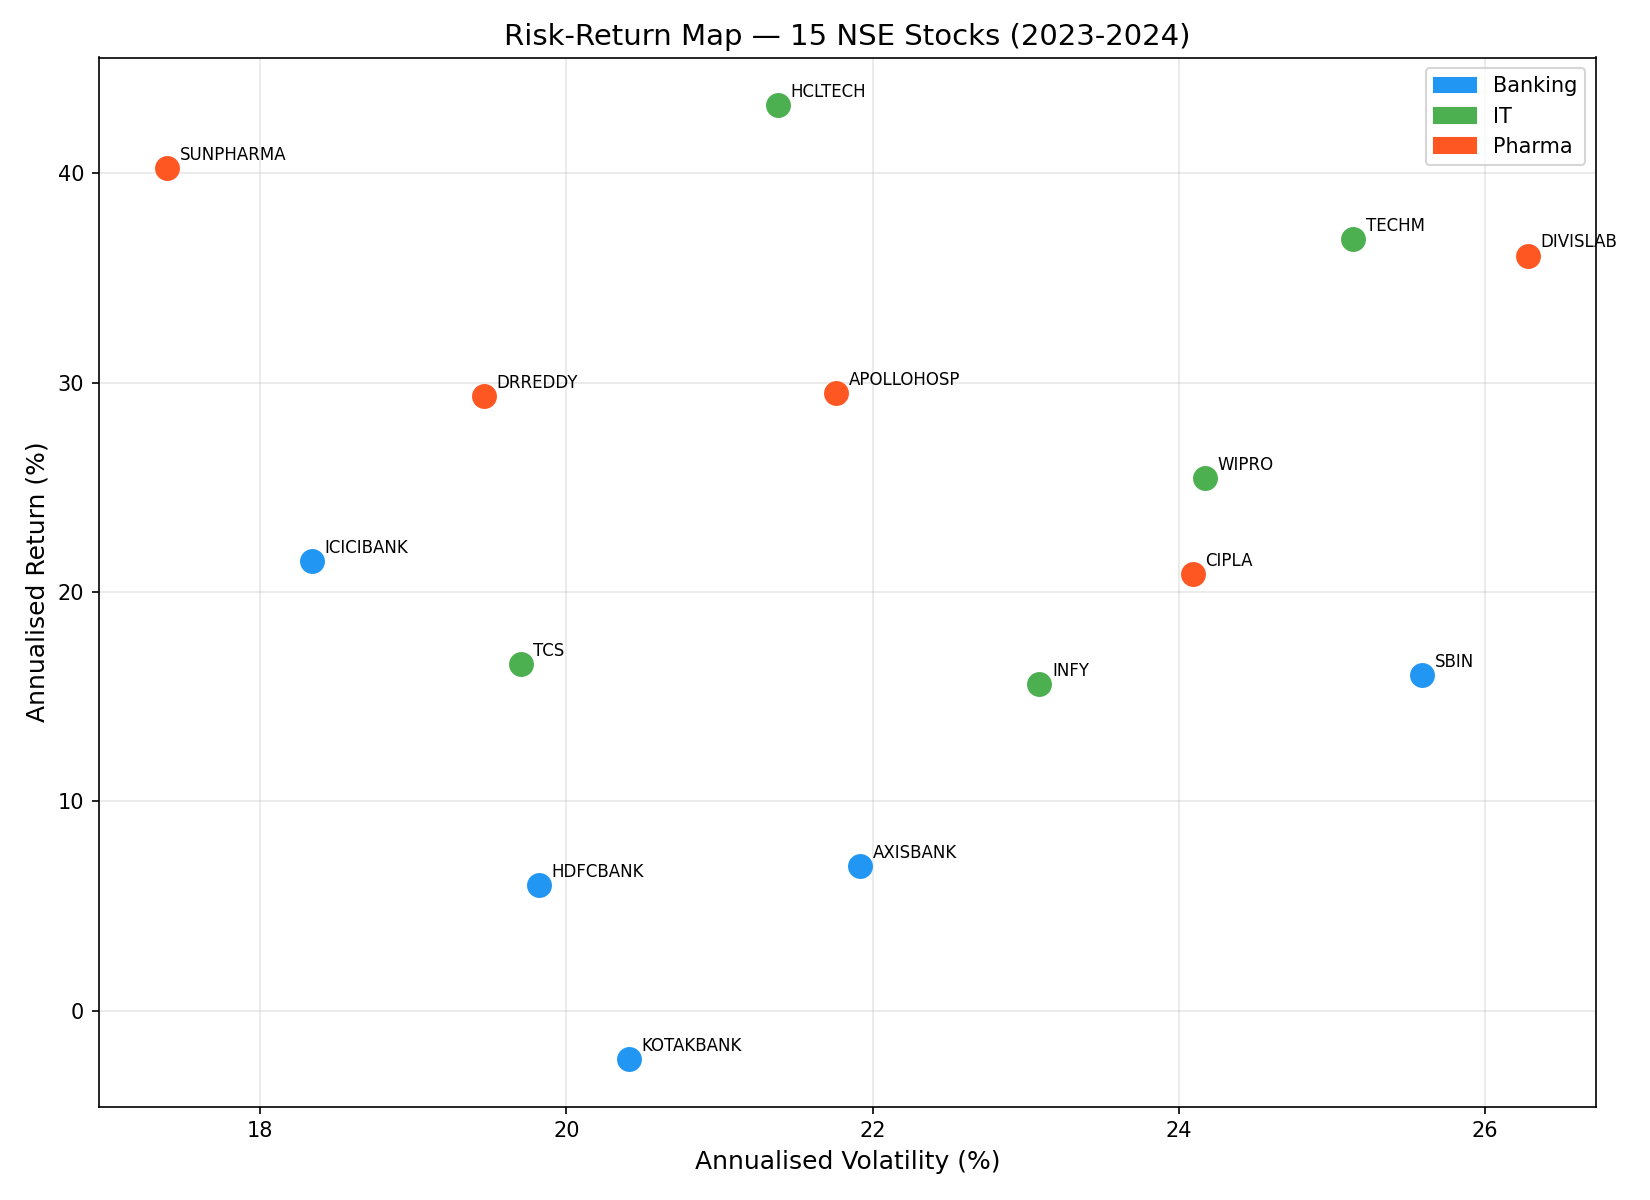
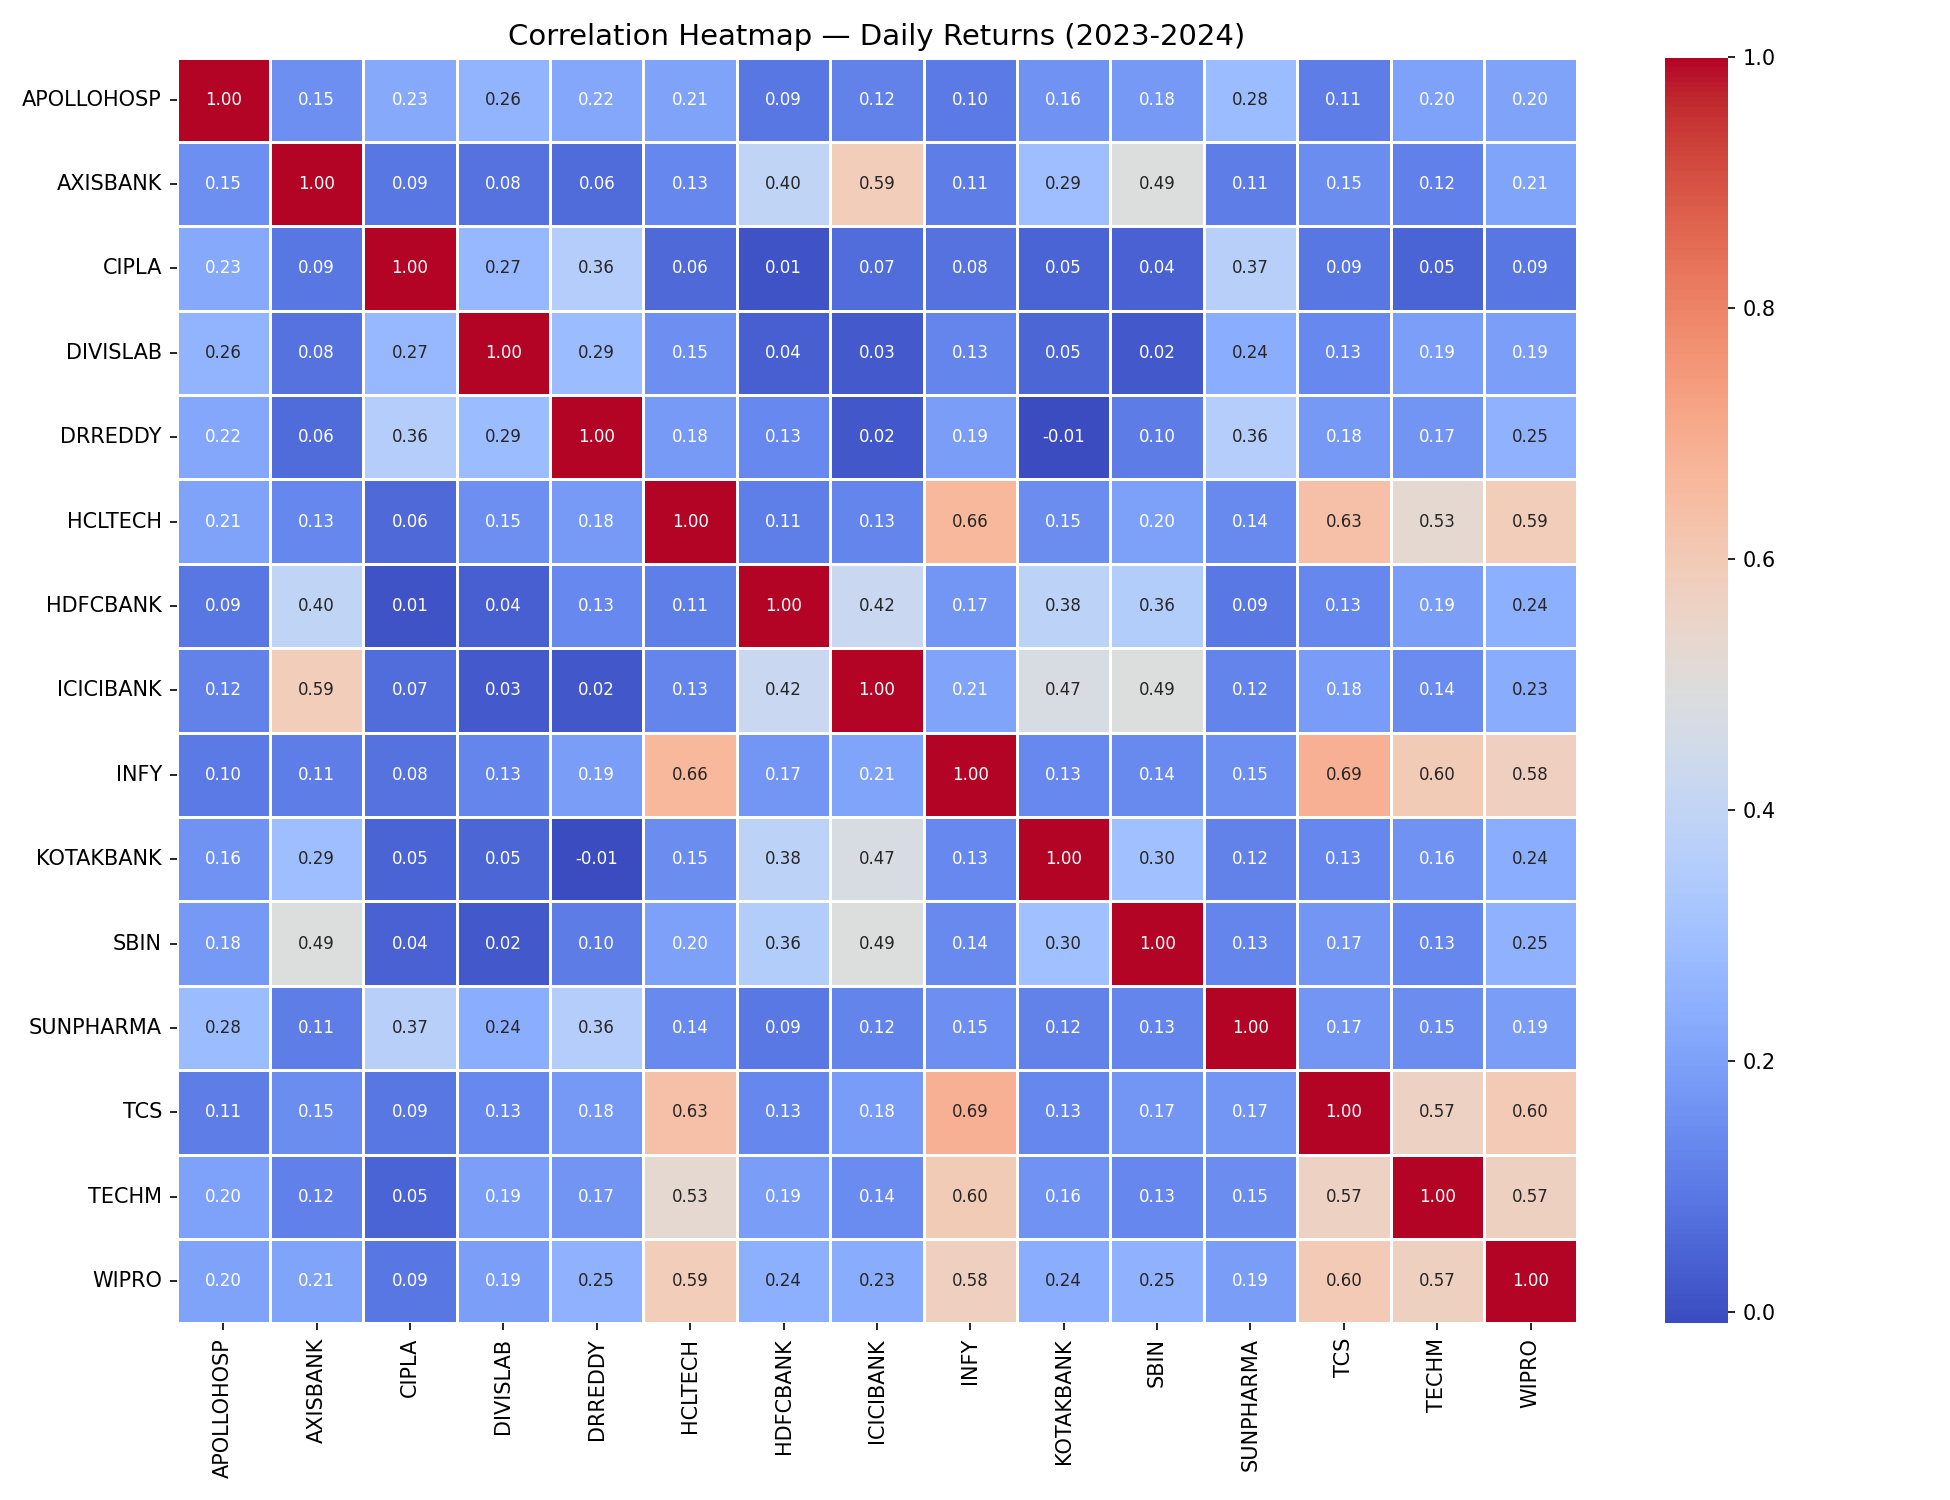
- Task 2: Computed 6 risk metrics per stock — Annualised Return, Volatility, Sharpe Ratio, Beta vs Nifty 50, Max Drawdown, SMA Signals
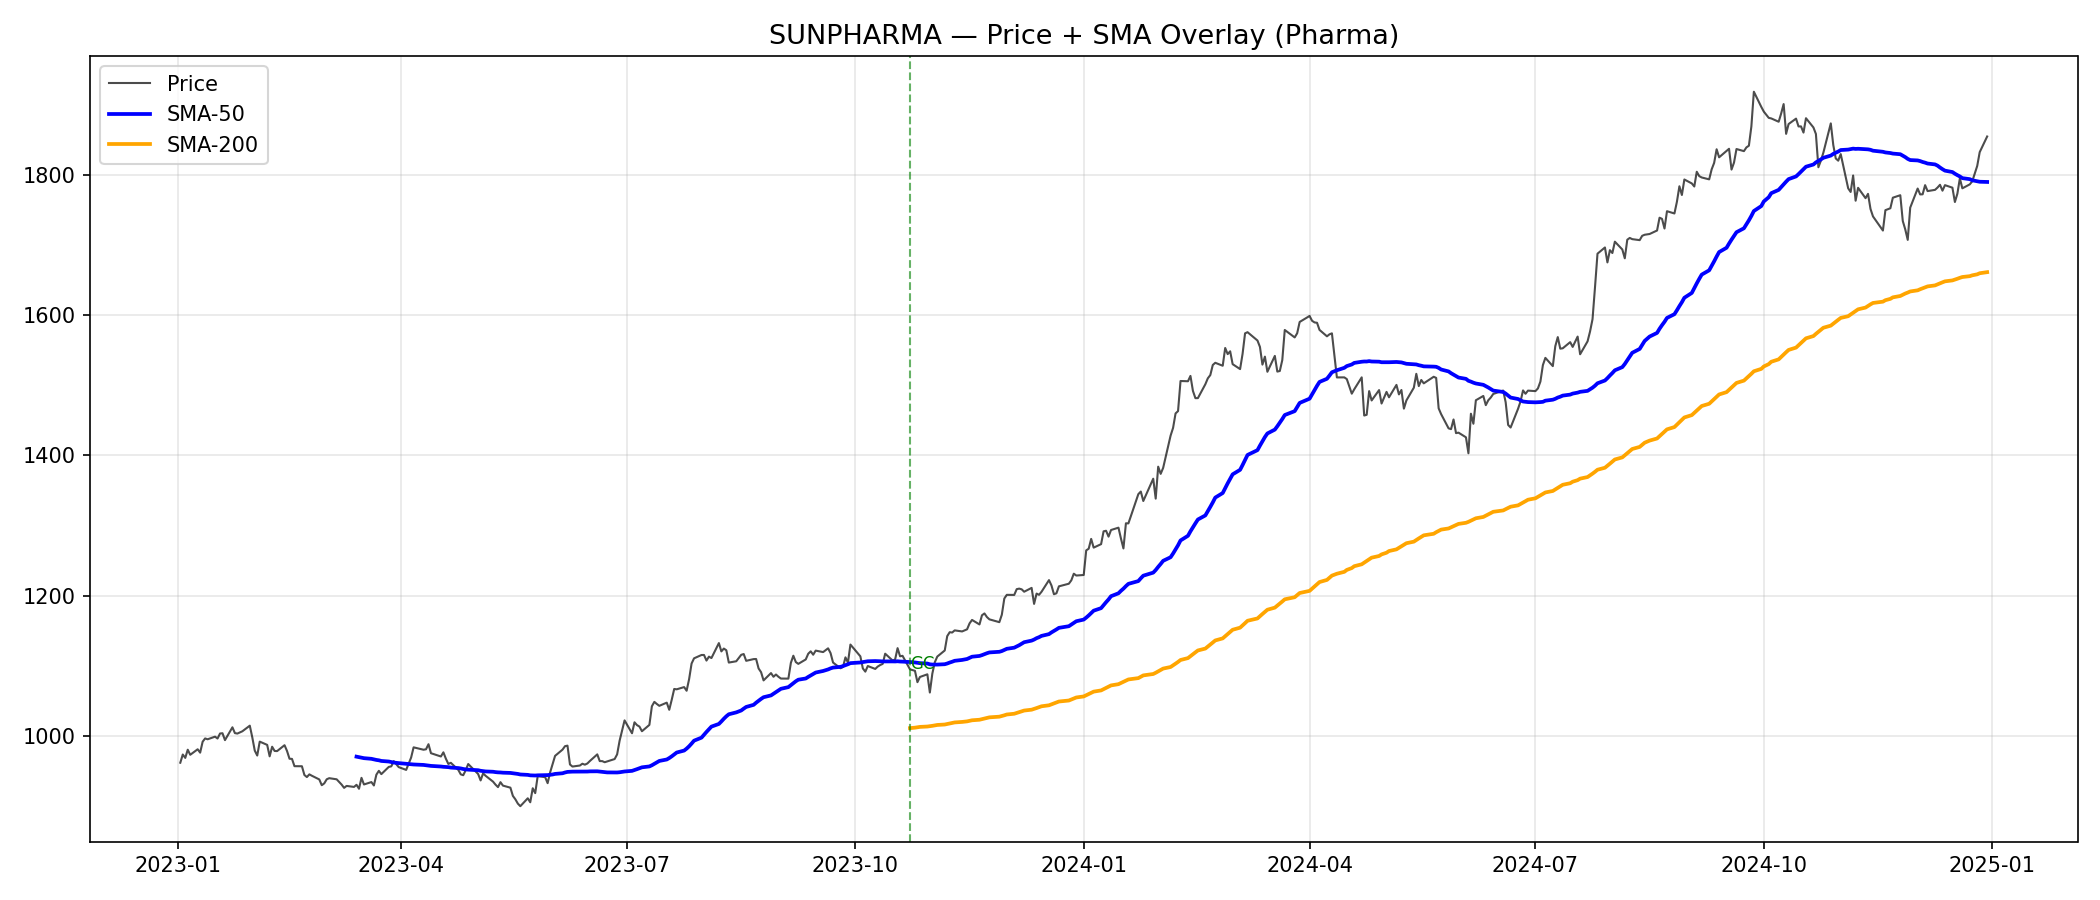
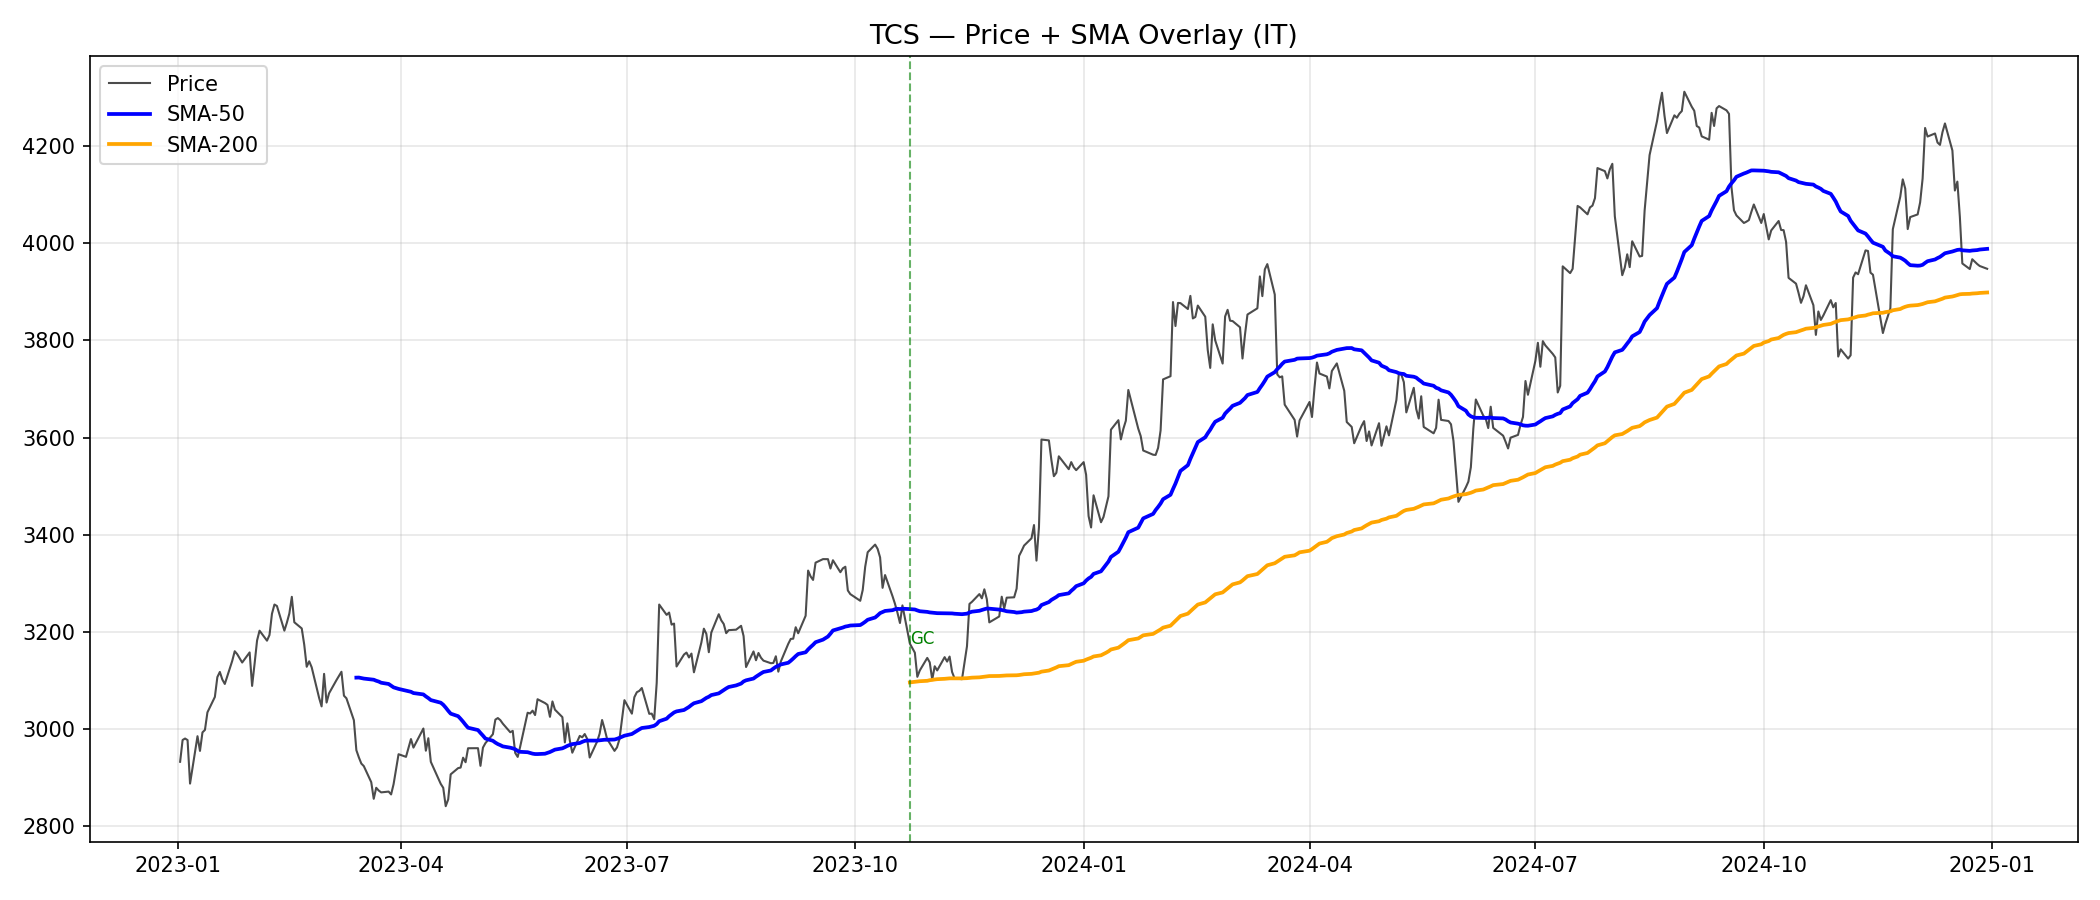
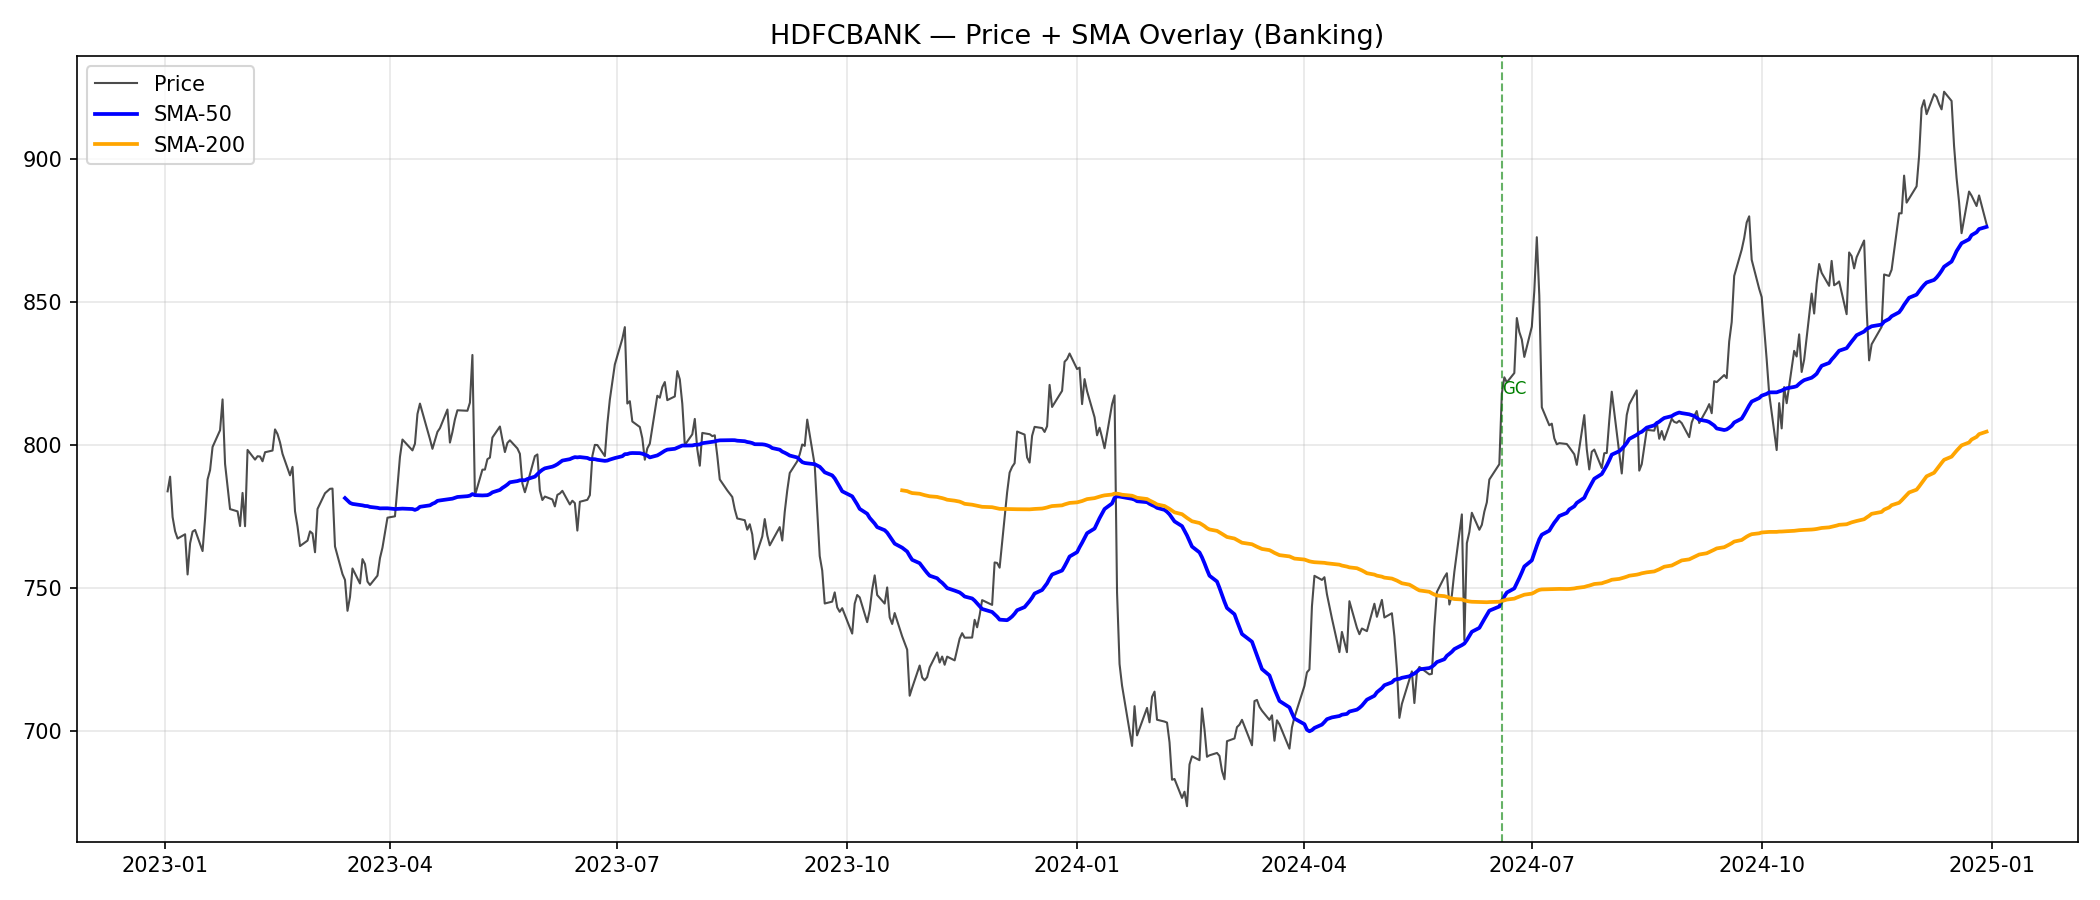
- Task 3: Technical signal dashboard with Golden Cross / Death Cross detection using 50-day and 200-day SMA
- Task 4: Constructed Portfolio A (equal weight) vs Portfolio B (Sharpe-optimised) with sector breakdown
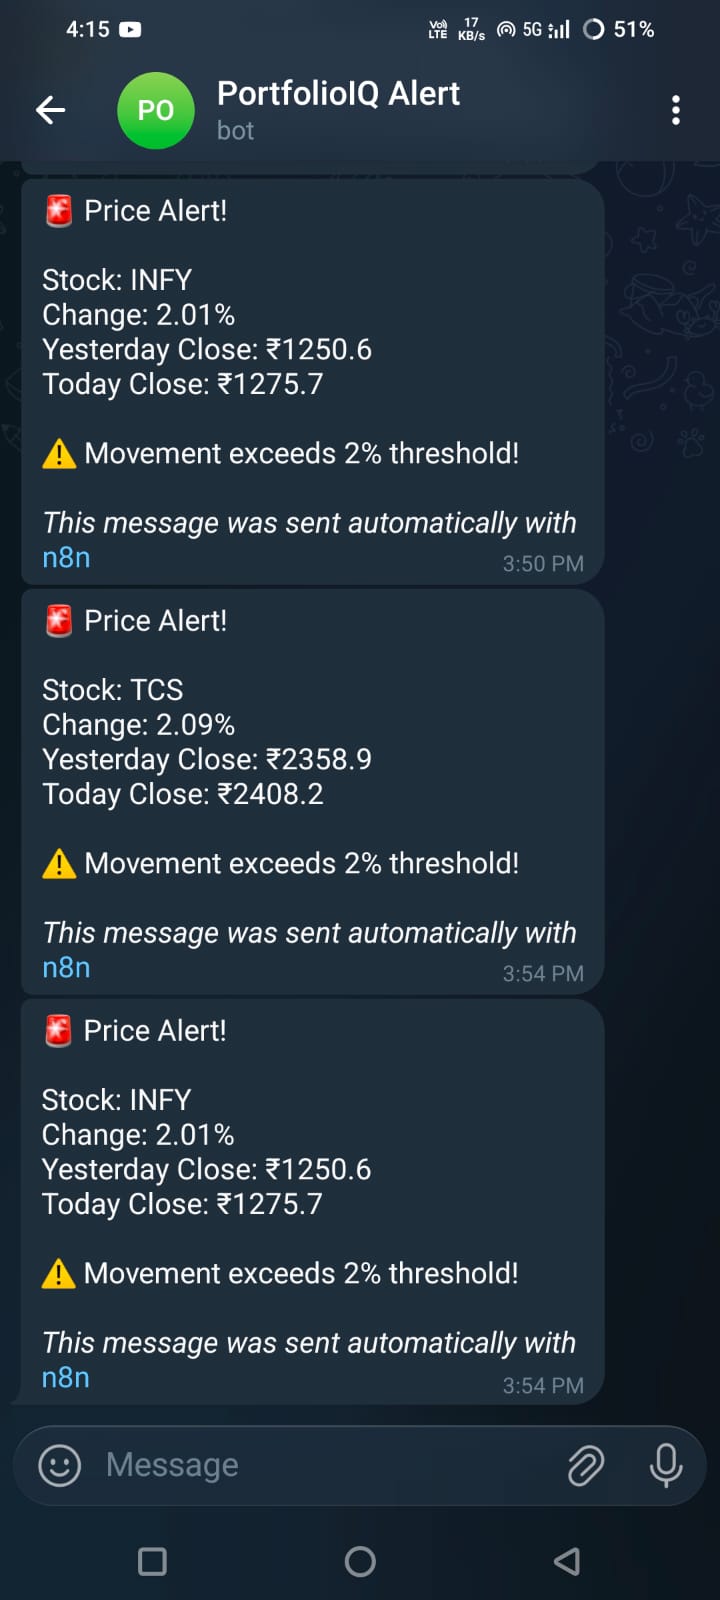
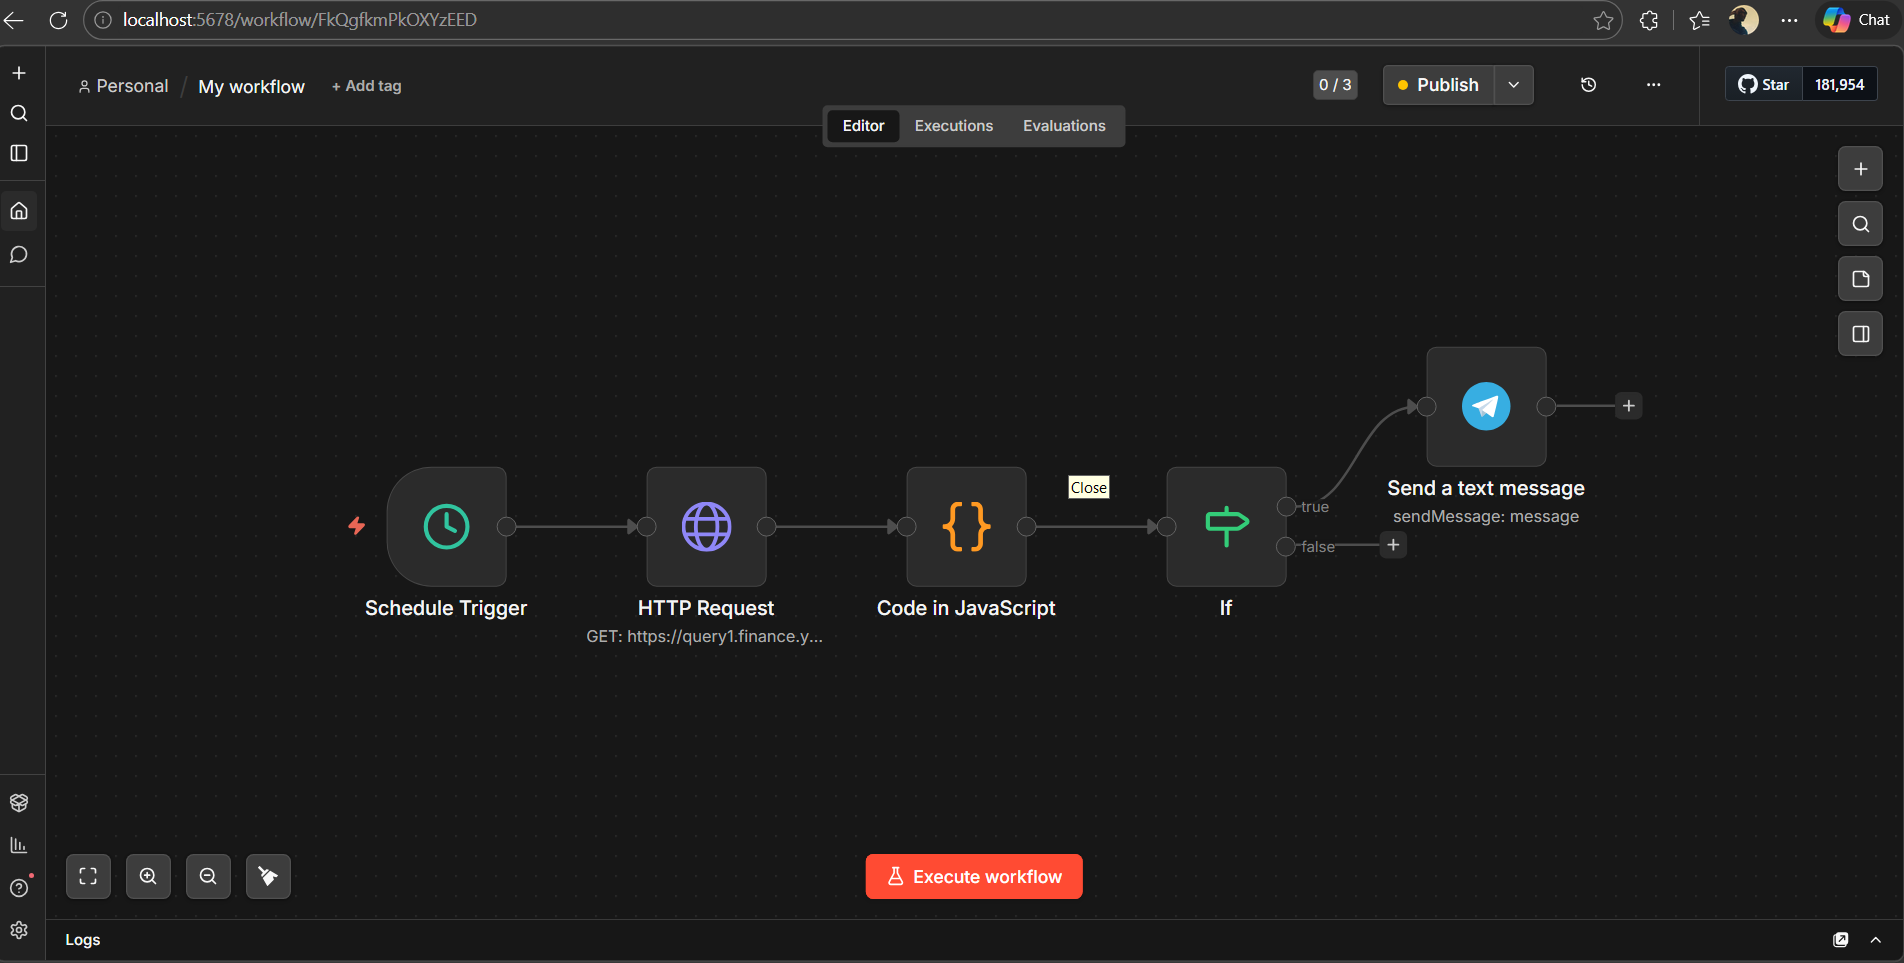
- Task 5: Automated live price alert via n8n → Telegram Bot
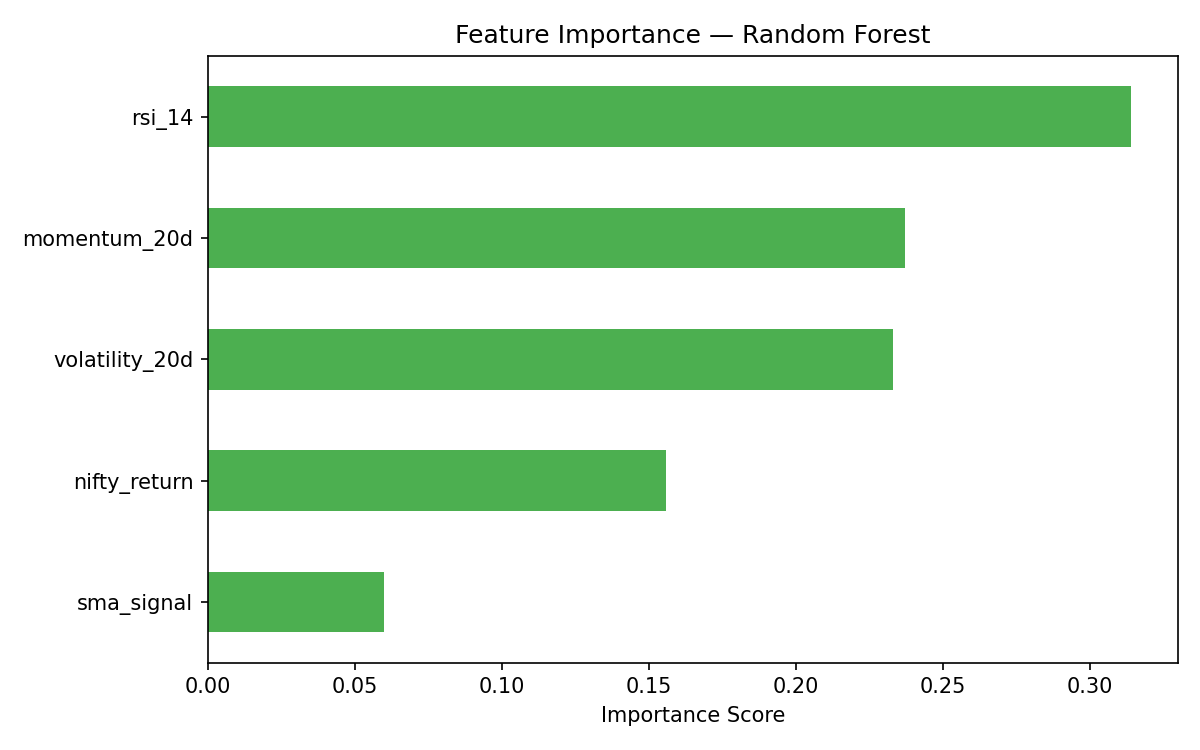
- Task 6: ML classifier (Random Forest vs Gradient Boosting) to predict relative outperformance
Key Results
| Metric | Value |
|---|---|
| Best ML Model | Gradient Boosting (56.3% accuracy) |
| Top ML Feature | RSI_14 (importance: 0.314) |
| Best Sharpe Stock | SUNPHARMA (1.94) |
| Most Exposed (Beta) | SBIN (β = 1.394) |
| Safest Refuge | CIPLA (β = 0.333) |
Stress Test (Chaos Round)
If Nifty 50 drops 10%:
$$\text{Expected Loss} = \beta \times 10\%$$
| Portfolio | Weighted Beta | Expected Loss |
|---|---|---|
| Portfolio A (Equal Weight) | 0.799 | -7.99% |
| Portfolio B (Recommended) | 0.538 | -5.38% |
Portfolio B loses 2.6% less than Portfolio A in a market crash.
Challenges
- Handling missing trading days and NSE market holidays in raw data
- Avoiding data leakage in the ML temporal train/test split
- Building a live n8n workflow that fetches and evaluates 3 stocks in a single Code node without external dependencies
What We Learned
- How Beta truly measures systematic risk, not just volatility
- Why SMA crossovers can be false signals in sideways markets
- How to build reproducible, automated financial pipelines ```
Built With
- csv
- gradient
- json
- matplotlib
- n8n
- numpy
- pandas
- python
- random-forest
- scikit-learn
- seaborn
- telegram-bot-api
- vs-code
- yfinance

Log in or sign up for Devpost to join the conversation.