-
-
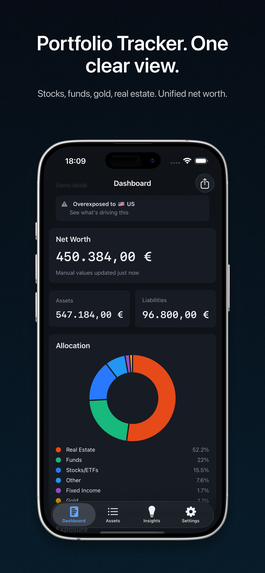
Your whole portfolio in one clear view: net worth, allocation, and exposure in seconds
-
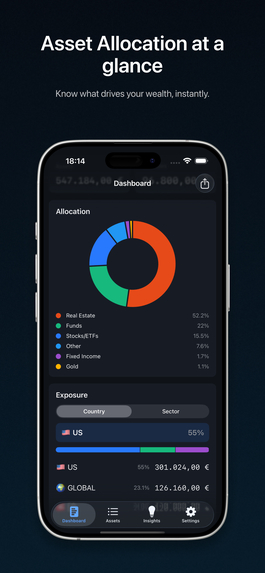
Asset allocation at a glance. Know what drives your wealth without spreadsheets.
-

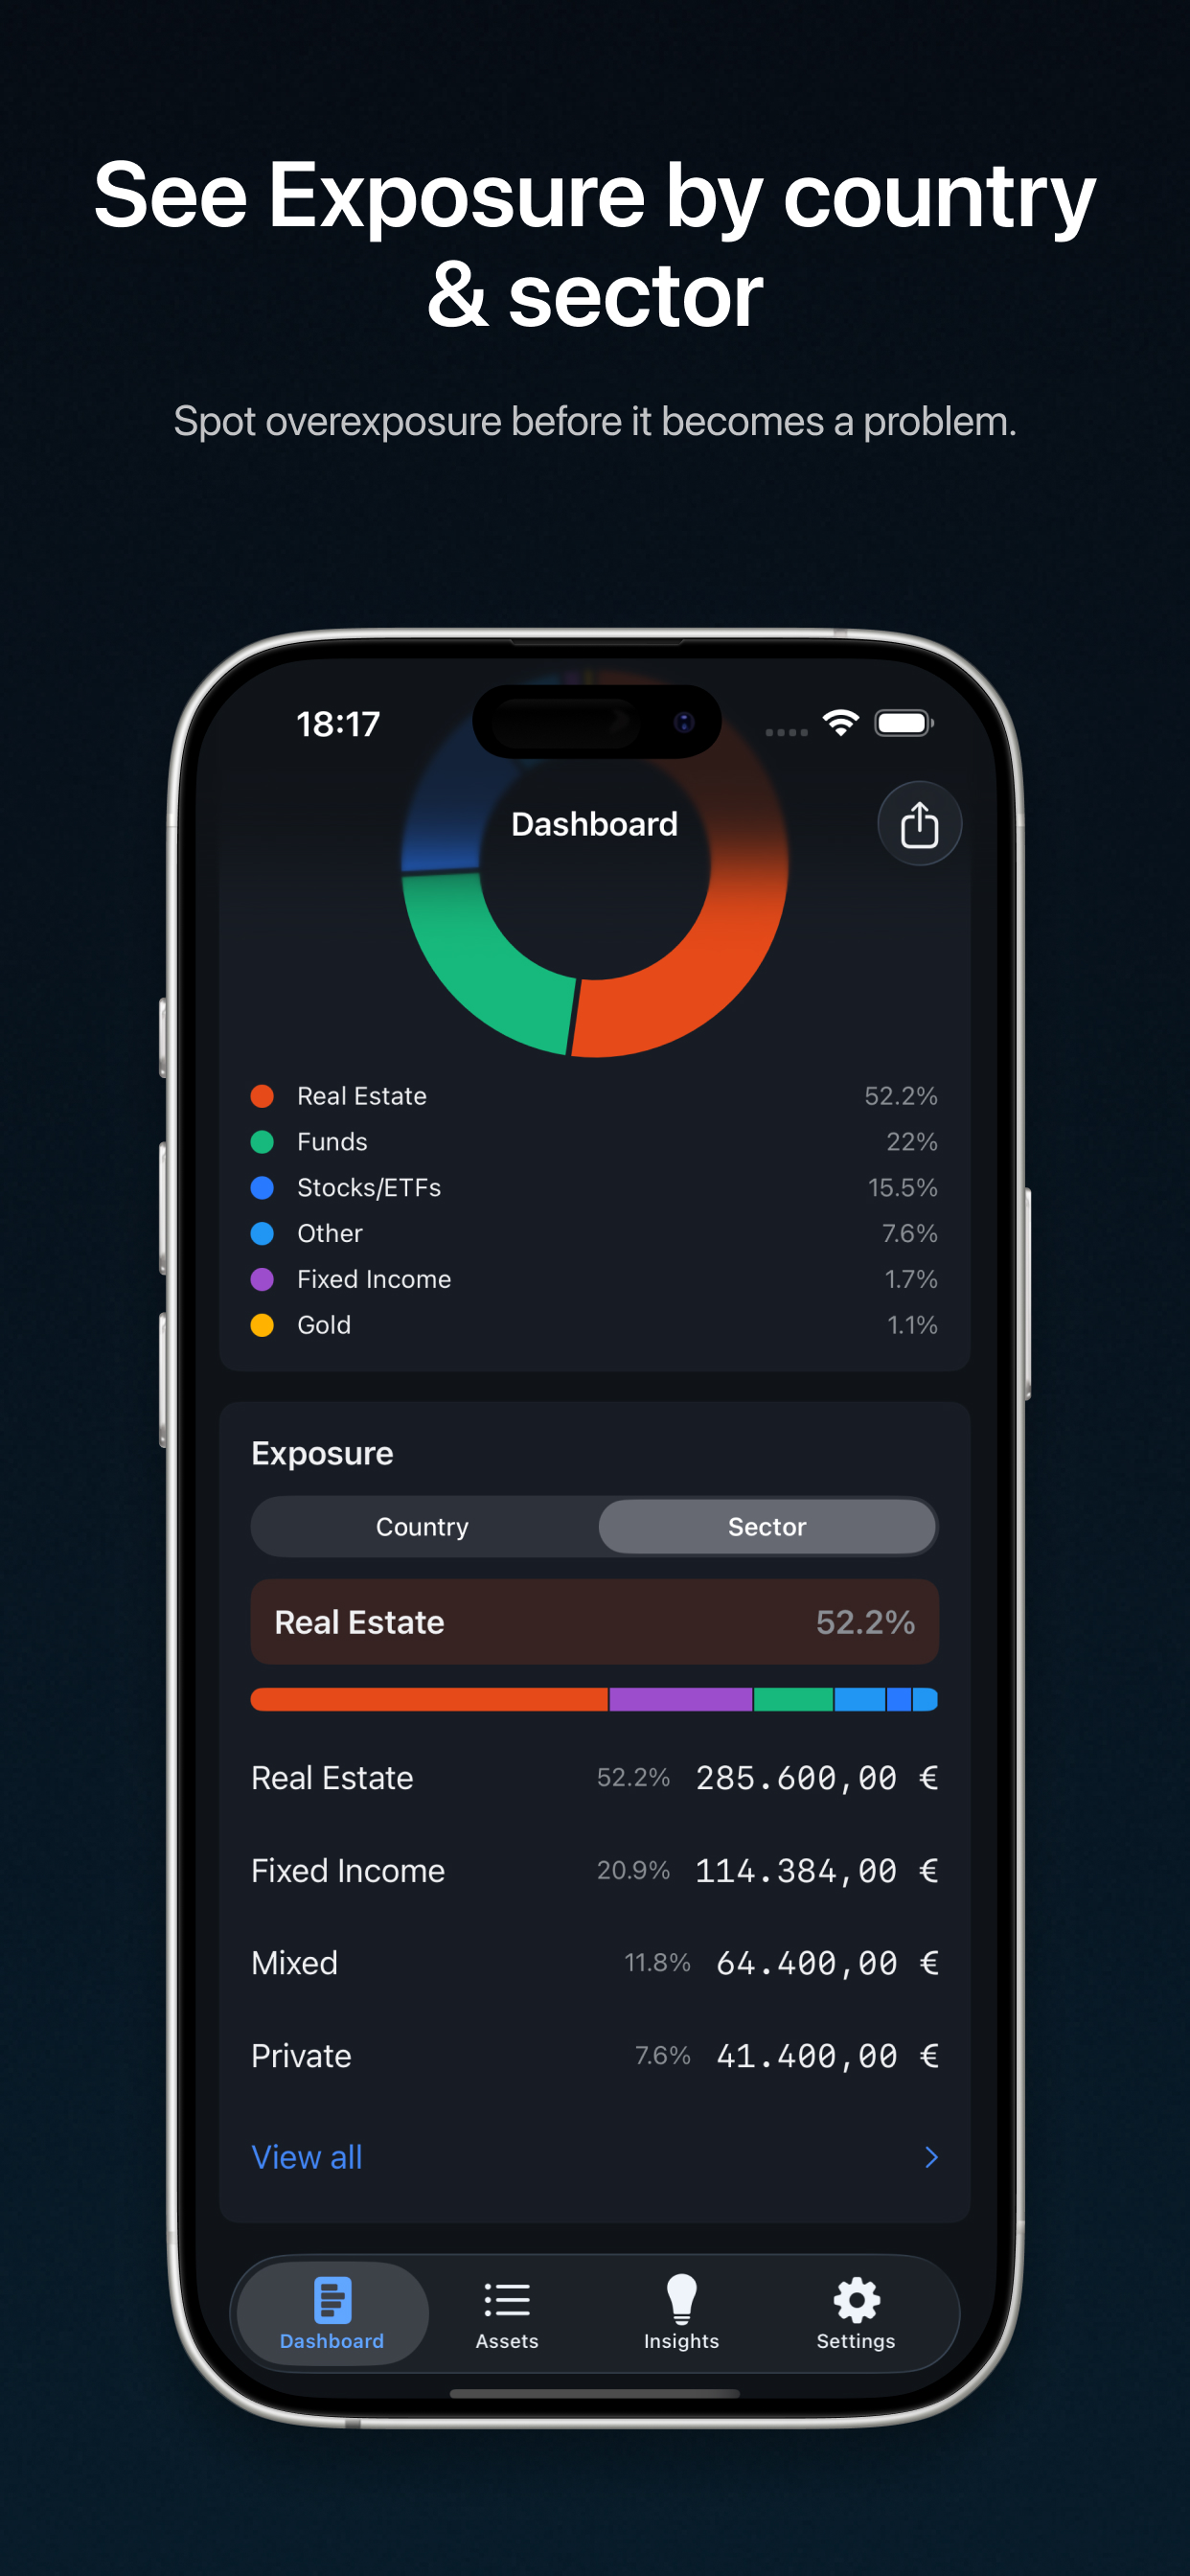
Country and sector exposure made simple. Spot overexposure before it becomes a problem.
-

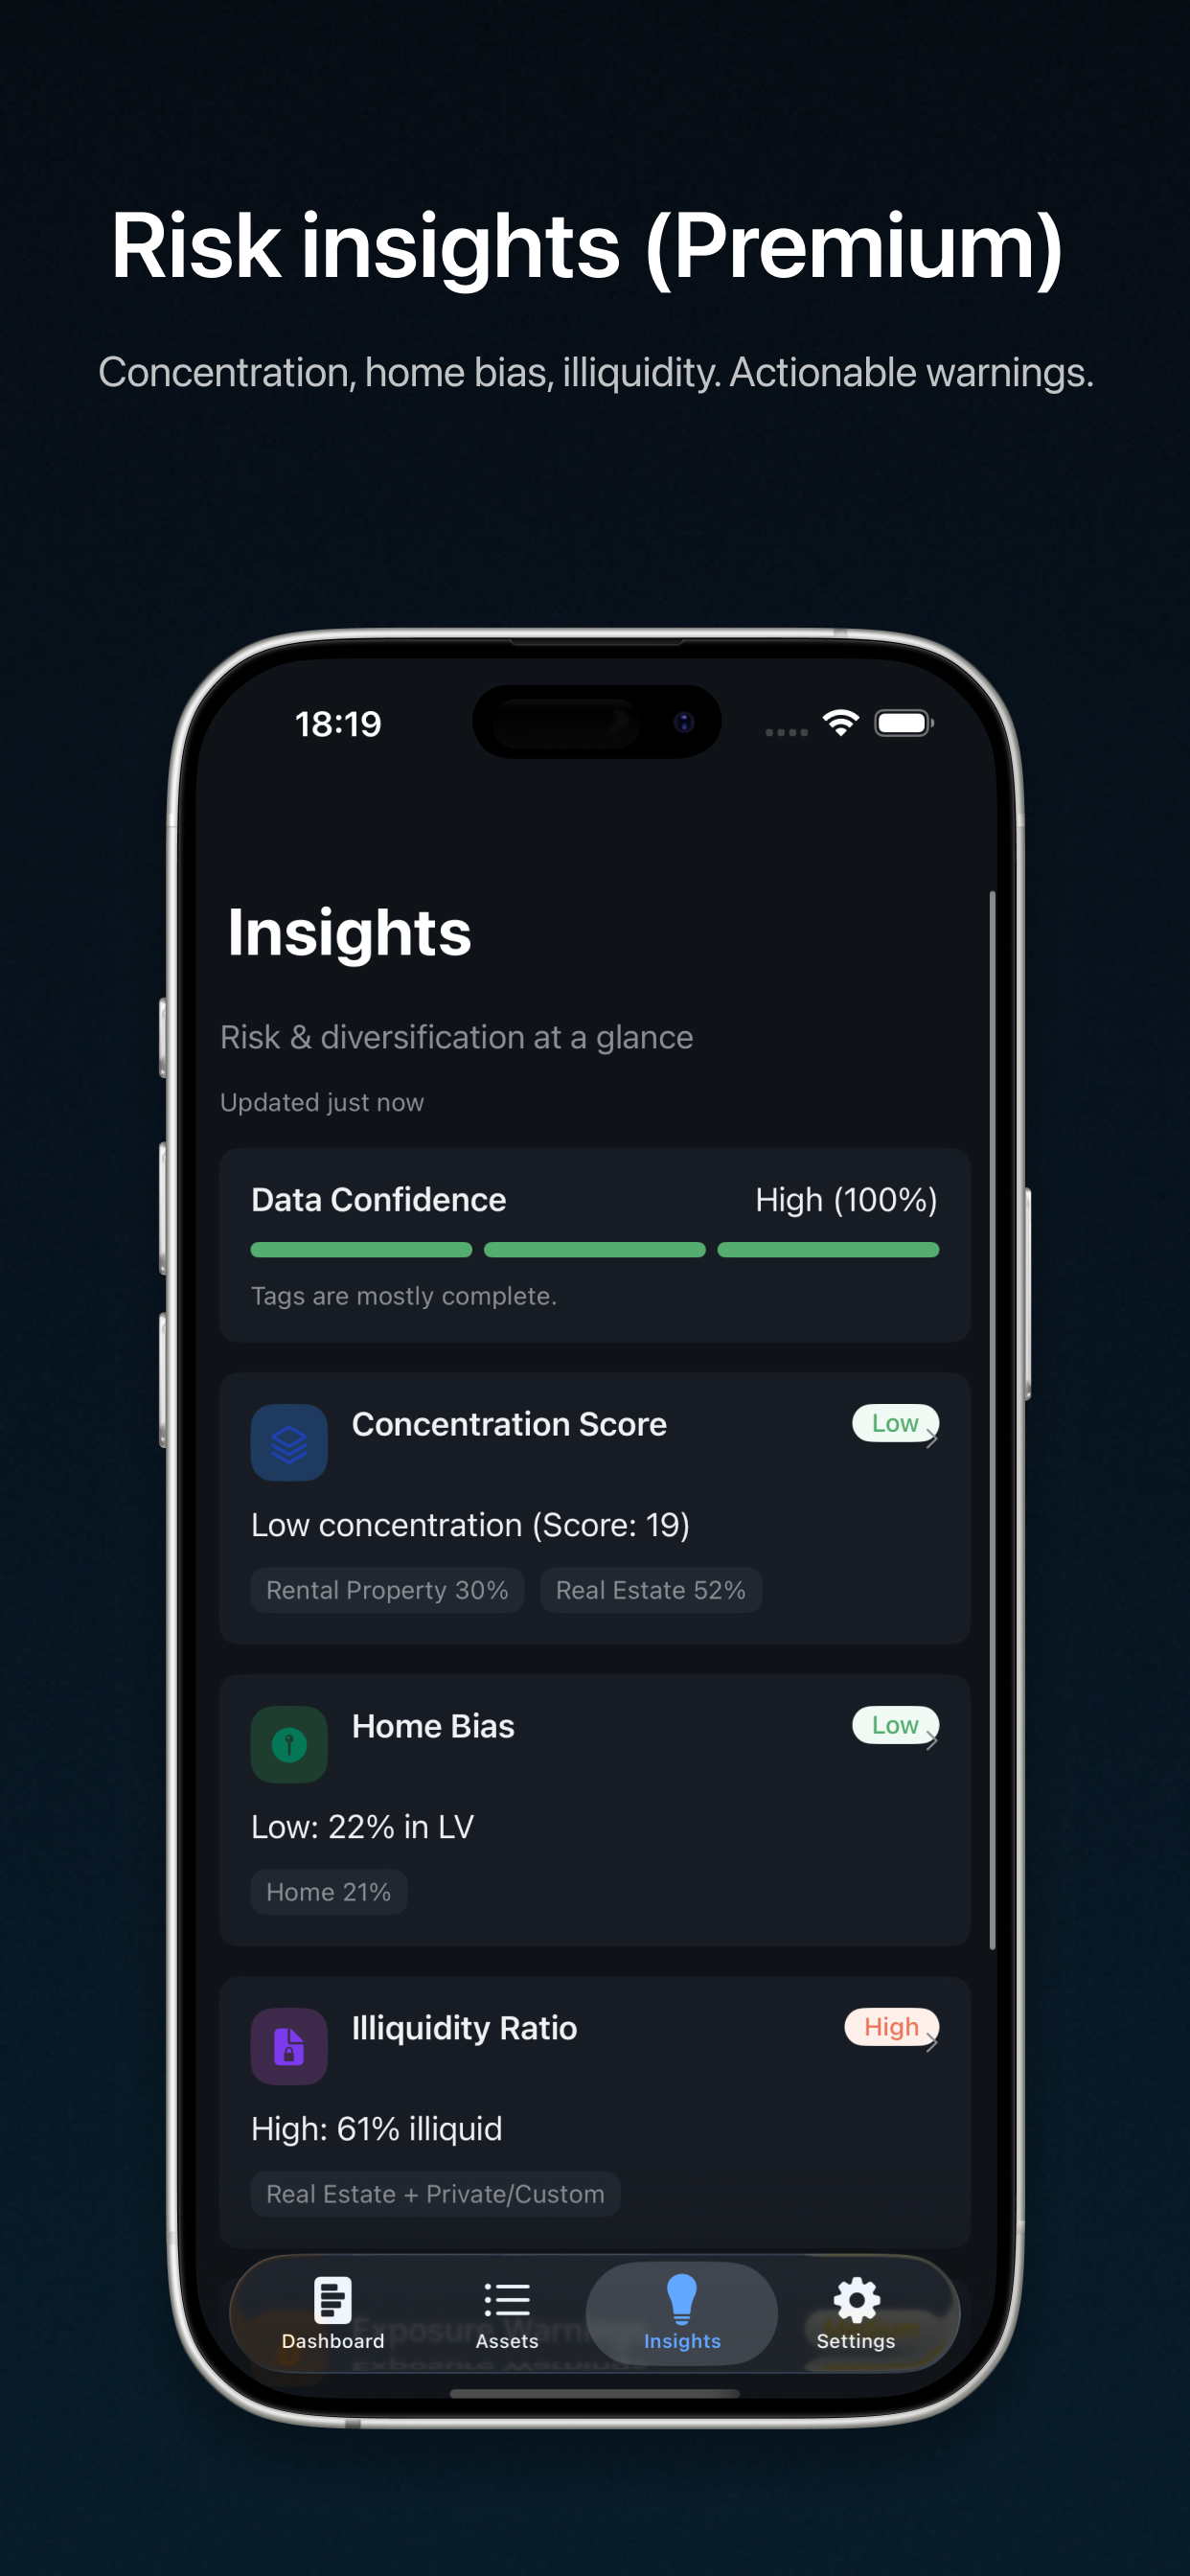
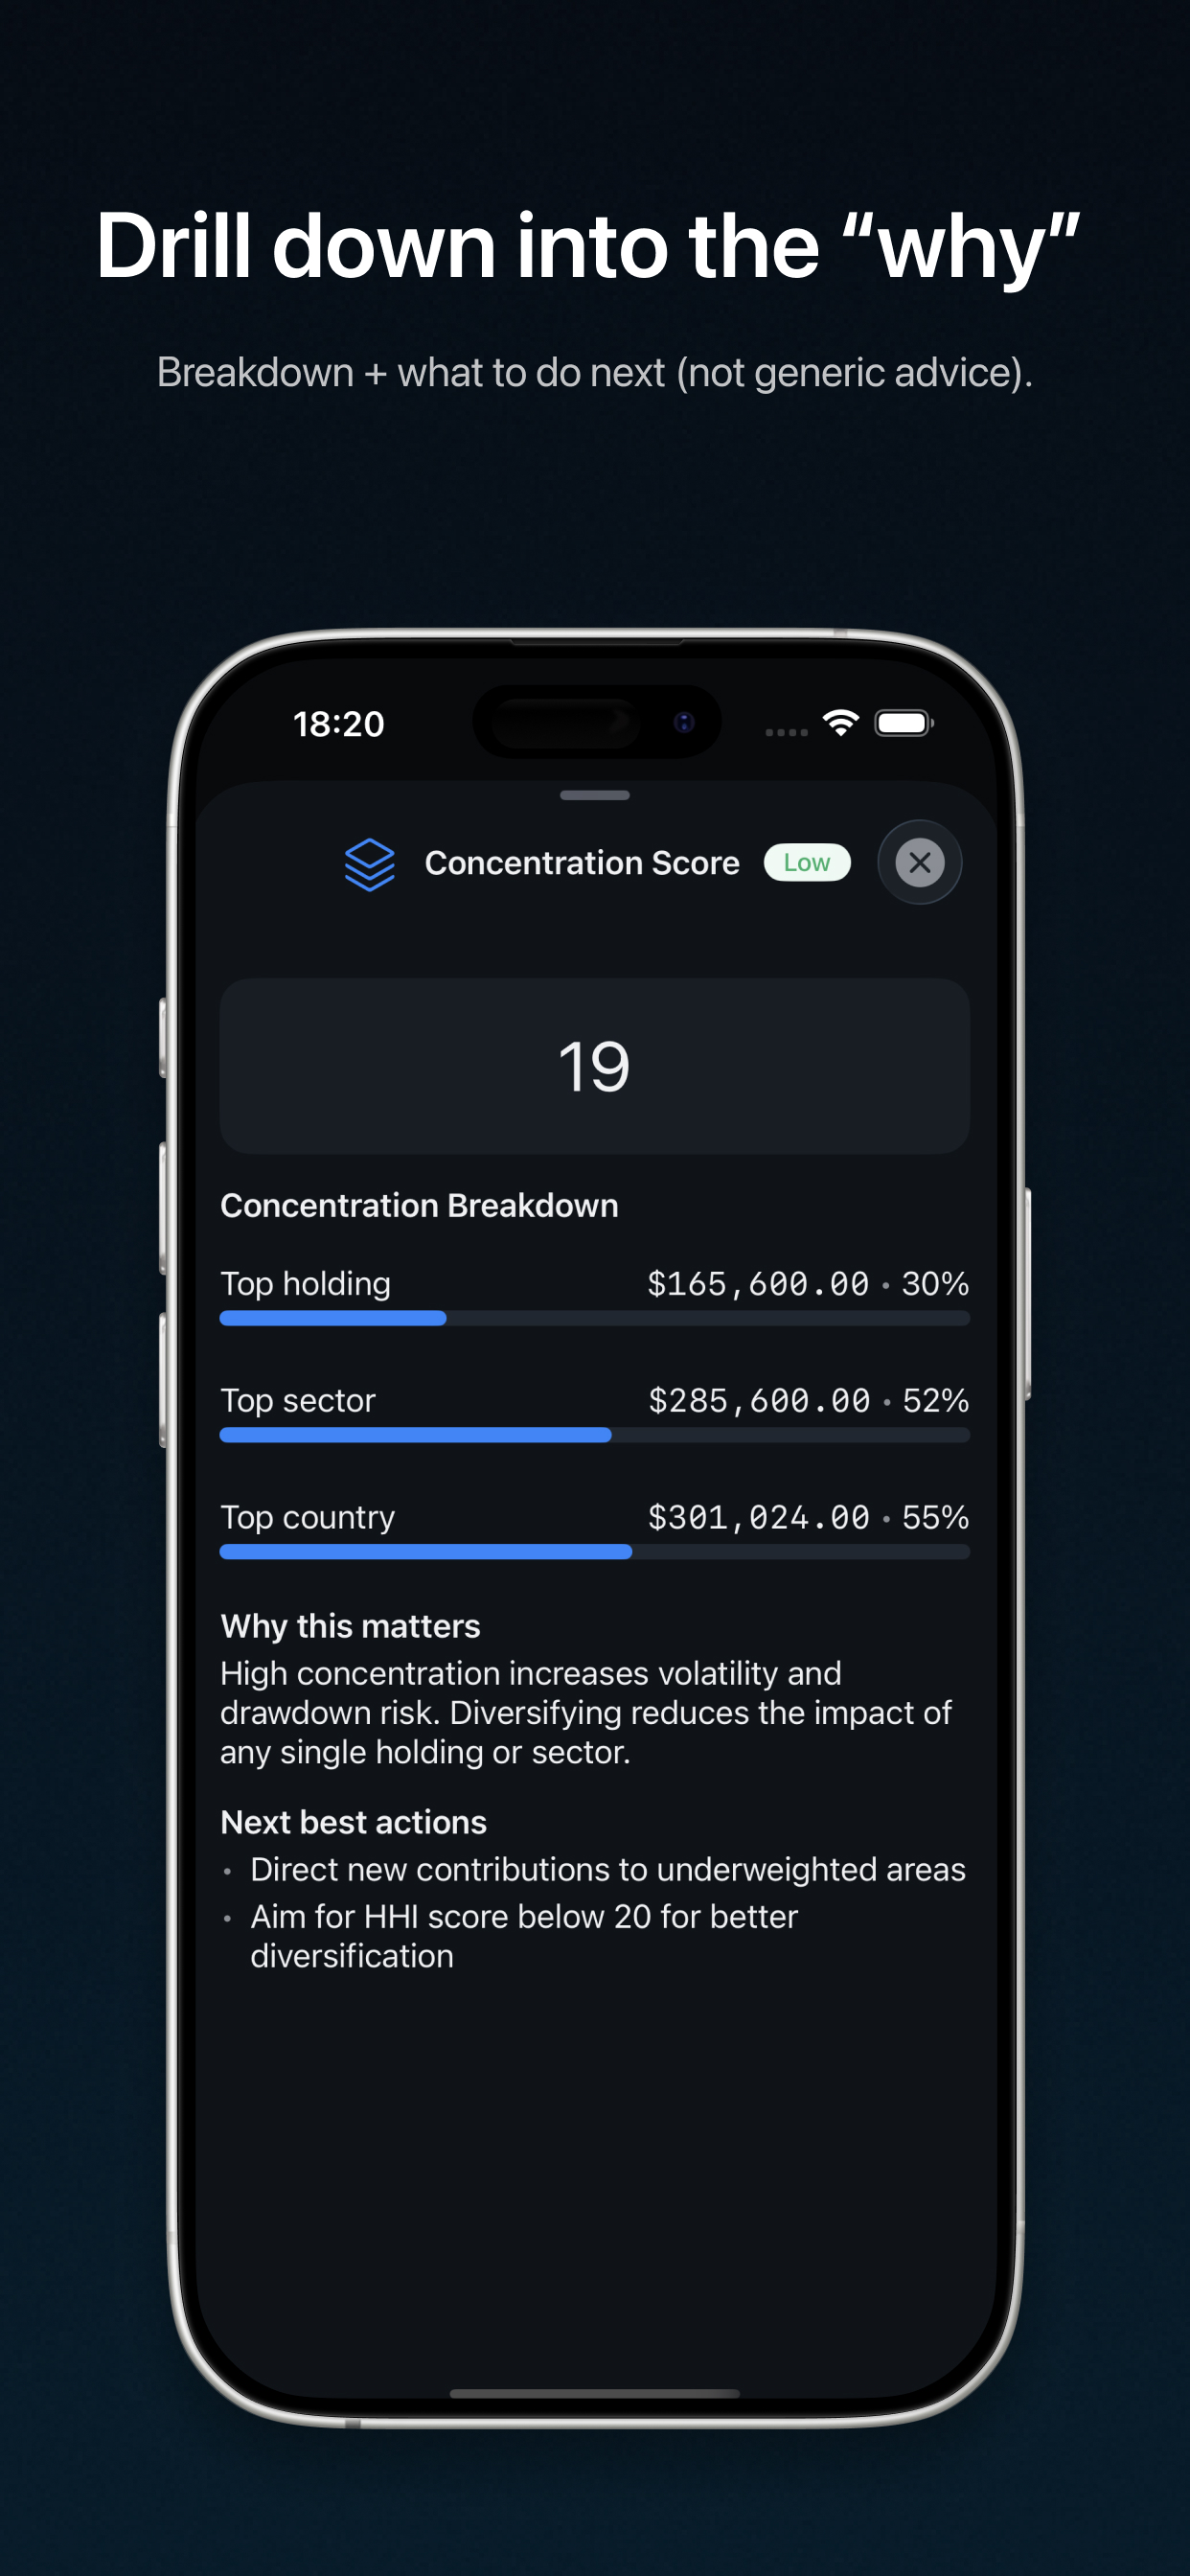
Premium insights: concentration, home bias, illiquidity, and exposure warnings (with clear severity).
-
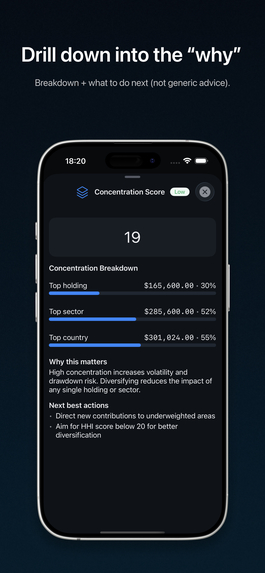
Tap any insight to drill down: key metric, top breakdown, why it matters, and what to do next.
-
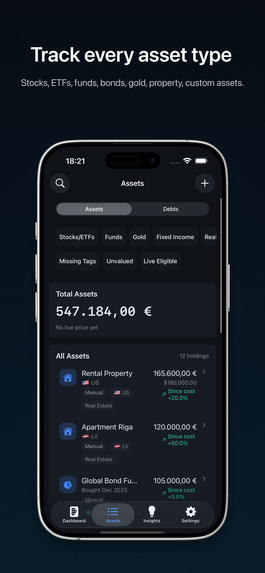
Track every asset type: stocks, ETFs, funds, bonds, gold, real estate, custom assets, and liabilities.
-
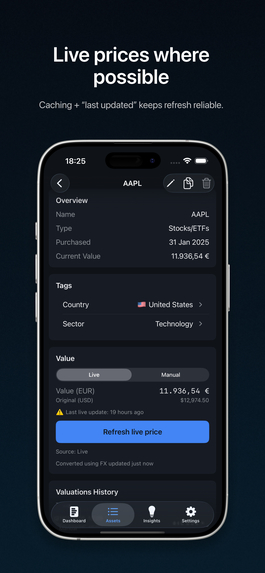
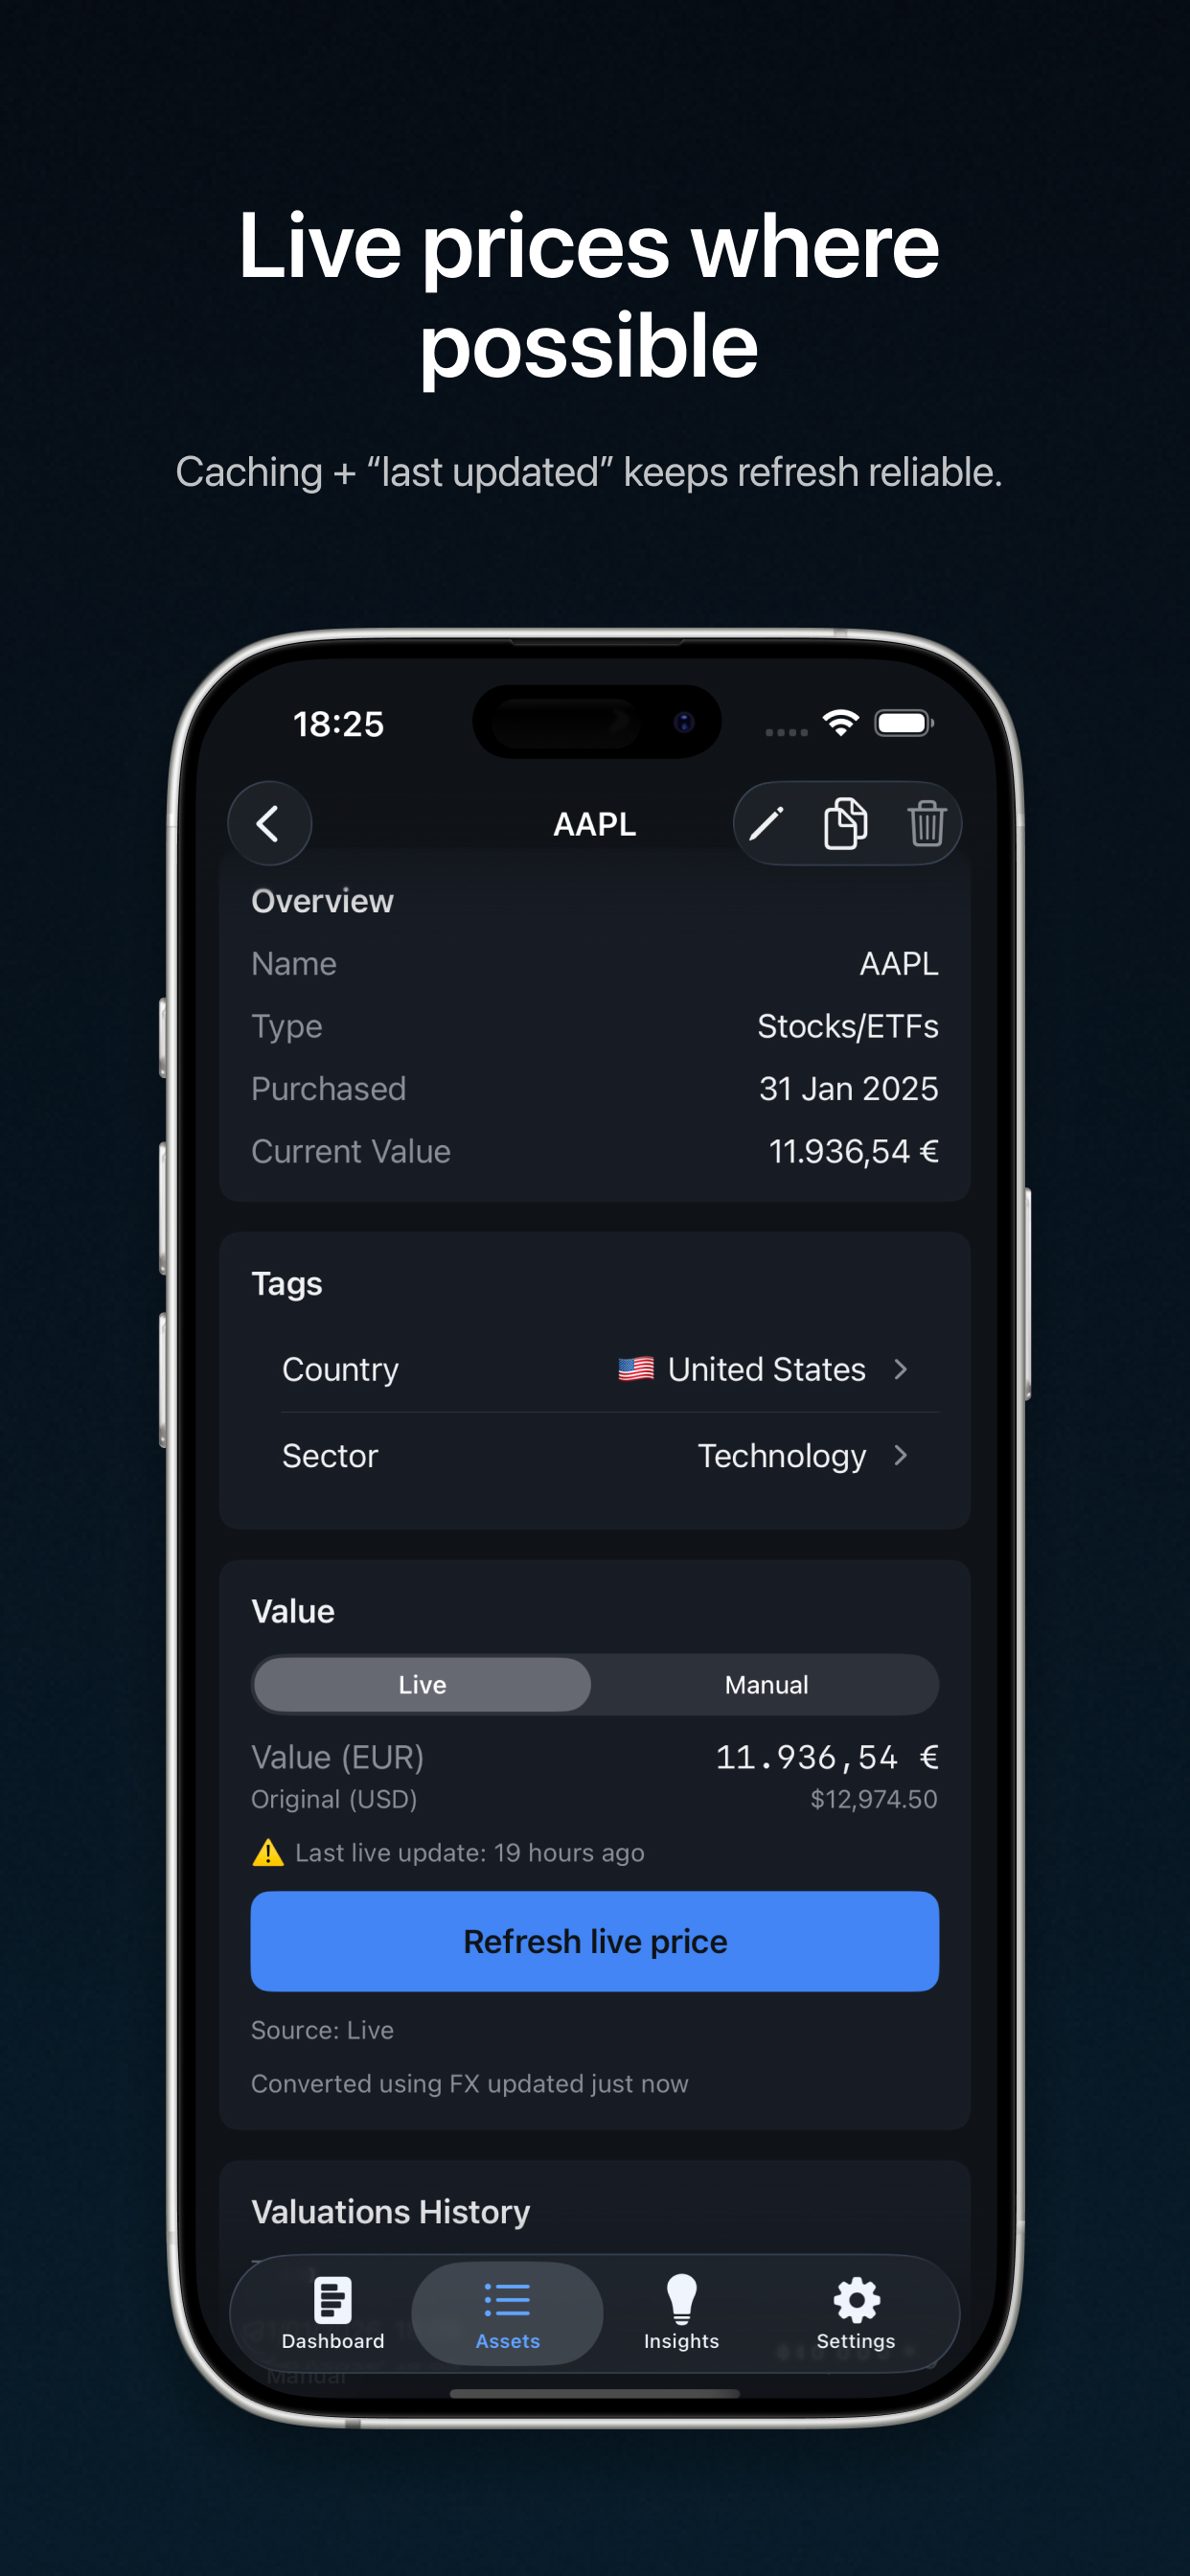
Live prices where possible, manual values where needed. Always see what’s updated and what’s stale.
-
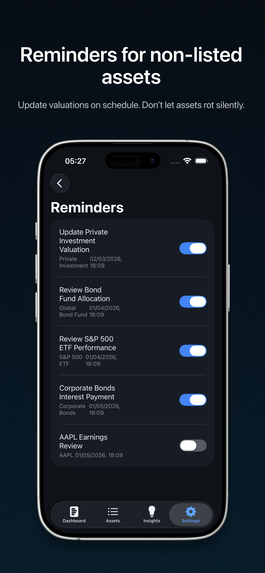
Reminders for non-listed assets: update valuations and stay on top of payments or milestones.


Inspiration
I joined Shipyard because Josh (VisualFaktory) wrote a brief that felt very real: “One portfolio to track them all.”
Today many investors use several brokers and apps. They have stocks, ETFs, funds, gold, bonds, real estate, and sometimes private assets. Everything is spread out, and it’s hard to see the full picture quickly.
I also had a similar idea in my own app backlog. I already built a few finance apps before, and I like this direction. This contest gave me a strong reason to finally build and ship it.
What it does
Portfolio Tracker: X-Ray is a manual-first portfolio tracker for DIY investors with diversified portfolios.
With the app you can:
- Add and track different asset types: stocks/ETFs, funds, gold, fixed income, real estate, and custom assets
- Track liabilities too (like mortgage or loan) to see real net worth
- Get live prices when possible (for listed assets like stocks/ETFs and some funds)
- Use manual values for non-listed assets (real estate, gold, custom)
- Set reminders to update values, so assets don’t get outdated
- See a clean dashboard:
- net worth
- allocation (how your money is split by asset type)
- exposure by country and sector
- overexposure warning if something is too big
- Unlock Premium insights (with subscription) for risk and diversification:
- Concentration Score
- Home Bias
- Illiquidity Ratio
- Exposure Warnings
- Create a shareable “Portfolio X-Ray Snapshot” image with key numbers
How we built it
- Built the app with SwiftUI.
- Used local storage (SwiftData), so the portfolio is saved on the device and works offline.
- Added a pricing service with a provider abstraction, so we can swap providers later if needed.
- Used RevenueCat for subscriptions:
- Free users can track assets and see the dashboard
- Premium users unlock detailed insights and drill-down screens
- Added Demo Mode, so the app can instantly show a good demo portfolio (important for judging).
- Added Firebase Analytics (optional) to understand what users do (onboarding, adding assets, paywall, etc.).
For the math, we tried to keep it simple and understandable. For example, Concentration Score uses a common idea (HHI). It looks like this:
[ HHI = \sum_{i=1}^{n} w_i^2,\quad\text{where } w_i = \frac{V_i}{\sum_j V_j} ]
And we show a score from 0 to 100:
[ Score = 100 \cdot HHI ]
But the main goal is not complex math. The main goal is clarity.
Challenges we ran into
- Multi-asset portfolios are messy. Stocks are easy to price. Real estate and private assets are not. We had to support both, without making the app complicated.
- Currencies can break trust. Many apps exclude assets in other currencies. We wanted everything to work in one base currency with conversion.
- Live pricing reliability. APIs can fail or rate-limit. We made sure the app shows “stale” state calmly and never crashes.
- Paywall UX. Premium must feel valuable, but not annoying. Free version must still be useful.
- Demo polish. For a contest, the app must look clean and work smoothly every time.
Accomplishments that we're proud of
- Fast manual input: adding multiple assets is quick and not painful.
- Dashboard that gives an “I get it” feeling in seconds.
- Premium insights that are clear and practical (not fake finance).
- Shareable snapshot that makes the app memorable.
- A real subscription setup with RevenueCat and working TestFlight build.
What we learned
- Investors don’t need more charts. They need a few clear answers.
- Free vs Premium works best when free is truly useful and Premium is clearly “advanced insights”.
- Most UX improvements come from removing friction:
- fewer required fields
- smart defaults
- good empty states
- Reliability (offline, caching, graceful errors) makes the app feel premium.
What's next for Portfolio Tracker: X-Ray
- Improve onboarding to be more interactive (not only text screens).
- Improve tagging flow (country/sector) to make it faster and nicer.
- Add better suggestions for country/sector tags for known symbols.
- Improve insights explanations and “what to do next” guidance.
- Add more pricing/metadata coverage over time, while keeping the app simple.
The main goal stays the same: give investors one clean picture of their whole portfolio, fast.
Built With
- firebase
- revenuecat
- swiftdata
- swifttesting
- swiftui

Log in or sign up for Devpost to join the conversation.