Inspiration
Every one of us has had the same experience: you hear about a stock, you want to know if it's actually a good investment, and you open the company's annual report. It's 300 pages long. You close it.
So you ask a chatbot instead. You get a confident, nicely written answer, and you have no idea whether any of the numbers in it are real. When we tested this ourselves, we saw models mix up fiscal years, use numbers from before a stock split, and quote revenue figures that didn't appear in any filing. For something as important as where you put your money, "sounds right" isn't good enough.
We wanted to build what a real research team does: read the actual filings, run the numbers properly, argue both sides, and only then give an answer, with receipts for every claim. And we wanted it to answer the question most people actually have: would I do better just buying the S&P 500?
What it does
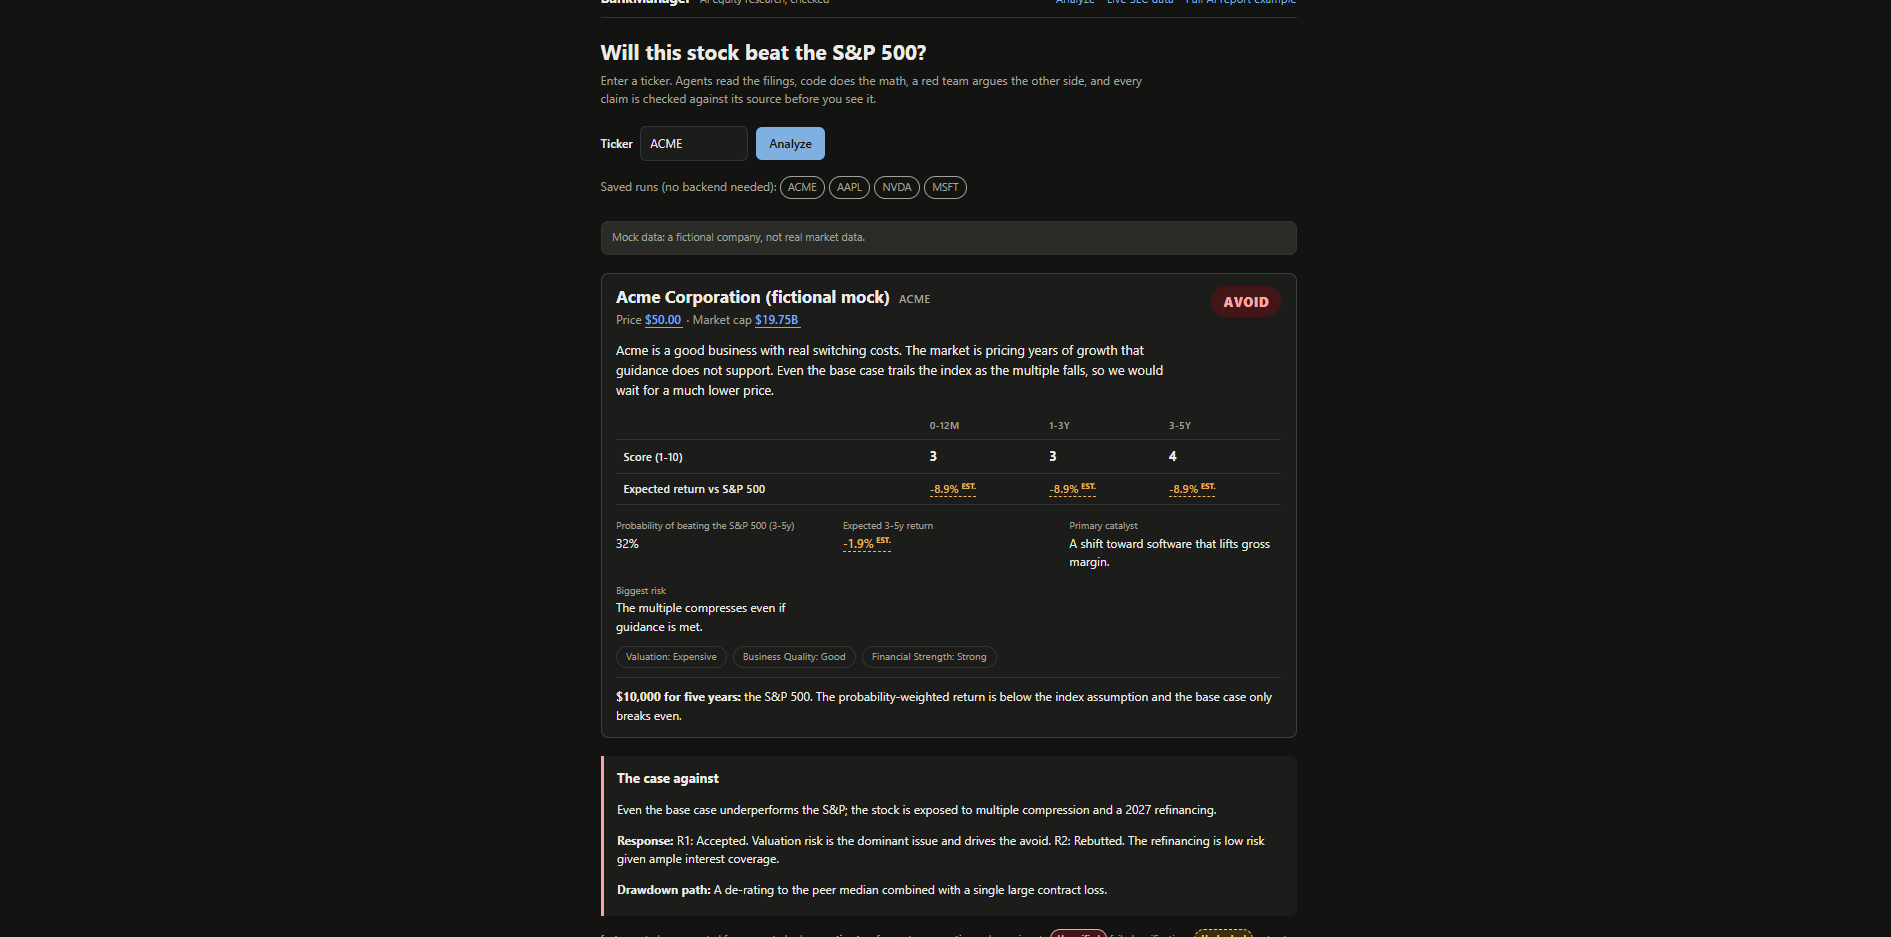
Enter a ticker. The app:
- Pulls the company's real financial data straight from SEC filings (10-Ks, 10-Qs, and XBRL data), plus the current price.
- Computes every metric in code: free cash flow, margins, growth, valuation multiples, a peer comparison, and a reverse DCF showing what growth the market is pricing in.
- Runs a team of AI analyst agents (Financial, Business, Valuation, and Scenario) that interpret those numbers but never calculate them.
- Unleashes a Red Team agent whose only job is to argue the bear case from the raw facts, and a Synthesizer that has to answer the Red Team point by point.
- Audits every claim before you see it. Every number must trace back to a specific fact from a specific filing, and anything that can't be verified is flagged instead of hidden.
- Gives a verdict across three horizons (0–12 months, 1–3 years, 3–5 years): expected return versus the S&P 500, the probability of beating it, and the biggest catalyst and risk.
Click any number in the report and it opens the SEC filing it came from.
How we built it
We split the system into three partitions so the three of us could build in parallel without stepping on each other:
- Data & MCP server. We built a financial "truth layer": every number is stored as a normalized fact with its source filing, accession number, period, and filing date. It's exposed to the agents through an MCP server with tools like
get_financial_facts,get_market_snapshot,search_filing, andresolve_fact. The agents never touch raw data; they can only ask the server. - Calc & audit. A pure Python library computes every metric and valuation, and each result records exactly which facts it was computed from. The audit layer checks the agents' claims against those facts.
- Agents, orchestrator & web. The orchestrator plans the research, runs the agents (independent ones in parallel), routes failed audits back to the agent responsible, and assembles a structured research object. The report is rendered from that object, never from free-form model text. The frontend is Next.js.
Shared contracts (Pydantic models exported to JSON Schema) define every boundary between the partitions, with contract tests enforcing them.
Our core design principle: code computes, the LLM interprets. No agent ever does arithmetic. Scenario probabilities, for example, aren't simply guessed by the model. They start from a base-rate prior, and the agents can only shift them within a hard cap:
$$ E[\text{return}] = P(\text{bear})\,R_{\text{bear}} + P(\text{base})\,R_{\text{base}} + P(\text{bull})\,R_{\text{bull}} $$
Every data query is also point-in-time: it only sees facts filed on or before its as_of date. That stops the analysis from accidentally using information that didn't exist yet, and it means the same pipeline can be run historically.
Challenges we ran into
SEC data is messier than we expected. "Revenue" isn't one thing in XBRL. Apple changed its revenue tag in 2018. NVIDIA reports capex under one tag for some years and a different tag for others. Banks report revenue net of interest expense, and when we took the first matching tag for Capital One, we got $8.1B instead of $53.4B. We ended up building fallback chains that resolve per fiscal period, not per company.
Stock splits broke our growth rates. NVIDIA's 10-for-1 split was applied retroactively to recent years, but its FY2022 figures were never restated. The raw data made NVIDIA's EPS look like it collapsed and recovered. We built a detector for share-count discontinuities and generate split-adjusted values only when the filing itself reports the split ratio.
Share classes gave us market caps off by 1,500×. Berkshire Hathaway's reported share count covers only Class A shares. Both SEC data and our market data provider got it wrong the same way, so we added a sanity check against public float and a fallback that covers both classes.
Annual data made multiples stale. Our first P/E for Apple was 45×, while every finance site said about 36×. We were using the last full fiscal year while everyone else uses trailing twelve months, so we added TTM calculation from quarterly filings:
$$ \text{TTM} = \text{FY} + \text{YTD}{\text{current}} - \text{YTD}{\text{prior}} $$
Even that had a trap: Microsoft filed its annual report after its quarterly report for a quarter the annual already contained, so our first version counted nine months twice.
Parsing 10-Ks is brutal. Microsoft's filings letter-space their headings ("B USINESS"), JPMorgan cross-references "Item 1A" deep in the document, and every table of contents repeats each heading. We had to match on whitespace-stripped text and verify that we'd found the real section, not a reference to it.
Coordinating three people on one architecture. Midway through, one partition's branch turned out to be based on an outdated version of the project, and merging it would have silently made its code unreachable. We had to port the work instead of merging it, which taught us to integrate early.
What we learned
- LLMs are great at judgment and bad at bookkeeping. Once we stopped asking the model to do math and started asking it to interpret verified numbers, the output got dramatically more trustworthy.
- Provenance is a feature, not overhead. Tracking where every number came from felt like extra work at first. It ended up being what made the whole thing debuggable, and it's the part people react to most in the demo.
- Real data beats test data. Nearly every bug on the list above passed our tests on fictional data and only surfaced when we pulled real filings.
- An adversarial agent keeps the system honest. Without the Red Team, the agents drifted toward optimistic conclusions. Forcing a response to the strongest bear case made the verdicts more balanced.
What's next
- Connecting the 10-K text extraction to the Business and Competitive analysis agents (the extraction is built; it isn't wired into the live pipeline yet)
- Support for foreign companies filing 20-Fs under IFRS
- Backtesting verdicts against historical returns, which our point-in-time design already makes possible
- Hosting the backend so anyone can analyze any ticker on demand
Built With
- anthropic-api
- claude
- claude-code
- data
- fastapi
- finnhub
- frameworks
- github
- github-actions
- infrastructure
- json-schema
- lxml
- model-context-protocol
- multi-agent-systems
- next.js
- node.js
- pydantic
- pytest
- python
- react
- sec-edgar
- sources
- tools
- typescript
- xbrl

Log in or sign up for Devpost to join the conversation.