-
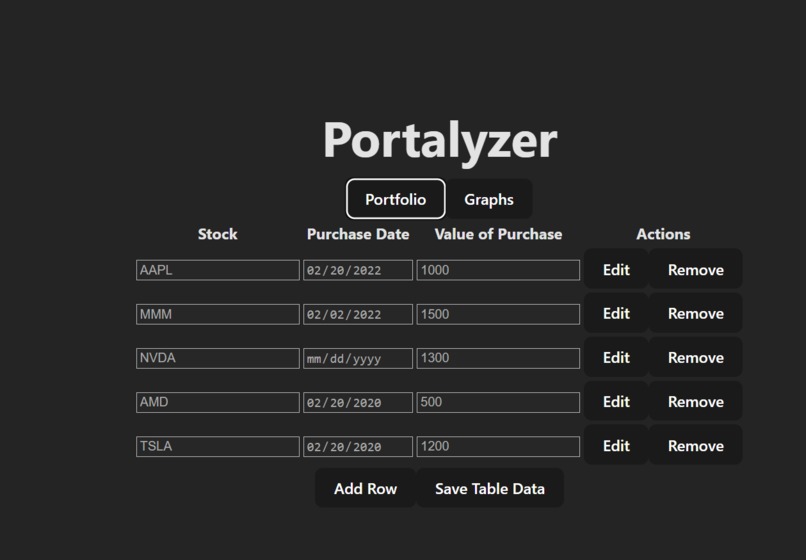
Portfolio Input Page
-
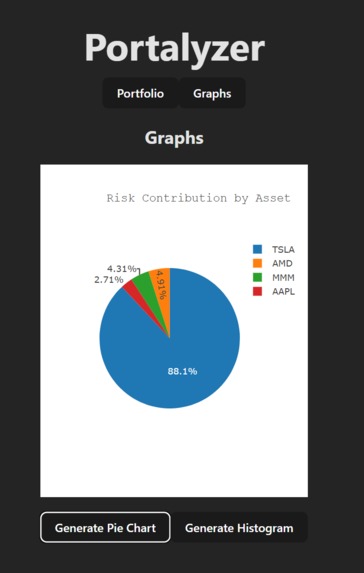
Pie Chart of Risk Assessment
-
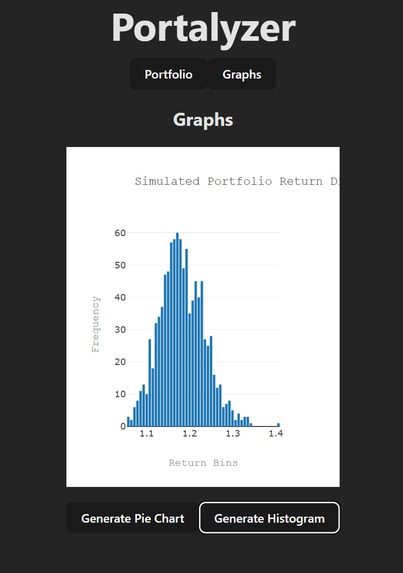
Histogram of Frequency and Returns


Inspiration
Some of our team, as well as fellow friends and family, invested in stocks which, in recent times, have been incredibly volatile. Thus, we wanted to make something that could help friends and family gain some more insight into the risk assessment of the stocks through a simple, intuitive interface with the data being showed in easy to understand graphs.
What it does
Many people wish they could see the risks of each of their stocks in case of these events, as well as stress testing for these sorts of abnormal market conditions. Thus, Portalyzer takes in stock information (currently limited to the S&P 500) from the user through manual input, and generates graphs that analyze the risk of their portfolio. The pie chart displays the percentage of risk due to each equity in the portfolio. The histogram displays the expected returns for the next trading year over 1000 simulations. This allows the user to see the probability that their portfolio achieves a target return value, and the value at risk, the maximum loss at 95% confidence.
How we built it
Our team built a full-stack web application with a React frontend and a Python backend.
Challenges we ran into
This was the first hackathon for everyone on our team, as well as the first time for most of us, so we all had very little experience working on a full-stack web application with a team. After the brainstorming, we initially had an idea, but we jumped into it too quickly and didn't build a solid and simple foundation that we could add more features to. This resulted in a complex system that we didn't understand very well, making it difficult to debug and identify issues. It was also the first time all of us used React, so there was a large learning curve. We especially struggled with integrating the frontend to the backend, resulting in many issues with fetching the analysis that we did in the backend.
Accomplishments that we're proud of
We're proud of actually having a finished product that (sort-of) works accurately and expectedly (most of the time). We faced a lot of challenges in choosing a team of 4 from 5 people, choosing a topic, getting started with the idea, and building the website itself, because none of us had any experience in full-stack and, more importantly, frontend. So we're really proud of getting the backend Python script connected with the frontend React script.
What we learned
Most of all, we learned how to make a dynamic website using React and connect it to a Python script backend, which saved data using a text file, along with gathering data using an API and a CSV matrix.
What's next for Portalyzer
Better UI/UX. Expand to include more stocks not in the S&P 500. Expand the simulation to consider as well as analyze more variables and data. Integrate an API that includes live stock information.


Log in or sign up for Devpost to join the conversation.