Porolytics - AI-Powered League of Legends Opponent Analysis
Inspiration
Competitive League of Legends preparation still relies heavily on VOD reviews, intuition, and scattered statistics. Coaches can feel how an opponent wins, but struggle to prove it quickly and translate it into clear, actionable strategies.
We were inspired by a simple coaching question:
"Before the game even begins, tell us how this team actually wins, what they repeat, what they rely on, and what breaks them."
We wanted to turn raw esports data into a concise, explainable opponent playbook that coaches can actually use.
What it does
Porolytics is an AI-powered scouting platform for League of Legends that analyzes professional match data and generates actionable opponent intelligence.
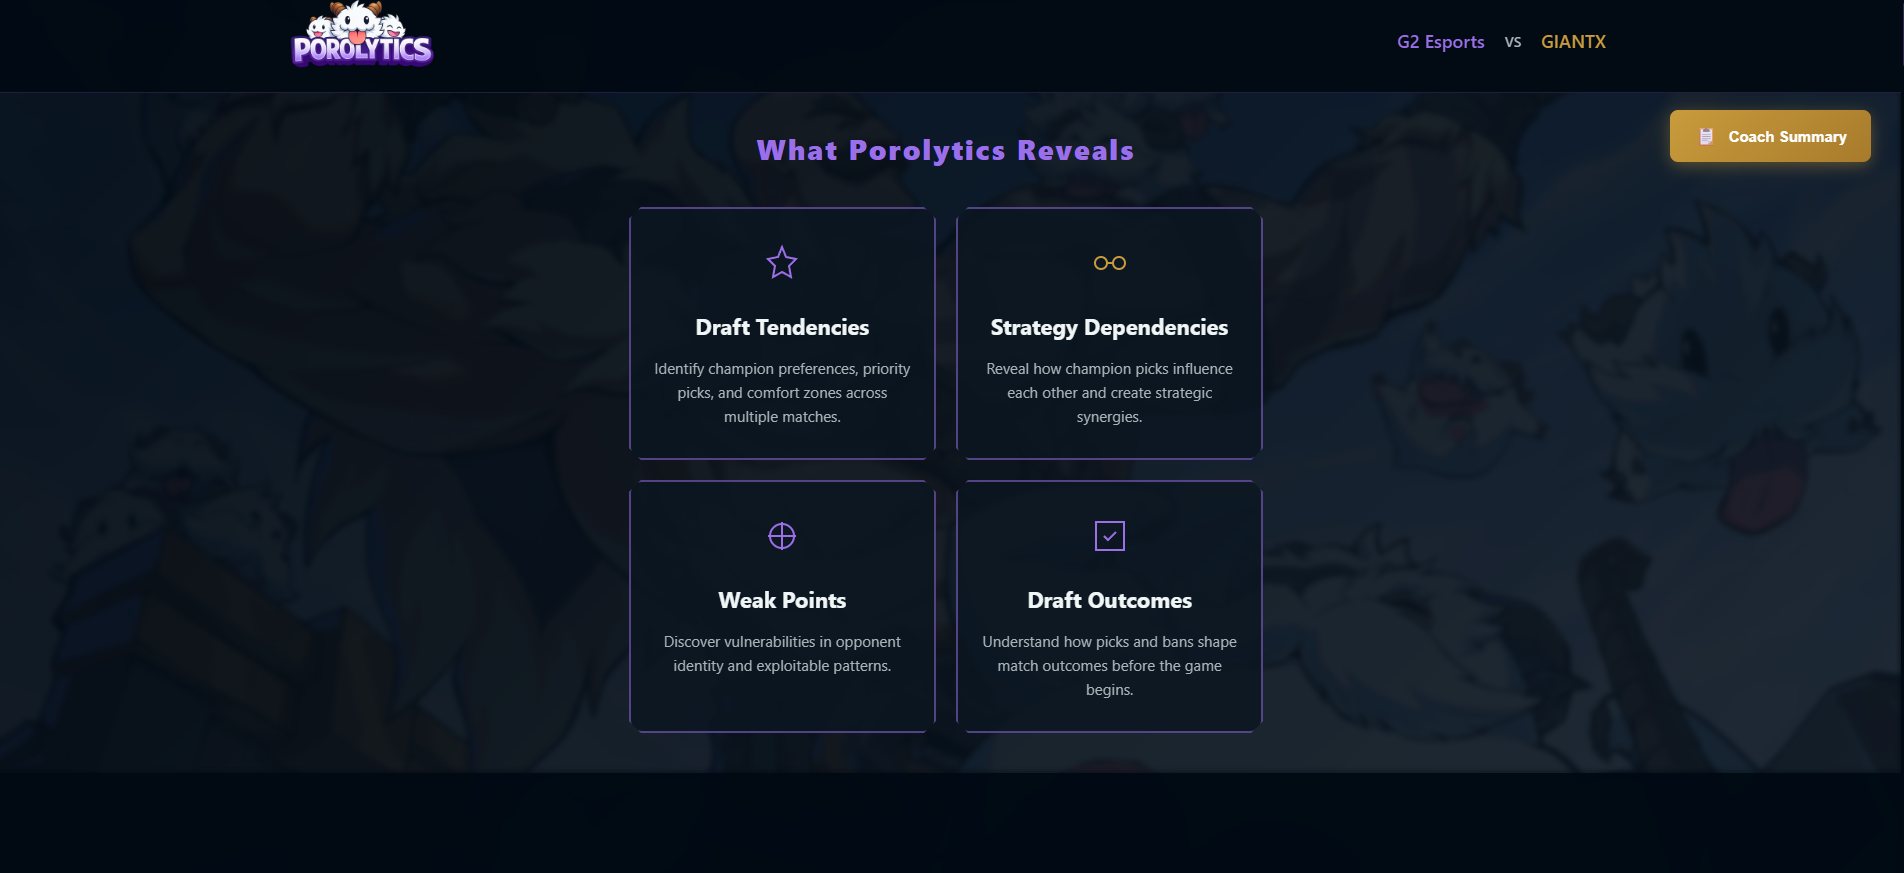
The System Provides
Team Analysis Modules (Implemented)
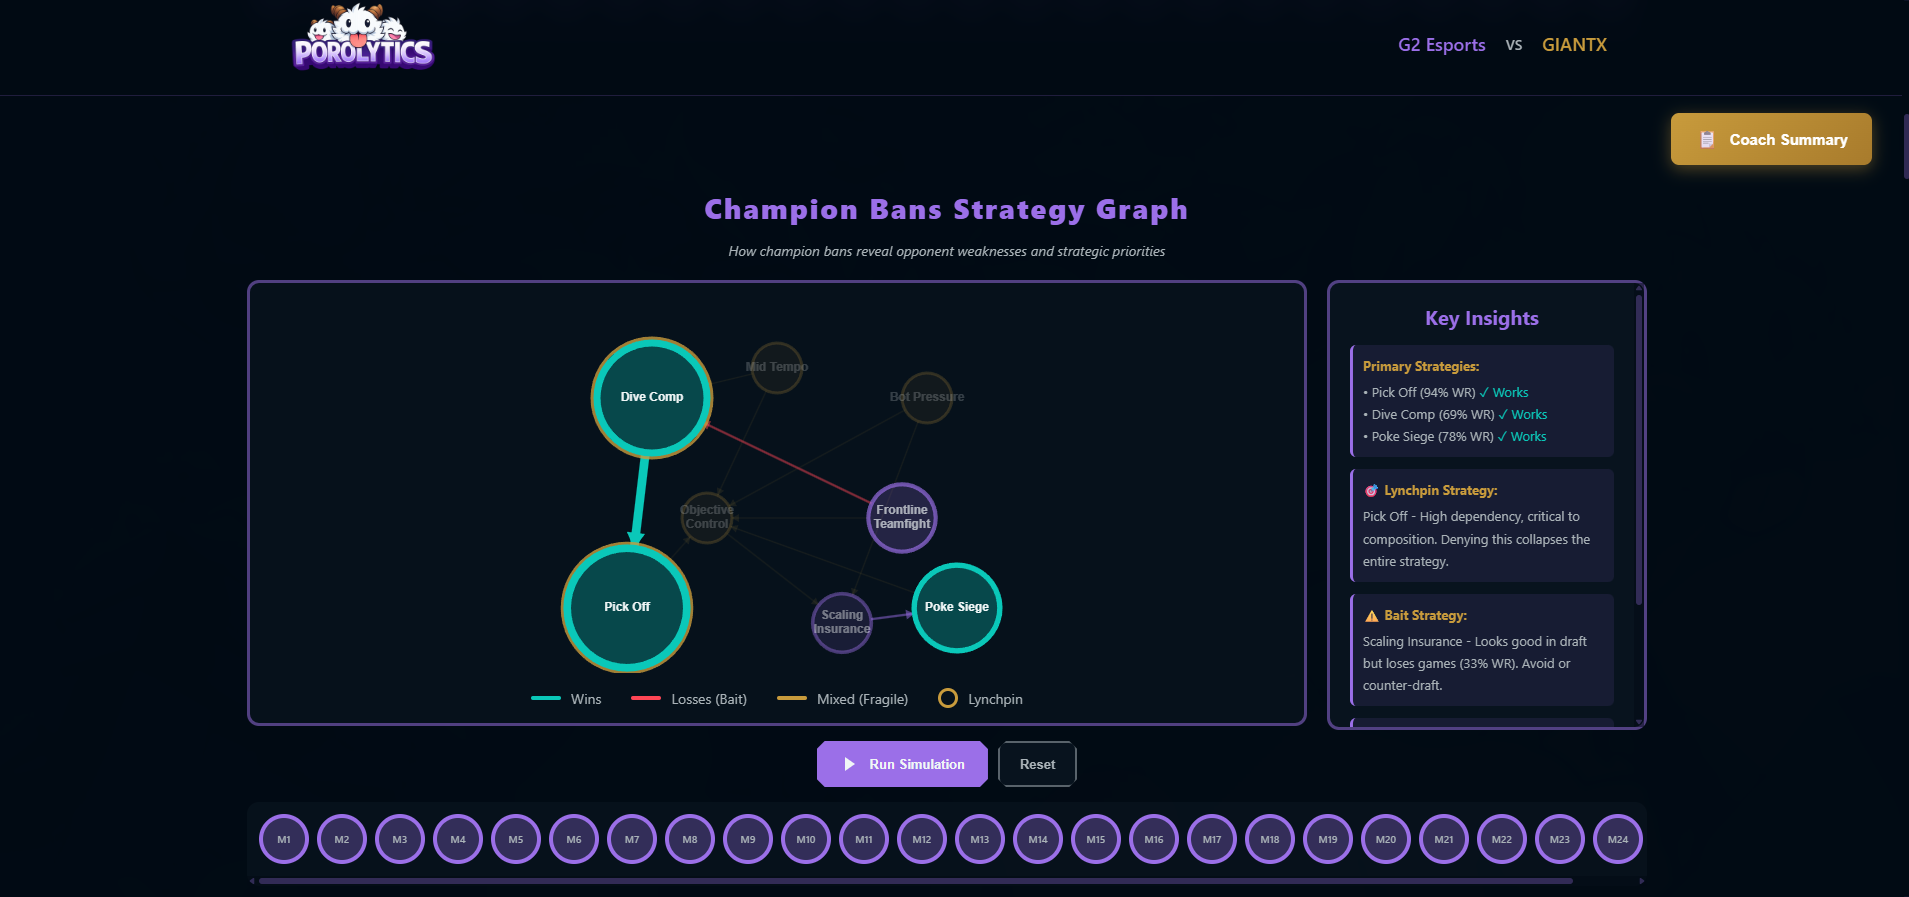
- Draft Tendencies Identifies recurring pick and ban patterns and how teams express their identity through draft.
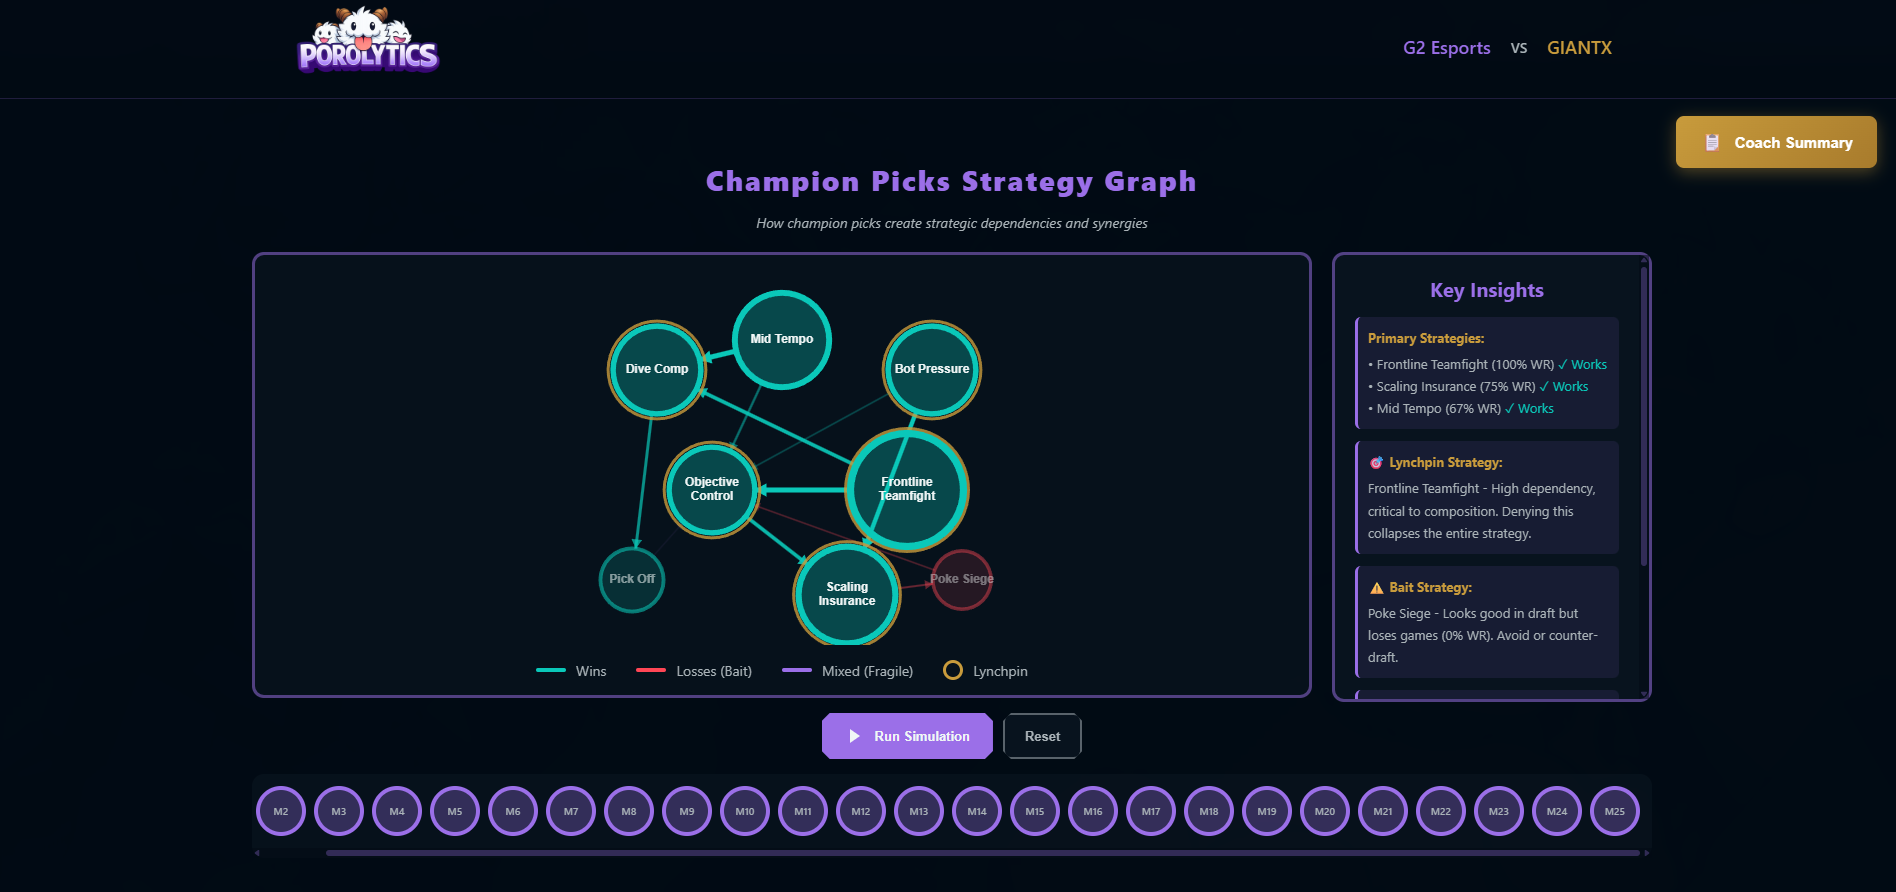
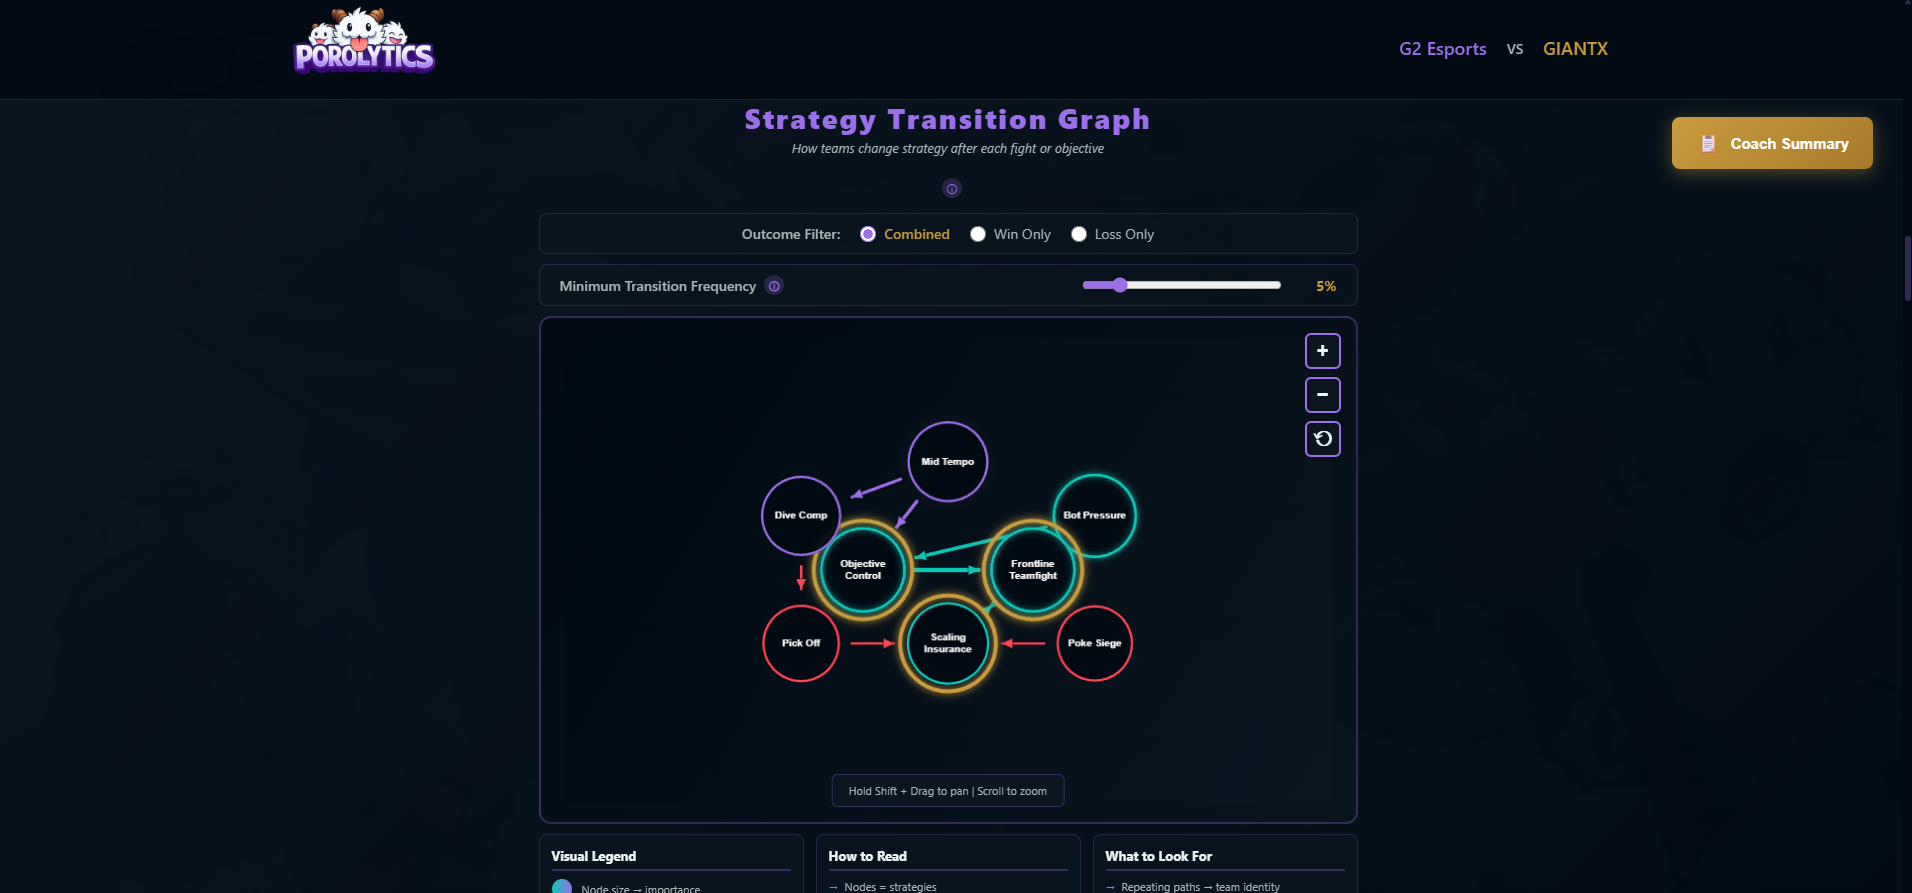
- Strategy Dependencies Models how different strategic concepts (e.g., Objective Control, Teamfight Commit) depend on each other.
- Winning Paths Extracts common strategy sequences that consistently lead to wins.
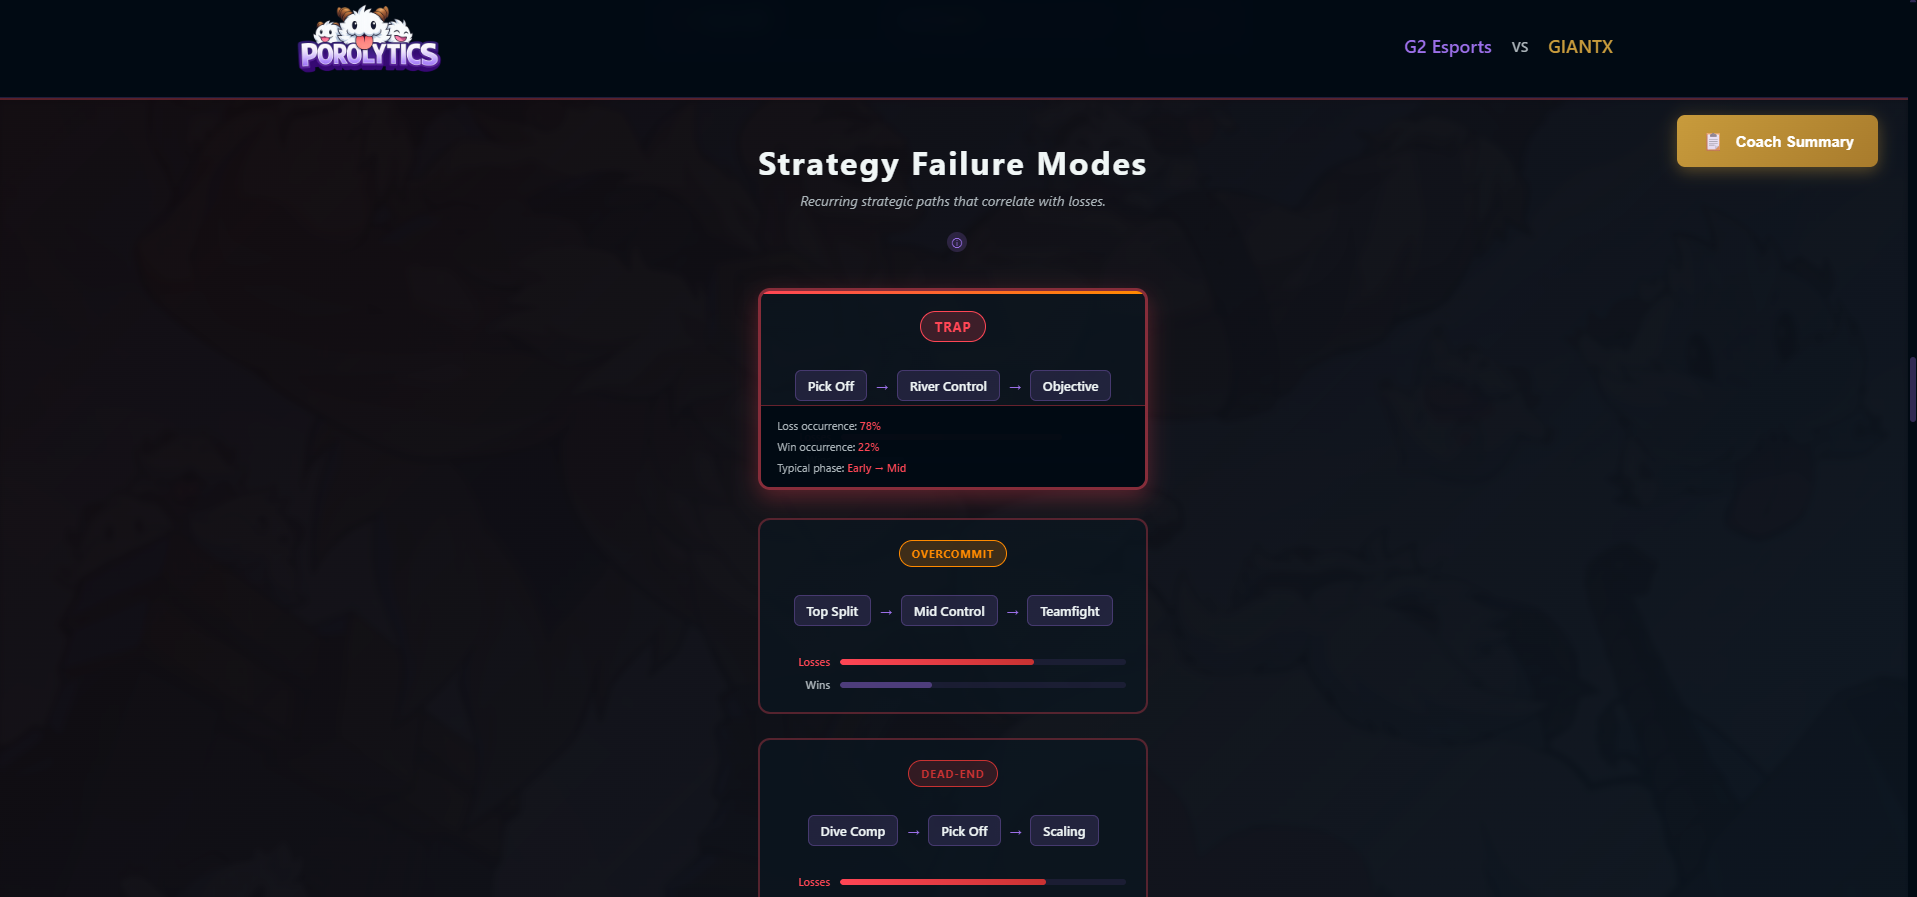
- Failure Modes Detects recurring strategic paths that correlate with losses, traps, and overcommit patterns.
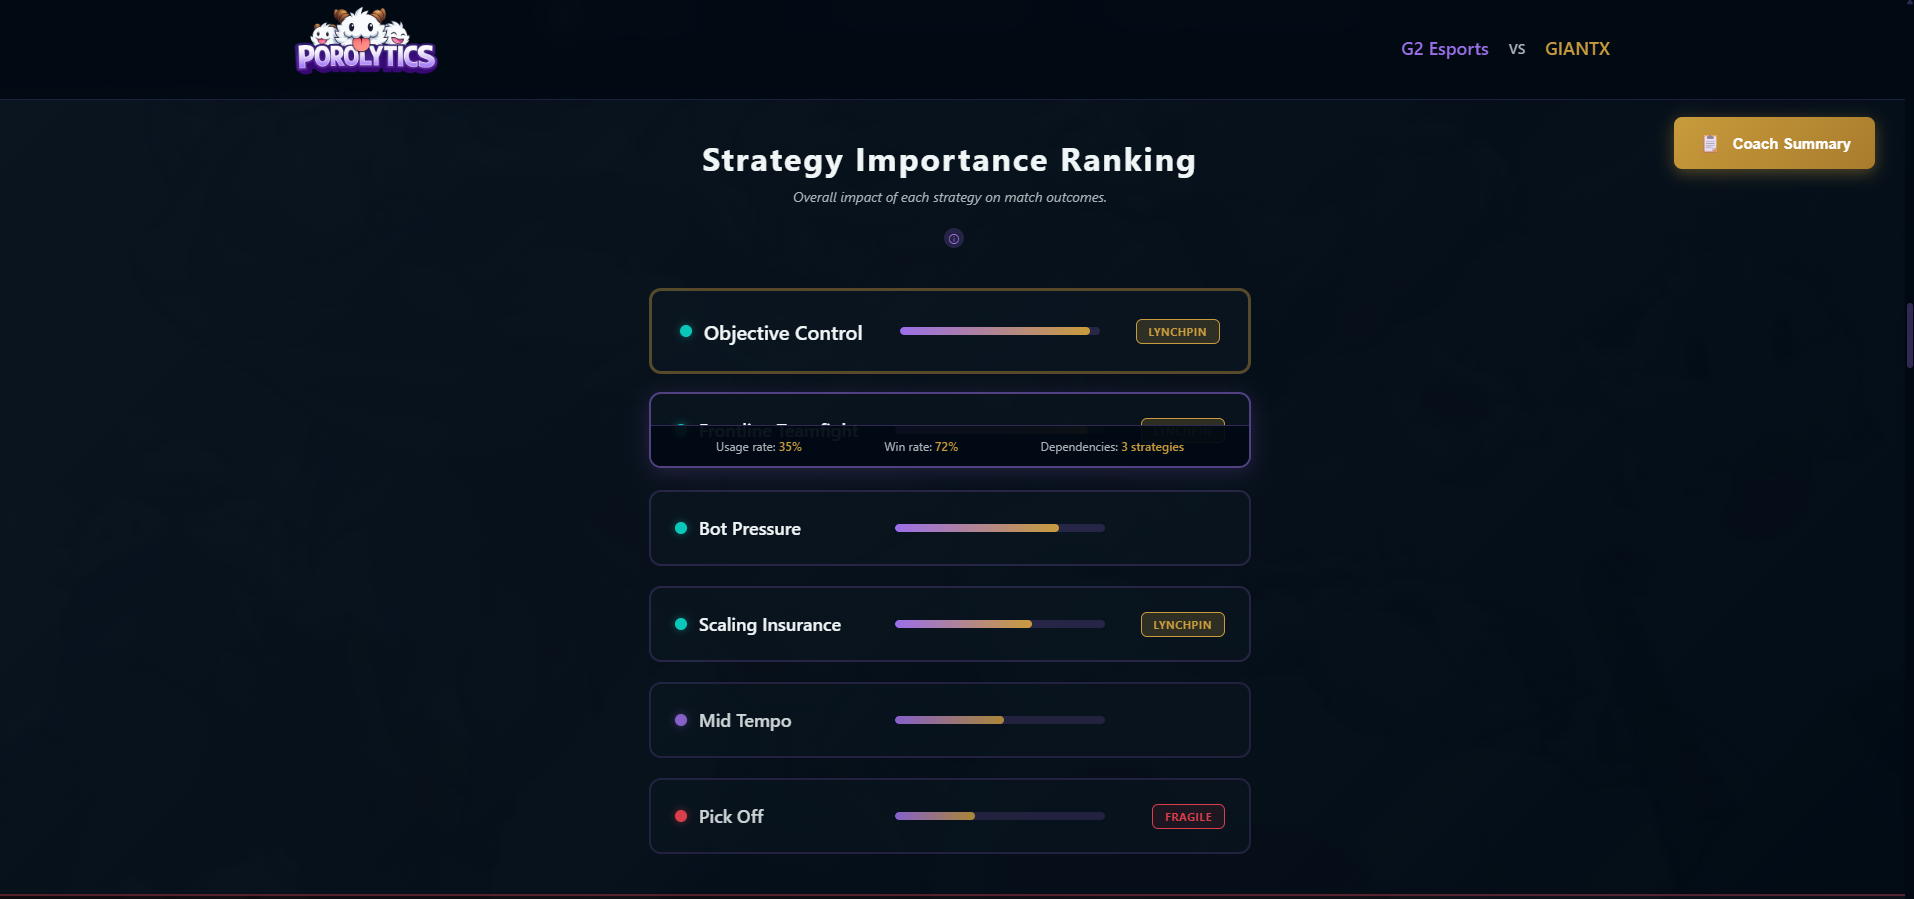
- Strategy Importance & Lynchpins Ranks strategies by impact and identifies lynchpin strategies whose removal collapses the game plan.
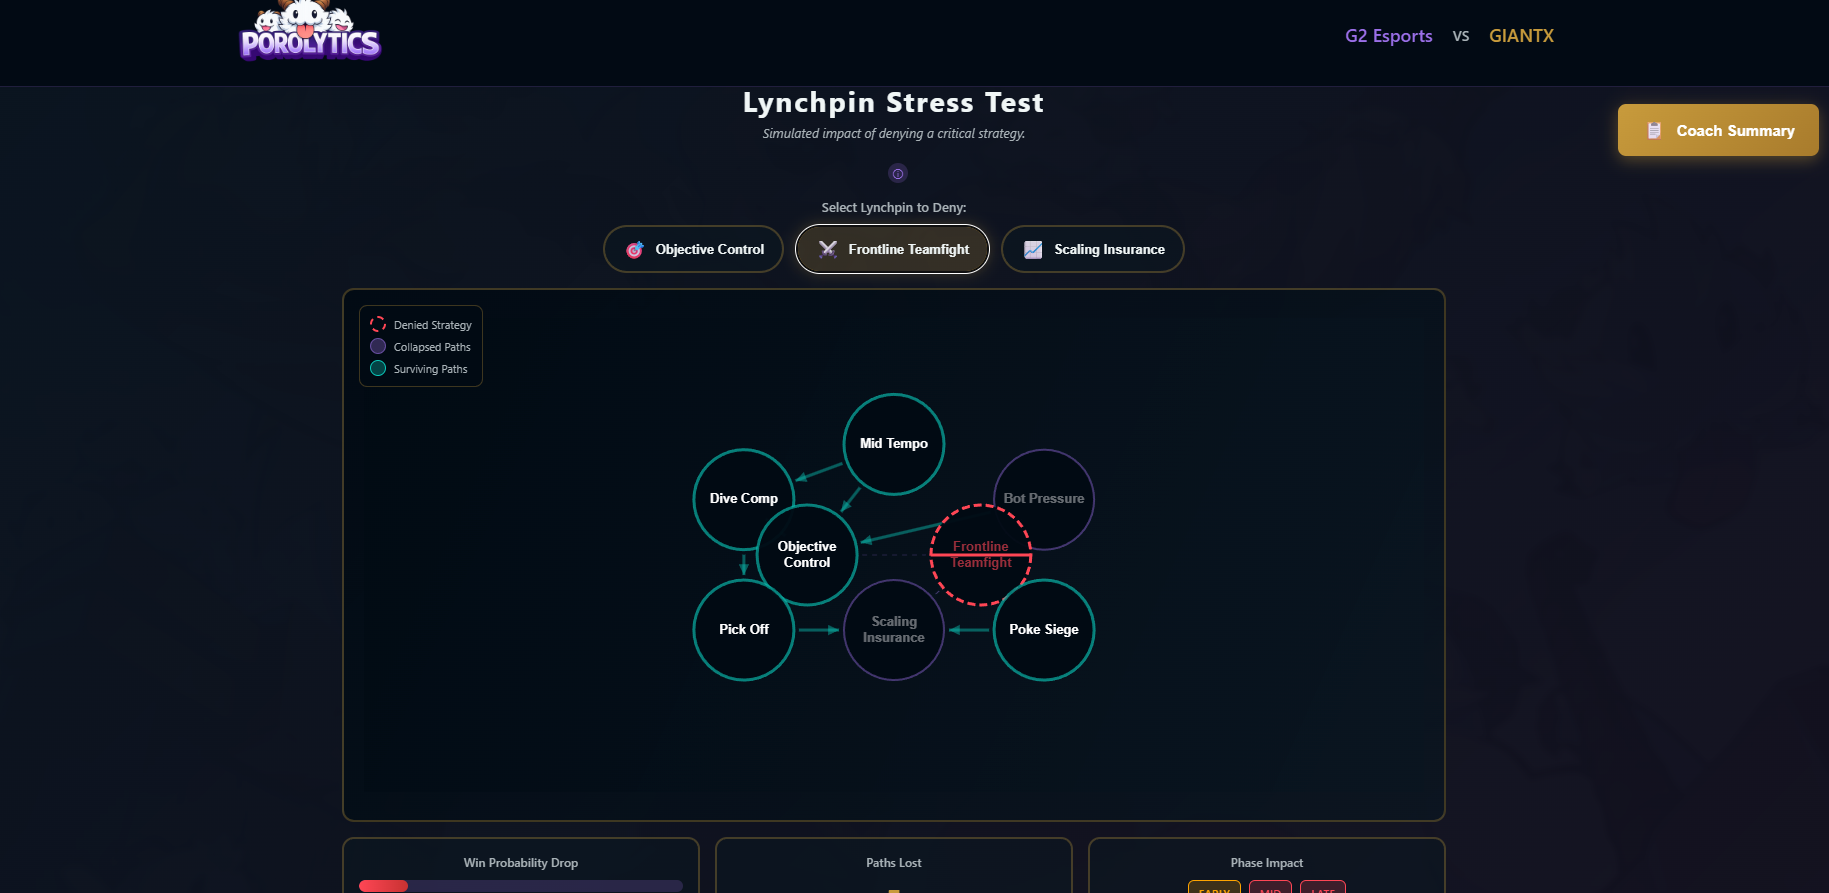
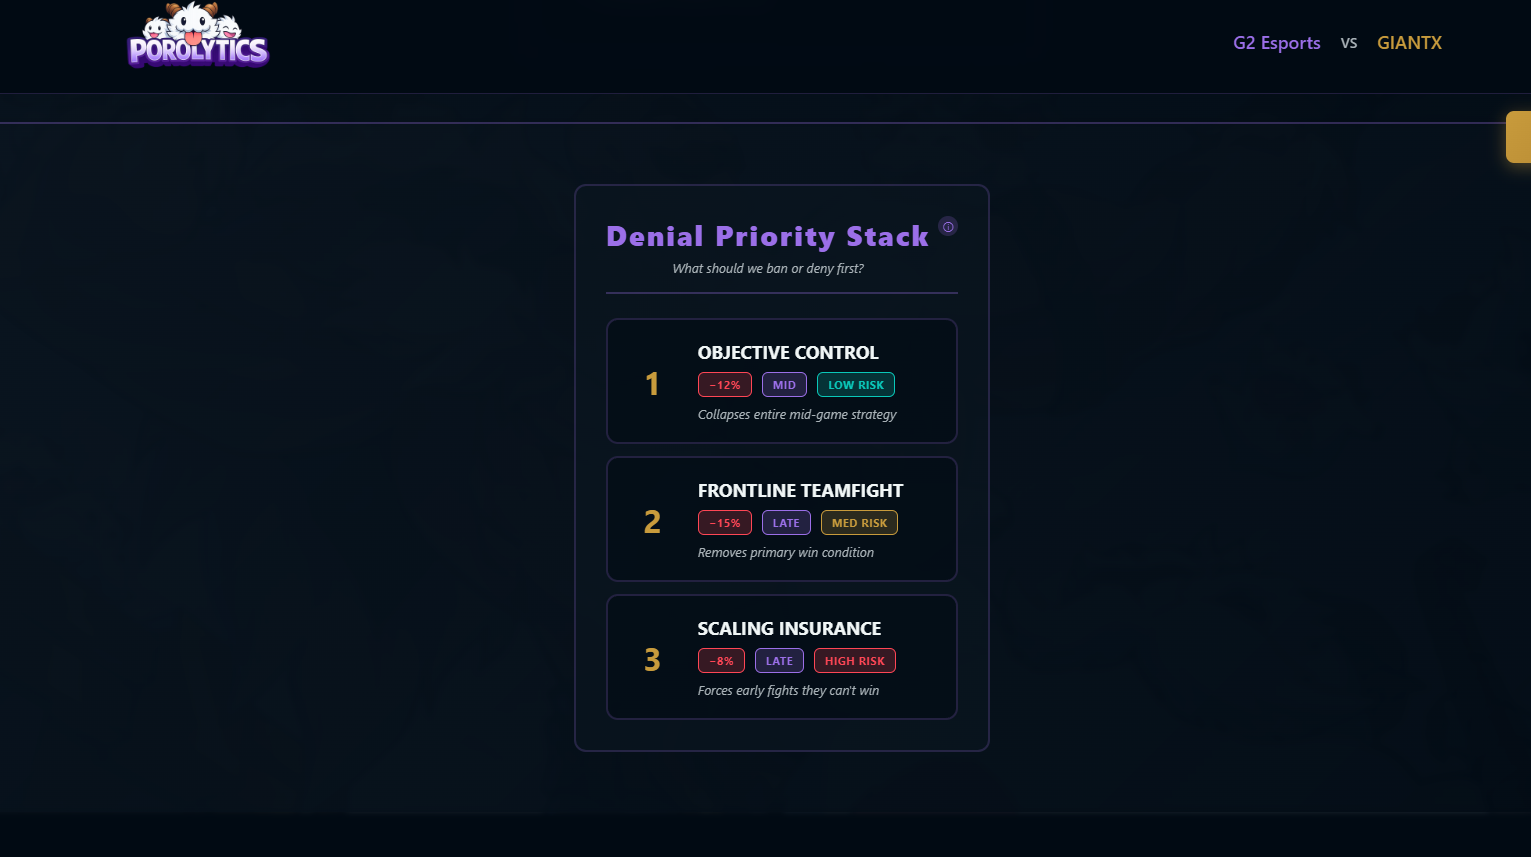
- Break Strategy (Denial Planning) Simulates targeted denial of critical strategies to generate counter-draft and counter-play priorities.
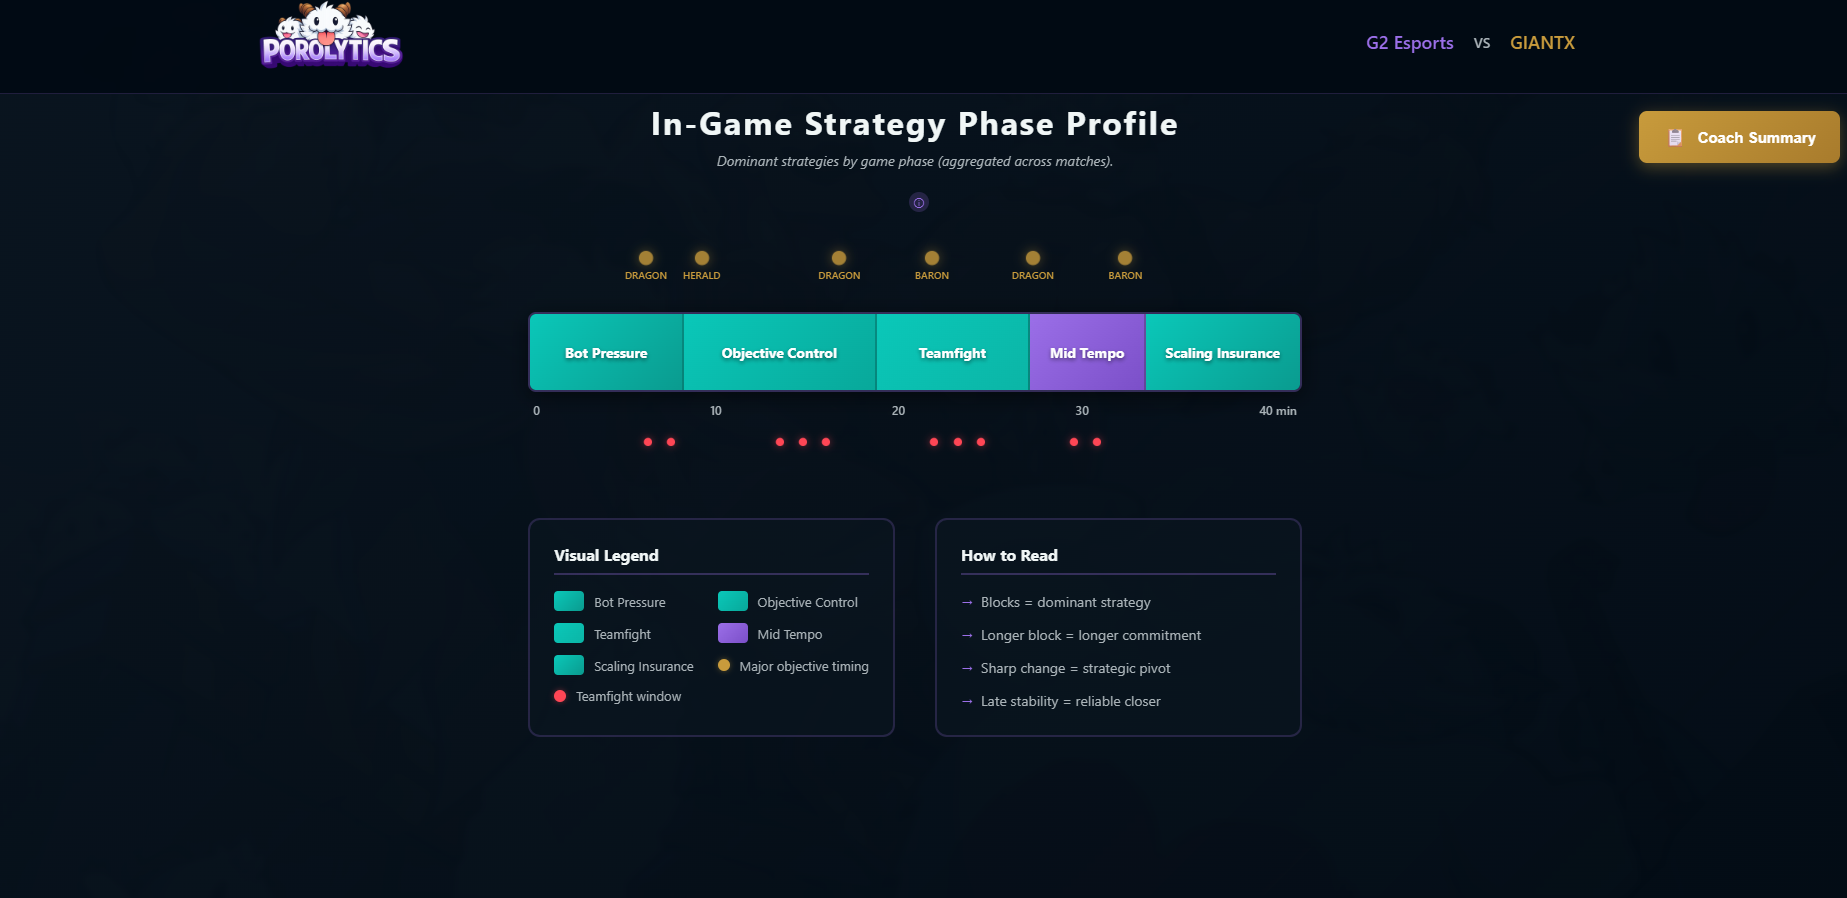
- In-Game Phase Profile Shows which strategies dominate early, mid, and late game across matches.
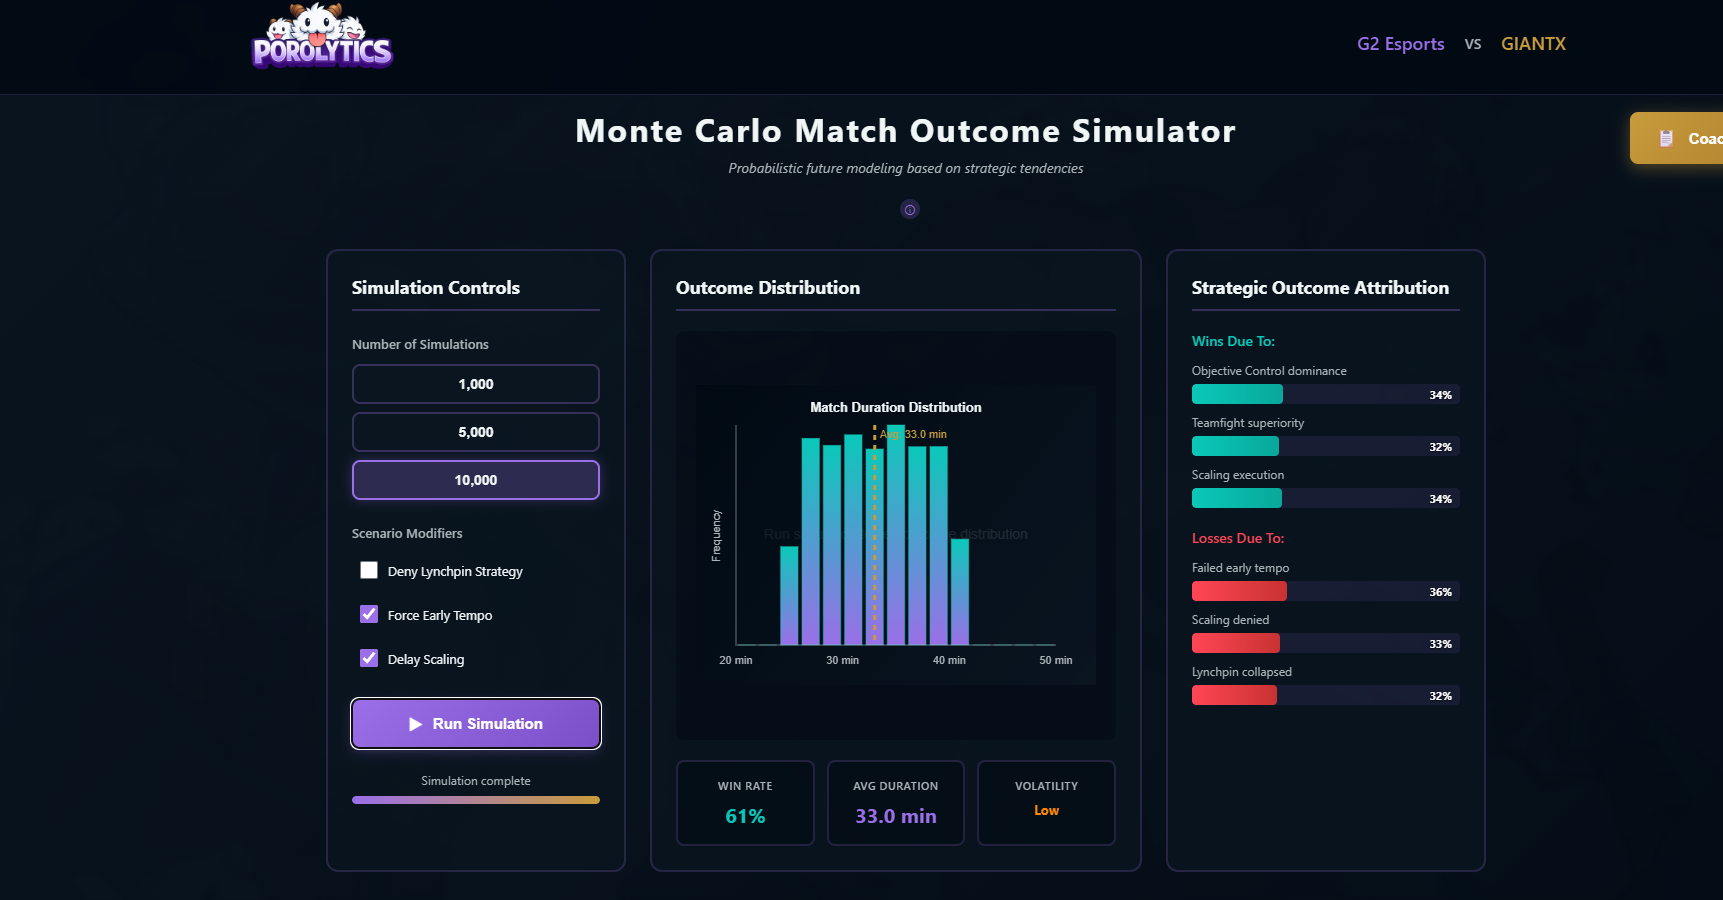
- Monte Carlo Outcome Simulation Runs thousands of strategy-space simulations to estimate win rate, duration, and outcome drivers.
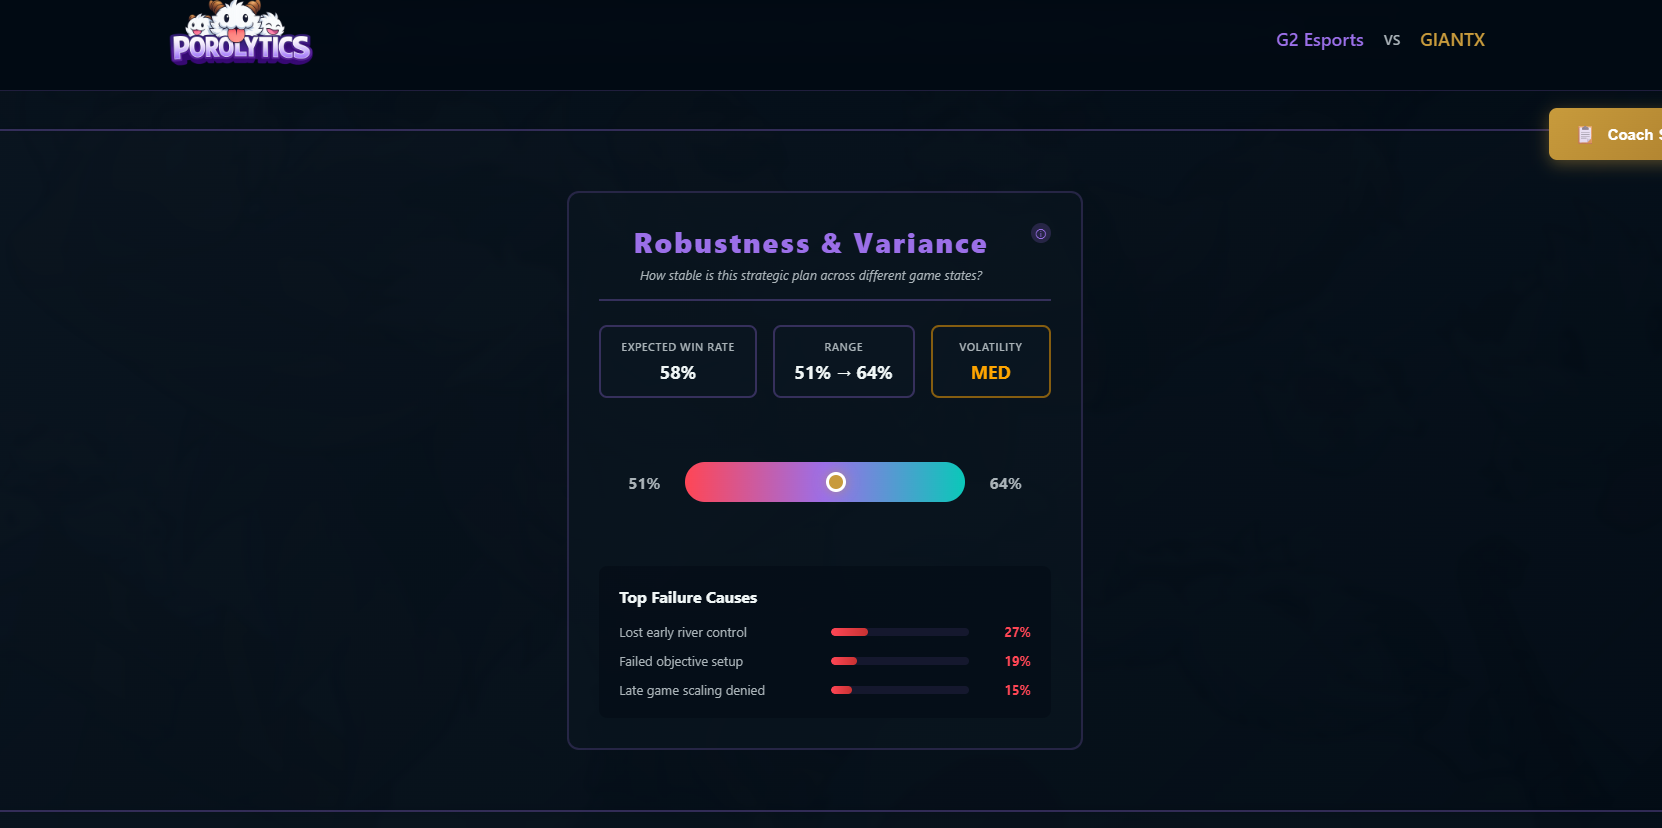
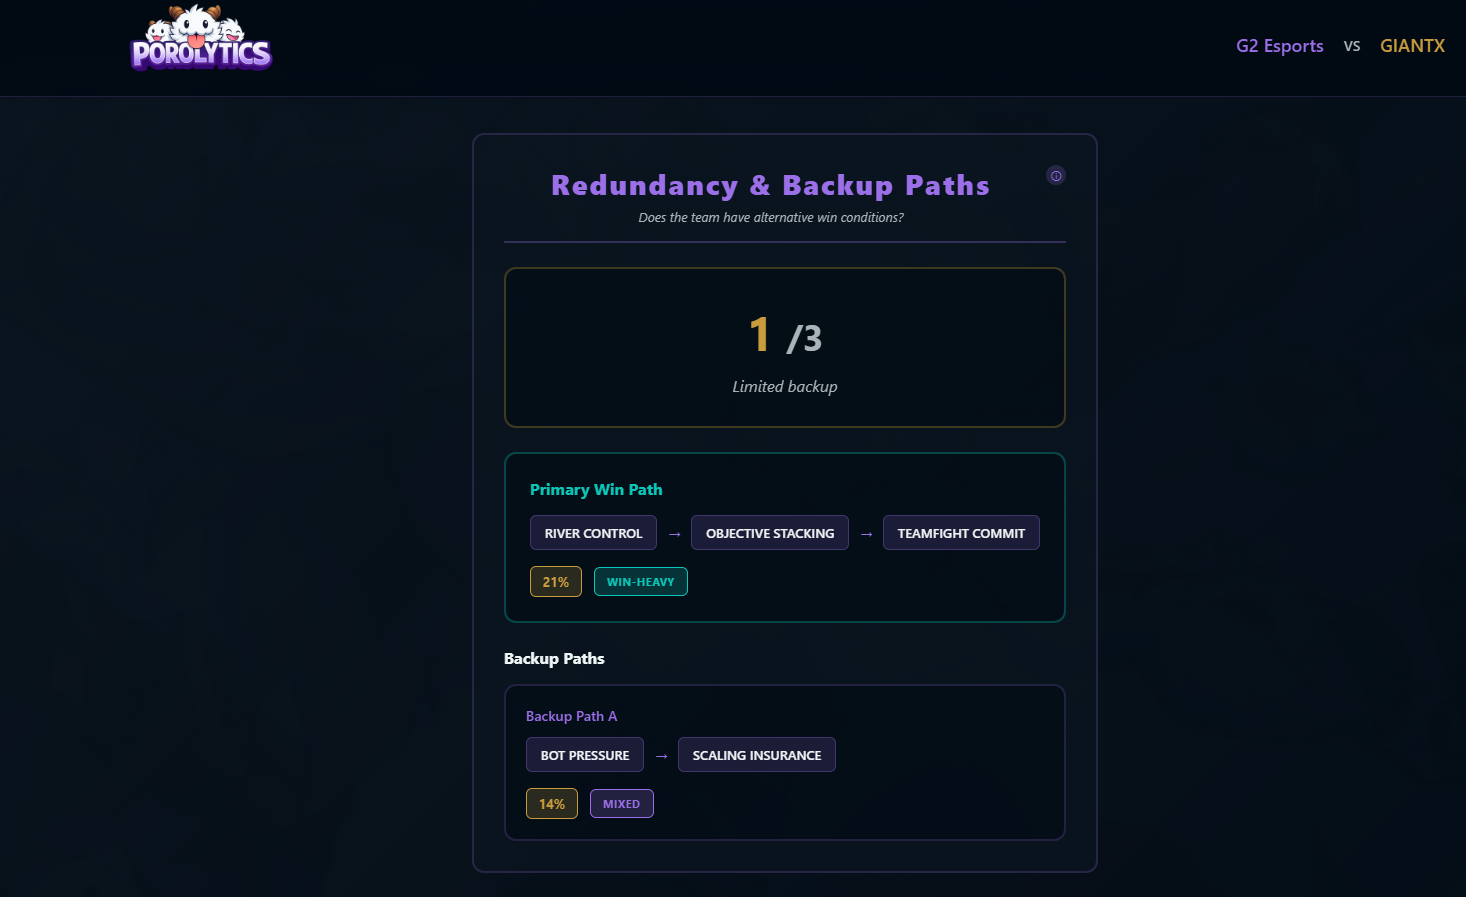
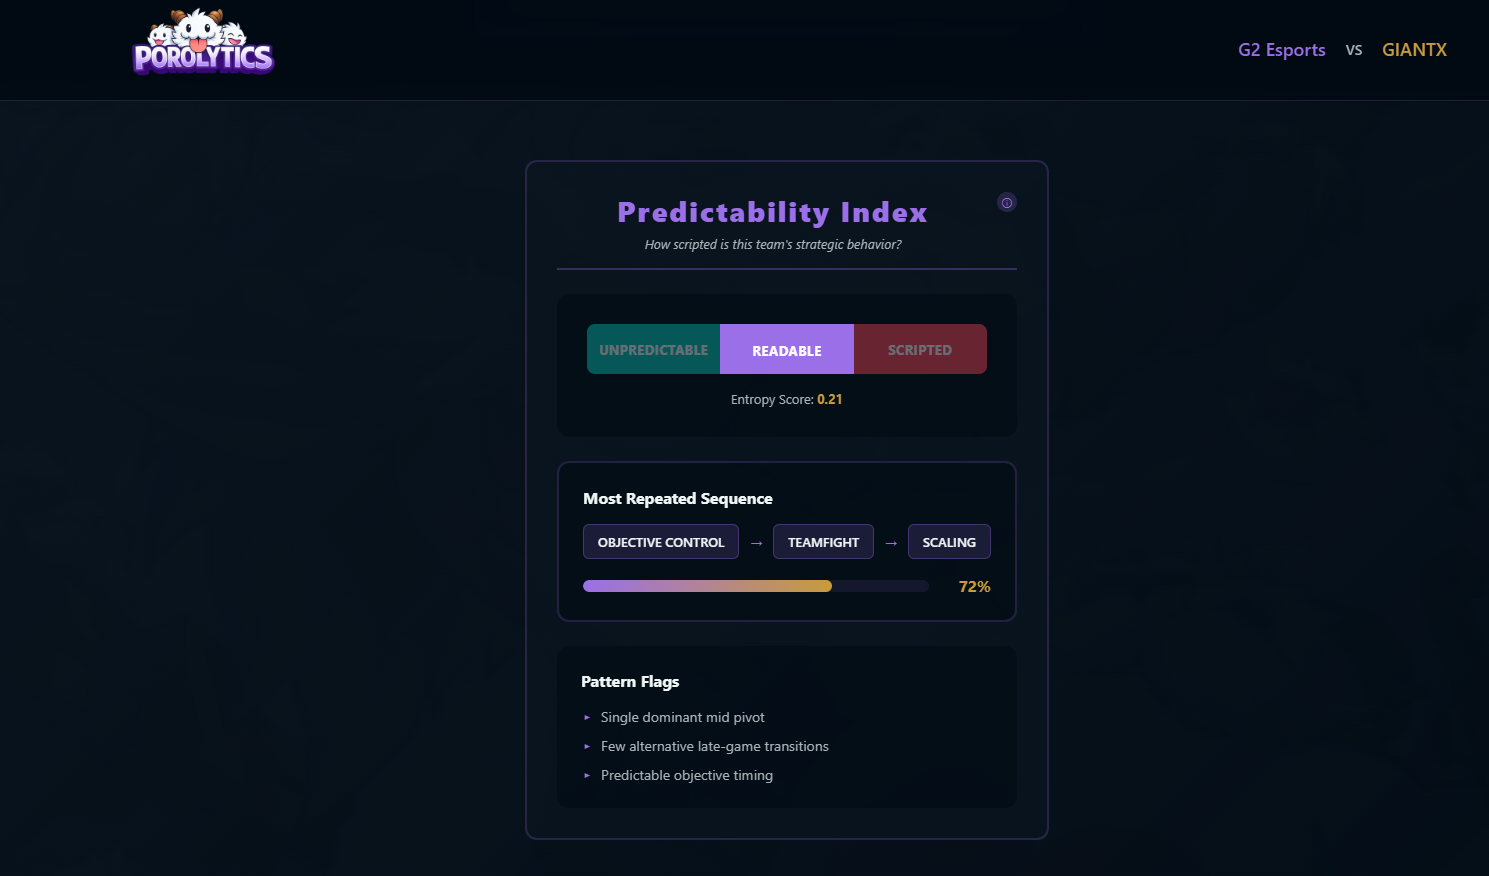
- Robustness, Redundancy & Predictability Measures how stable, flexible, and readable a team’s strategy is under disruption.
Key Capabilities
- Massive Data Processing: Analyzes thousands of in-game events per match across multiple games.
- Decision Abstraction: Converts raw match data into strategy graphs rather than simple heuristics.
- Automated Diagnostics: Identifies lynchpin strategies, traps, and fragile paths automatically.
- Counter-Play Simulation: Simulates what happens if a key strategy is denied to test robustness.
- Actionable Output: Produces concrete ban and gameplan recommendations for coaching staff.
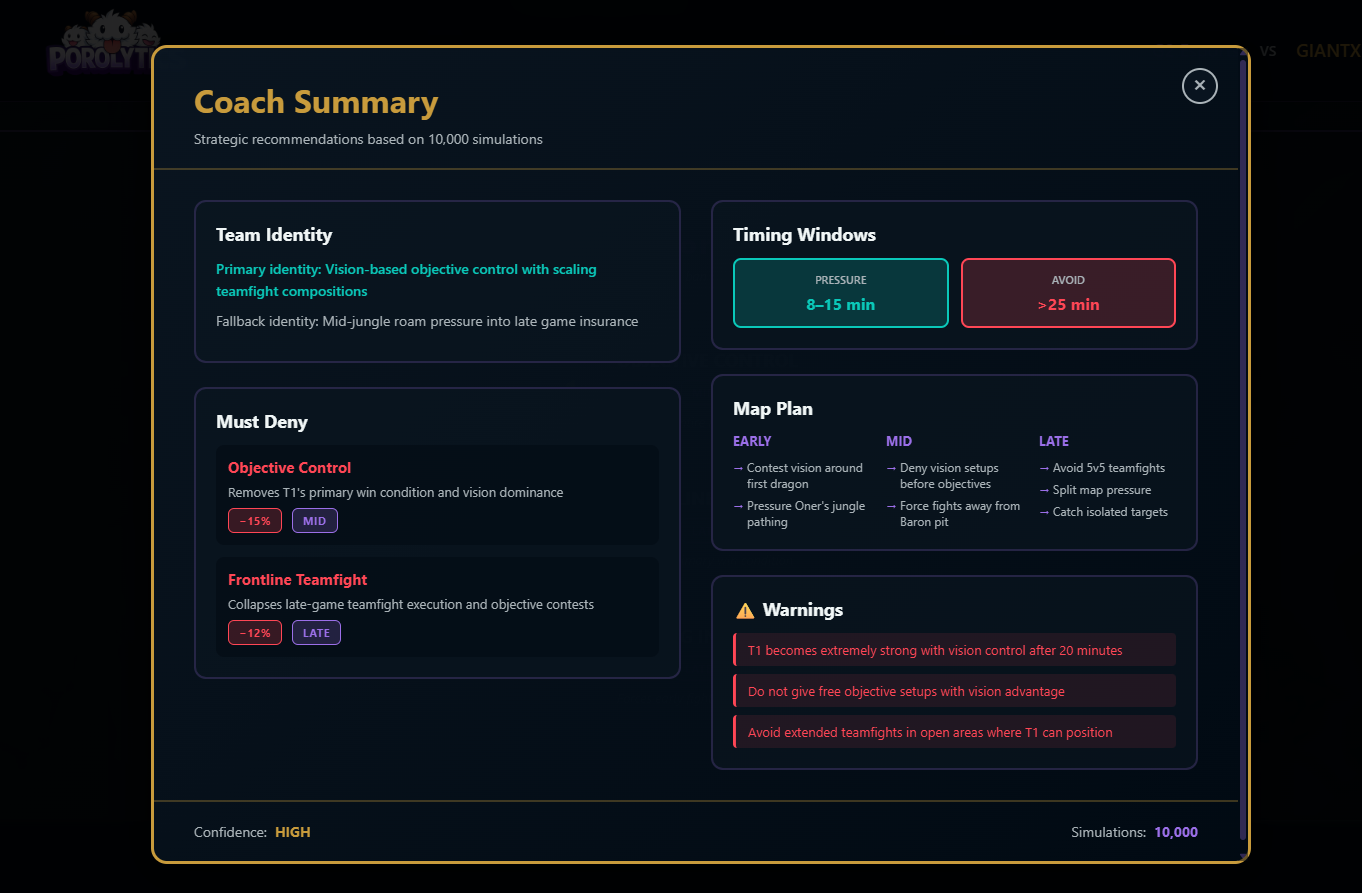
- Summarized Intelligence: Generates a concise Coach Summary derived entirely from computed results.
Data Source
- Professional Integration: Works with real professional match data (e.g., GRID API).
- Zero Bias: No manual labeling and no hand-written rules involved in the analysis.
- Data-Driven Logic: All conclusions are derived strictly from graph structure and simulated outcomes.
How we built it
Data Collection Layer: We built a comprehensive data fetcher using Grid's esports API with GraphQL queries and REST endpoints. The system collects:
- Draft phase data via GraphQL Series State API (picks/bans with sequential timing)
- Event streams in JSONL format (4,800+ events per match)
- Kill events with participant networks and spatial coordinates
- Objective captures (Baron, Dragons, Herald) with precise timestamps
- Structure destruction events (Towers, Inhibitors, Nexus)
- Item purchase sequences and gold economy tracking
- Ability usage patterns and level progression curves
Event Processing & Abstraction: The raw event stream is too granular for strategic analysis. We implemented an encounter segmentation algorithm that clusters events into meaningful decision moments:
- Temporal-Context Clustering - Groups adjacent events within time windows (±30s) with participant overlap
- Encounter Classification - Labels each cluster as SKIRMISH, TEAMFIGHT, OBJECTIVE, or PRESSURE based on event composition
- Intent Inference - Determines the "why" behind each encounter (PICK, SECURE, LANE_ADVANCE, COMMIT)
- Spatial Reasoning - Infers map location using probabilistic zone inference when coordinates are missing
This compresses ~35 minutes of gameplay into 30-50 strategic nodes that coaches actually think about.
Pattern Mining & Strategy Extraction: We use frequent pattern mining (FP-Growth inspired) to discover winning sequences:
- Extract objective sequences from winning games
- Mine frequent subsequences with minimum support threshold (30%)
- Rank patterns by support percentage and win correlation
- Identify "recipe" patterns that appear consistently
For champion analysis, we built a dependency graph where:
- Nodes represent champions/strategies
- Edges represent co-occurrence and sequential relationships
- Weights increase with repeated patterns
- PageRank-style centrality identifies "lynchpin" picks
Draft Strategy Discovery with ACO: We implemented Ant Colony Optimization (ACO) to model draft decision-making:
- Each "ant" simulates a draft trajectory through the strategy space
- Ants follow edge weights (historical patterns) and pheromone levels (past success)
- Pheromone update rule: Winning drafts reinforce paths, losing drafts decay them
- Over iterations, the algorithm converges on high-probability winning chains
- Identifies fragile sequences where removing one pick collapses the entire strategy
This reveals not just what teams pick, but the sequential dependencies in their draft logic.
Statistical Analysis Pipeline:
- Role Attribution - Infer player roles from champion picks and position data
- Gold Distribution Analysis - Track resource allocation from item purchases
- Win Correlation - Calculate role-specific KDA in wins vs losses using Pearson correlation
- Pattern Frequency - Count occurrence rates of strategic sequences
- Failure Mode Detection - Identify common collapse patterns in losses using clustering
- Lynchpin Detection - Combine PageRank centrality with ablation impact scores
Counter-Strategy Generation: The system uses graph ablation analysis to test structural fragility:
- Remove high-centrality nodes (comfort picks) from the strategy graph
- Simulate path completion success rate using Monte Carlo methods
- Calculate robustness score:
success_rate_denied / baseline_success_rate - Generate deny recommendations based on largest impact
We also implement outcome-conditioned graph separation:
- Build separate WIN graph and LOSS graph from the same data
- WIN graph shows strategies that lead to victories
- LOSS graph reveals where teams stall and collapse
- Compare graph topology to identify structural weaknesses
Technical Stack:
- Python for data processing and statistical analysis
- Grid API (GraphQL + REST) for professional match data
- Graph algorithms: PageRank, ACO (Ant Colony Optimization), node ablation
- Pattern mining: FP-Growth-inspired frequent subsequence mining
- Statistical methods: Laplace smoothing, correlation analysis, KDA aggregation
- Probabilistic inference: Bayesian-style location confidence scoring
- Modular architecture with reusable classes and CLI interfaces
Key Design Principles:
- Event abstraction over raw telemetry (encounters, not milliseconds)
- Probabilistic inference when data is incomplete
- Graph-based reasoning for strategy dependencies
- Outcome-conditioned analysis (separate win/loss patterns)
- Explainable conclusions (every insight traces back to data)
Challenges we ran into
Data Sparsity & Missing Coordinates: Grid's League of Legends event data doesn't include continuous position tracking or ward placement coordinates. We had to build a probabilistic spatial inference system that assigns location confidence scores (e.g., "87% RIVER, 11% JUNGLE") based on event composition rather than hard-coding zones. This required careful validation to avoid false precision.
The Small Sample Problem: With only 10-20 matches per team, traditional machine learning would overfit instantly. We solved this with:
- Minimum support thresholds for pattern mining (30% occurrence rate)
- Laplace smoothing for sparse transition probabilities
- Quality gating to filter out "ghost encounters" (0ms duration, single-player events)
- Focus on structural patterns rather than point estimates
Event Segmentation Correctness: Raw events don't come pre-labeled as "teamfight" or "skirmish." Our temporal-context clustering had to handle:
- Overlapping encounters (multi-front fights)
- Atomic events (instant structure ticks)
- Contested vs uncontested interactions
- Time gaps that indicate rotations vs resets
We built a multi-factor classifier with hard correctness gates to prevent "poison nodes" from corrupting the strategy graph.
From Statistics to Strategy: The hardest challenge was translating correlation into causation. A champion with 65% win rate isn't automatically a comfort pick - it might just be meta. We had to layer multiple signals:
- Pick frequency (shows intent)
- Win rate (shows success)
- Pick position in draft (shows priority)
- Role consistency (shows specialization)
Only when all signals align do we call it a "comfort pick."
Graph Interpretability: Early strategy graphs were dense and unreadable. We implemented edge weight thresholding and node centrality filtering to surface only the most important relationships. The final graphs show 8-12 key strategies instead of 50+ noisy connections.
Balancing Depth and Speed: We wanted comprehensive analysis but also needed it to run in under 30 seconds. Solution: modular analysis architecture where you can run all 9 modules or just the 2-3 you need for a specific matchup.
Accomplishments that we're proud of
Complete End-to-End System: We built a full pipeline from raw API data to actionable coaching insights, not just a proof of concept.
Real Professional Data: The system works with actual professional match data from teams like T1, Cloud9, G2 Esports, and Gen.G.
Actionable Intelligence: Every analysis module produces specific, actionable recommendations. Not just "they like teamfights" but "ban Jinx, pressure top lane early, deny river control before objectives."
Reusable and Flexible: Both the data fetcher and analyzer are designed as reusable libraries with CLI interfaces. You can analyze any team, compare teams, or run specific analyses.
Honest About Limitations: We're transparent about what the data can and can't tell us. We don't claim to track ward placements when that data doesn't exist.
What we learned
Event Abstraction is Everything: Raw telemetry (4,800 events/match) is too granular for strategic reasoning. The correct unit of analysis is the encounter - a temporally and contextually bounded decision moment. This matches how coaches actually think: "the river fight for drake" not "kill event #247."
Probabilistic > Deterministic:
When data is incomplete (missing coordinates, sparse samples), probabilistic inference beats hard classification. Our location confidence distributions ({"RIVER": 0.87, "JUNGLE": 0.11}) are more honest and useful than forcing a single label.
Graph Topology Reveals Strategy: Strategy dependencies form a directed acyclic graph where:
- High in-degree nodes are "gateway strategies" (required for many paths)
- High out-degree nodes are "conversion strategies" (enable multiple outcomes)
- High PageRank nodes are "lynchpins" (structurally critical)
Removing a lynchpin doesn't just reduce win rate - it collapses entire execution paths.
Frequency ≠ Importance: We learned to distinguish:
- Frequent but fragile (appears often but low impact when denied)
- Rare but critical (low frequency but high structural importance)
- Comfort picks (frequent + high win rate + early draft priority)
- Trap picks (frequent + low win rate = bait)
This required multi-signal analysis, not just counting occurrences.
Outcome-Conditioned Graphs are Key: A single unified graph conflates success and failure. Separating into WIN graph and LOSS graph reveals:
- Which strategies actually lead to victories (not just appear in games)
- Where teams stall when their plan fails
- Structural differences between winning and losing execution
Coaches Want Leverage, Not Prediction: We initially tried to predict match outcomes. Wrong approach. Coaches don't want "60% win probability" - they want "if you deny X, their win rate drops to 40%." Leverage analysis (what to disrupt) beats prediction.
Explainability is Non-Negotiable: Every conclusion must trace back to:
- Raw events (kills, objectives, timestamps)
- Encounter abstraction (clustered decision moments)
- Pattern frequency (how often it appears)
- Win correlation (does it actually matter)
- Graph structure (is it a lynchpin)
No black boxes. No "the AI said so."
What's next for Porolytics
Scale & Performance:
- Real-time analysis - Process matches as they happen for live coaching
- Batch processing - Analyze entire tournaments in parallel
- Caching layer - Speed up repeated queries for the same teams
Enhanced Insights:
- Temporal evolution tracking - How teams adapt across patches and tournaments
- Cross-regional analysis - Compare playstyle differences (LCK vs LCS vs LEC)
- Player-specific tendencies - Individual player patterns beyond team-level analysis
Better Delivery:
- Interactive strategy graphs - Visual drill-down into supporting evidence
- PDF scouting reports - Shareable, printable opponent playbooks
- Confidence intervals - Quantify uncertainty on all recommendations
Validation:
- Coach feedback integration - Learn which insights are most valuable
- A/B testing framework - Track recommendation success rates
- Cross-validation - Verify patterns hold across different sample sizes
Built for the Cloud9 x JetBrains Hackathon
Porolytics transforms esports telemetry into coaching intelligence using graph theory, pattern mining, and probabilistic inference - making opponent preparation faster, more objective, and more actionable.
Built With
- flask
- grid
- jetbrains
- junie
- postgresql
- python
- react
- tailwind
- typescript
Log in or sign up for Devpost to join the conversation.