-
-

UI example: clear panel
-

UI example: panel with obstructing object
-

screenshot from the ui webapp for the prediction computer vision system on device
-
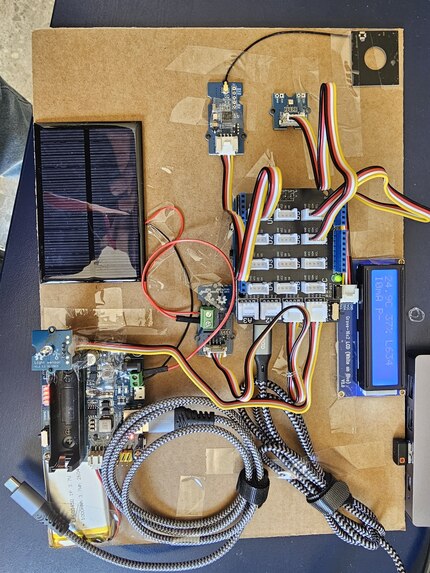
Final schematic



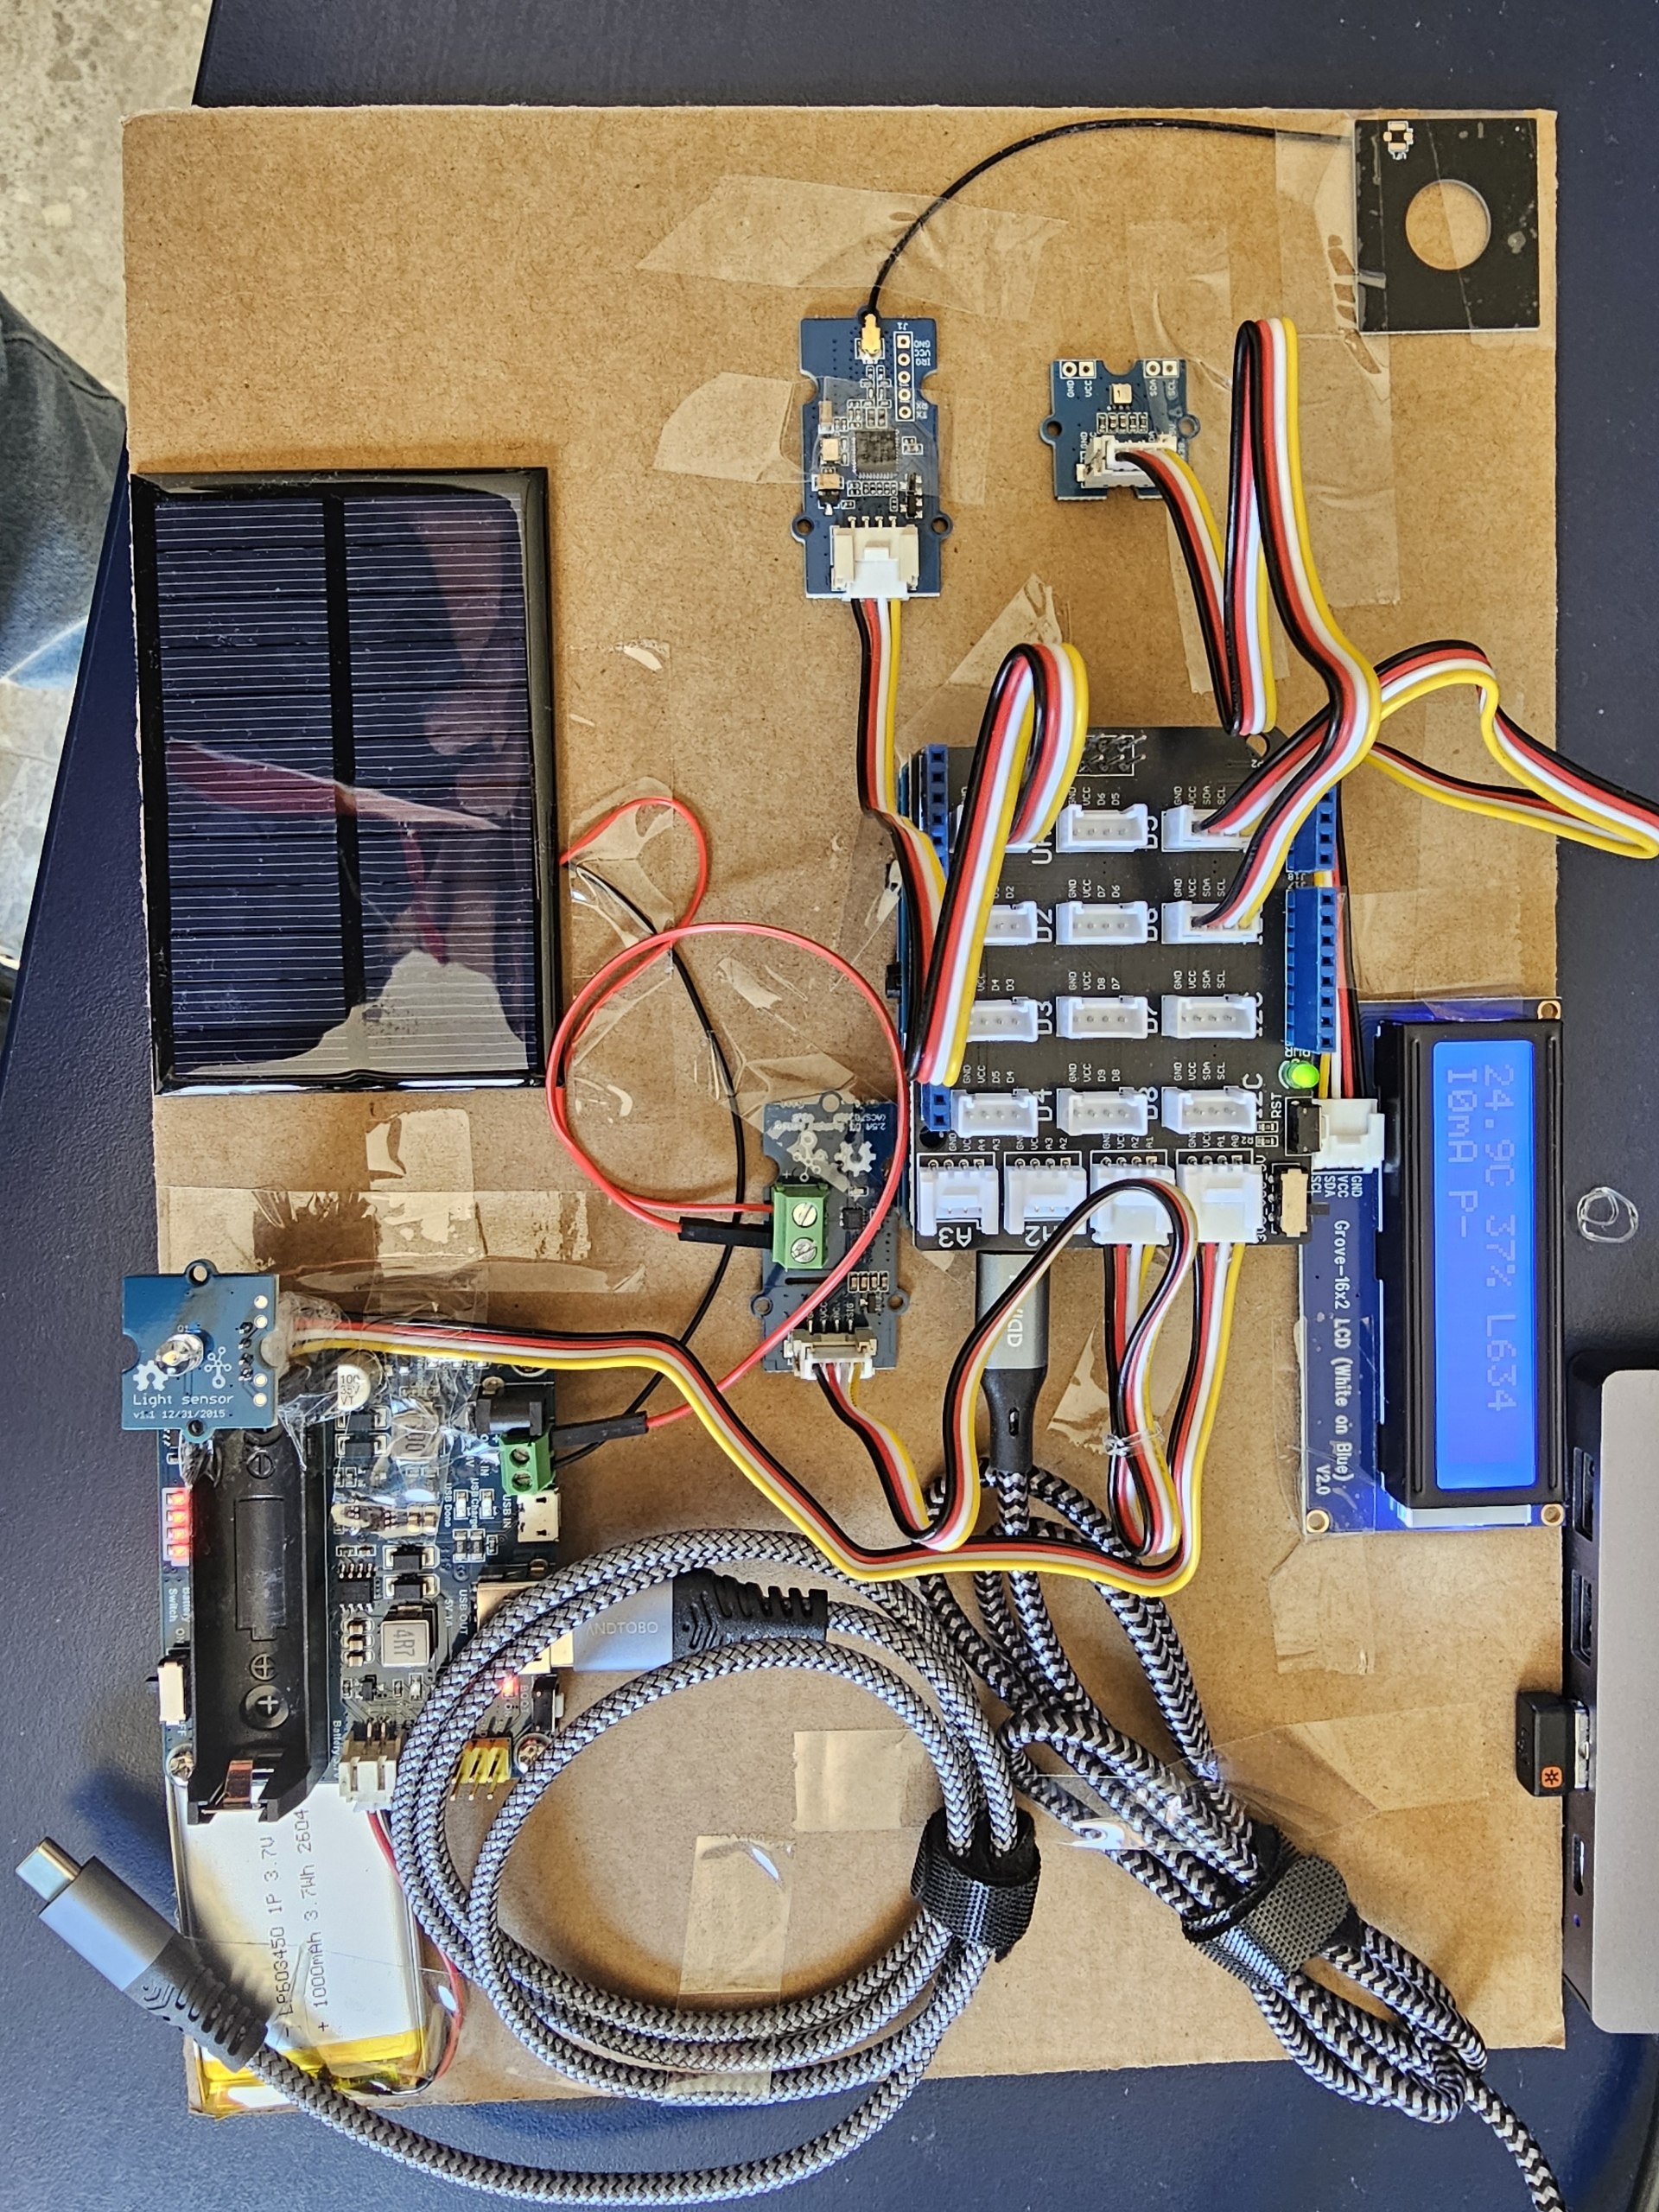
Inspiration
Your solar plant is covered in bird droppings. Literally. The real question is how much that matters.
Take an owner whose photovoltaic plant was installed years ago. It still produces, but nobody can tell whether it produces as much as it should. The service company that looks after it has the mirror-image problem: how do you persuade an owner to inspect or clean a plant that apparently works? Dust, wear and droppings are possible causes, but an intervention needs evidence the owner can understand and judge for themselves.
What it does
PoopVolt is a proposed maintenance aid built around an Arduino UNO Q. It turns a gap in production into a proposal an owner can understand:
- Expected versus observed production. Compare what a plant produced with an expectation over the same period and show the gap with its uncertainty. Today we demonstrate a peer-relative version on replayed data (each inverter against its peers); a weather-adjusted theoretical reference is the proposed next step. The gap is a place to look, not a diagnosis, and not guaranteed recoverable energy.
- Visible soiling from phone-to-edge computer vision (software pipeline & Web UI complete; trained weights pending). Technicians or owners capture panel photos directly using their phone's camera in a browser over the local network—without installing a native app or streaming data to an external cloud. The edge service processes the photo to localize solar panels and identify surface deposits (clean areas, dust, and bird droppings), spatially mapping each defect into its parent panel. An interactive Web UI provides a side-by-side workspace: the raw photo beside an annotated view with togglable SVG overlays, detection confidence scores, panel isolation dropdowns, and automated conservative maintenance recommendations ("arrange inspection" or "consider cleaning"). To ensure transparent demonstration before field model training, the interface includes a labelled illustrative demo mode with sample imagery. A phone RGB camera replaces the thermal camera we could not get, so we make no claim about hotspots or lost energy.
- A technician-reviewed proposal (proposed, not built yet). A short evidence summary a service company can use to explain a cleaning, a repair or a replacement.
On the device itself, the UNO Q reads temperature, humidity, light and panel current, shows the latest values on a small LCD, and exposes them as NFC tag text that a technician's phone can read without any network. The board's Linux side also computes a first relative performance index of the panel (measured current against a clear-sky model, relative to a clean-panel baseline) and sends it back to the display. It has not been calibrated in sunlight yet, and clouds lower it just like dirt does, so we do not claim it measures soiling.
How we built it
- Hardware: UNO Q 4GB with a Seeed Grove Base Shield, an AHT20 temperature and humidity sensor, a light sensor, an ACS70331 current sensor, a 16x2 LCD and a PN532 NFC module, plus a separate solar charging path (mini panel, Waveshare solar manager, LiPo). We drew an editable KiCad schematic of the prototype as built.
- Firmware: an Arduino sketch reads the sensors, drives the LCD, acts as an NFC tag, and streams readings once per second to the board's Linux side over the Bridge. A Python receiver there computes the performance index with a small pure-Python sun and clear-sky model, whose sun position our tests hold within 0.02 degrees of pvlib reference values, and sends the result back to the sketch. The round trip to the display is as reported by the firmware author.
- Software: a Python package (
poopvolt) imports and replays historical inverter logs from SOLARMA's open data (MIT licence): units checked, missing values kept missing (never turned into zero), outages reported rather than filled, and a replay that steps through the history in time order. On top of it, a comparison fits each inverter's typical ratio to its peers on the first part of the season and checks it on the later part (never overlapping), with an uncertainty band. - Edge Web UI & Live Telemetry Dashboard: A zero-build, responsive HTML5/CSS/Vanilla JavaScript frontend served directly by FastAPI from the UNO Q Linux container (
http://<board-ip>:8000/). The dashboard unifies real-time microcontroller telemetry streamed over the Bridge (temperature, relative humidity, light, panel current, and performance index via/api/station) with the visual inspection workflow. Mobile camera access is enabled via native HTML file capture (capture="environment"), avoiding browser streaming-permission barriers over local HTTP. - Computer Vision Pipeline (
poopvolt.inference): An edge-optimized, CPU-only OpenCV DNN ONNX inference engine (cv2.dnn.readNetFromONNX) running on 4 threads. It implements a strict export contract for YOLOv8-format models with letterbox aspect-ratio preservation, non-maximum suppression (NMS), and bounding-box unscaling. Crucially, the post-processor maps detected defect coordinates (dust, droppings) into their enclosing panel bounding boxes (panel_idspatial association) to produce actionable, rule-based maintenance recommendations. The adapter enforces startup model validation before declaring readiness; tests verify execution using a synthetic untrained graph. - Bounded Edge Storage & Privacy: An atomic filesystem storage layer (
poopvolt.storage) enforces strict edge constraints: maximum 12 MiB / 24 MP per image, MIME/header validation, and bounded FIFO retention (capped at 100 inspections or 250 MiB) so the device never exhausts flash memory. Every inspection generates a persistent, shareable local permalink (/inspections/{id}) to give technicians and plant owners an indisputable audit trail. - Evidence we measured or replayed:
- CPU-only inference on the UNO Q: NanoDet-Plus at 416x416 in 258 ms and YOLOX-S at 640x640 in 2.27 s (reference models, not our own).
- The SOLARMA export loads as 58,687 detail rows from 13 inverters, with 1,157 communication outages and no irradiance values.
- Replayed: of the 12 inverters with a baseline, 2 are flagged as producing unusually little compared with their peers (one stopped producing in late July; one fell about 25 % below its peers). Why is not in the data.
- Replayed, the improvement over today: inverter 1 kept logging but, on every complete daily record from 21 July to the end of the record on 3 October (65 days), it logged no output except on 26 July. Nothing in the data shows the output being restored in those 75 days. On the 30 days with a peer reference, it fell about 550 kWh short of its peers (a lower bound, because days without a reference are not counted). A daily peer check puts it below 70 % of its expected output on 21 July, its first day without production.
- Simulated: injecting a synthetic loss into the other inverters, it is flagged in all 10 tested cases from 8 % upwards, in 4 of 10 at 4 to 6 %, and mostly not at 2 %. We chose the flag threshold after seeing the data, so this is a demonstration of the method, not an independent validation. Charts and method: comparison results.
- Approximate prototype cost: about 145, from single-unit list prices. This is a prototype cost, not a production cost.
What works, and what does not (yet)
Working at bring-up level: sensors, LCD and NFC on the UNO Q; readings streamed to the Linux side; the performance index (implemented, not calibrated in sunlight); the SOLARMA importer and replay; the schematic and bill of materials. Working as a software slice: the Edge Web UI dashboard (live station telemetry polling, mobile-optimized camera capture, side-by-side comparison workspace, togglable SVG annotation overlays, panel isolation dropdown, and shareable permalinks) and the computer vision pipeline (bounded storage engine, OpenCV DNN ONNX inference engine with 4-thread execution, strict YOLOv8 export contract validation, and defect-to-panel spatial mapping). Its home page offers a labelled "illustrative demo" with sample imagery and simulated annotations to preview the full user flow. Working as a scoped demo on replayed data: the peer comparison with its uncertainty band, plus a labelled synthetic-loss test.
Not implemented at the time of writing: a weather-adjusted theoretical expected production (the replayed data has no irradiance), a trained phone-photo soiling model (so no real detections or accuracy figure), a maintenance proposal output and the 3D-printable enclosure. At the 13:00 checkpoint there was no labelled photo set, no trained soiling model and no STL file in the repository, so we do not claim them. Where the video or the demo shows these, they are labelled as simulations or design concepts. The solar charging path is wired but not yet verified in sunlight.
Challenges
Our thermal camera and one solar charger were unavailable, so we switched to a phone RGB camera and a different charger. The historical data has no irradiance and no verified string layout, so it cannot support a weather-adjusted baseline or any claim about individual strings; we say so instead of inventing one. We also kept phone-photo simulation and historical replay apart: they come from different plants and times and are not evidence of each other.
What we learned
Doing less honestly beats claiming more. Tracking whether each number is measured, replayed or simulated shaped the design as much as any sensor choice.
What is next
Define a weather-adjusted expected-production reference with a service company, run the comparison on our own panel as well as on replayed data, train and evaluate a soiling classifier on a labelled phone photo set behind the existing inspection page, calibrate the performance index in clear sun, and add a technician-reviewed output.
Built with and reuse
We built the firmware, the importer and replay, the peer comparison, the phone
inspection service and page, the wiring record, the schematic and the
documentation during the hackathon. We reuse the Arduino UNO Q tooling and
libraries, the Adafruit and Grove drivers, SOLARMA's MIT-licensed data (notice
kept in data/solarma/NOTICE.md), and open tools such as FastAPI, OpenCV,
ONNX, KiCad, uv and pytest. The full list is in project status. The
repository is MIT licensed.
Beyond Solar requirements check
Each challenge requirement, the evidence in this draft, and what is still weak. Adapted from the requirement mapping of the earlier SunCheck work breakdown.
- A PV panel with at least one other component. Covered: mini panel, solar manager and LiPo, with panel current read by the ACS70331 on A1. The charging path is not yet verified in sunlight.
- Collect data from the system or the environment. Covered: temperature, humidity, light and panel current on the UNO Q, plus the replayed SOLARMA inverter logs.
- Interpret data locally and produce a concrete response. Partly covered. The board shows readings on the LCD and as NFC tag text, and its Linux side computes a relative performance index that goes back to the display (as reported by the firmware author; not yet calibrated in sunlight, so it is not evidence of soiling). The peer comparison uses only the Python standard library, so it can run on the board's Linux side, but it has not been run there. Its response is a list of inverters to inspect. Run it on the board before submitting, or say in the description where it runs.
- Start from a well-defined user, context and problem. Covered: the owner of an older plant and the service company that maintains it. Validation with the Coesa mentor (issue #13) is still open.
- Show the improvement with a practical test and numbers. Covered on replayed data. The evidence list now states it for the replay: inverter 1 produced nothing for 75 days without being restored, and a daily peer check points at it on the first day. It is still one inverter in one plant, and the 70 % rule was chosen after seeing the data. Issue #35 should carry the same number.


Log in or sign up for Devpost to join the conversation.