Inspiration
The Philippine government funds thousands of infrastructure projects every year, from roads and bridges to flood control and water systems. While the Department of Public Works and Highways (DPWH) publishes project data, the sheer volume makes it difficult for ordinary citizens to identify which projects deserve a closer look.
We built Pondo Watch to make that data more useful and accessible. Pondo means funds in Filipino, and our goal is to help people understand where public infrastructure money goes.
What it does
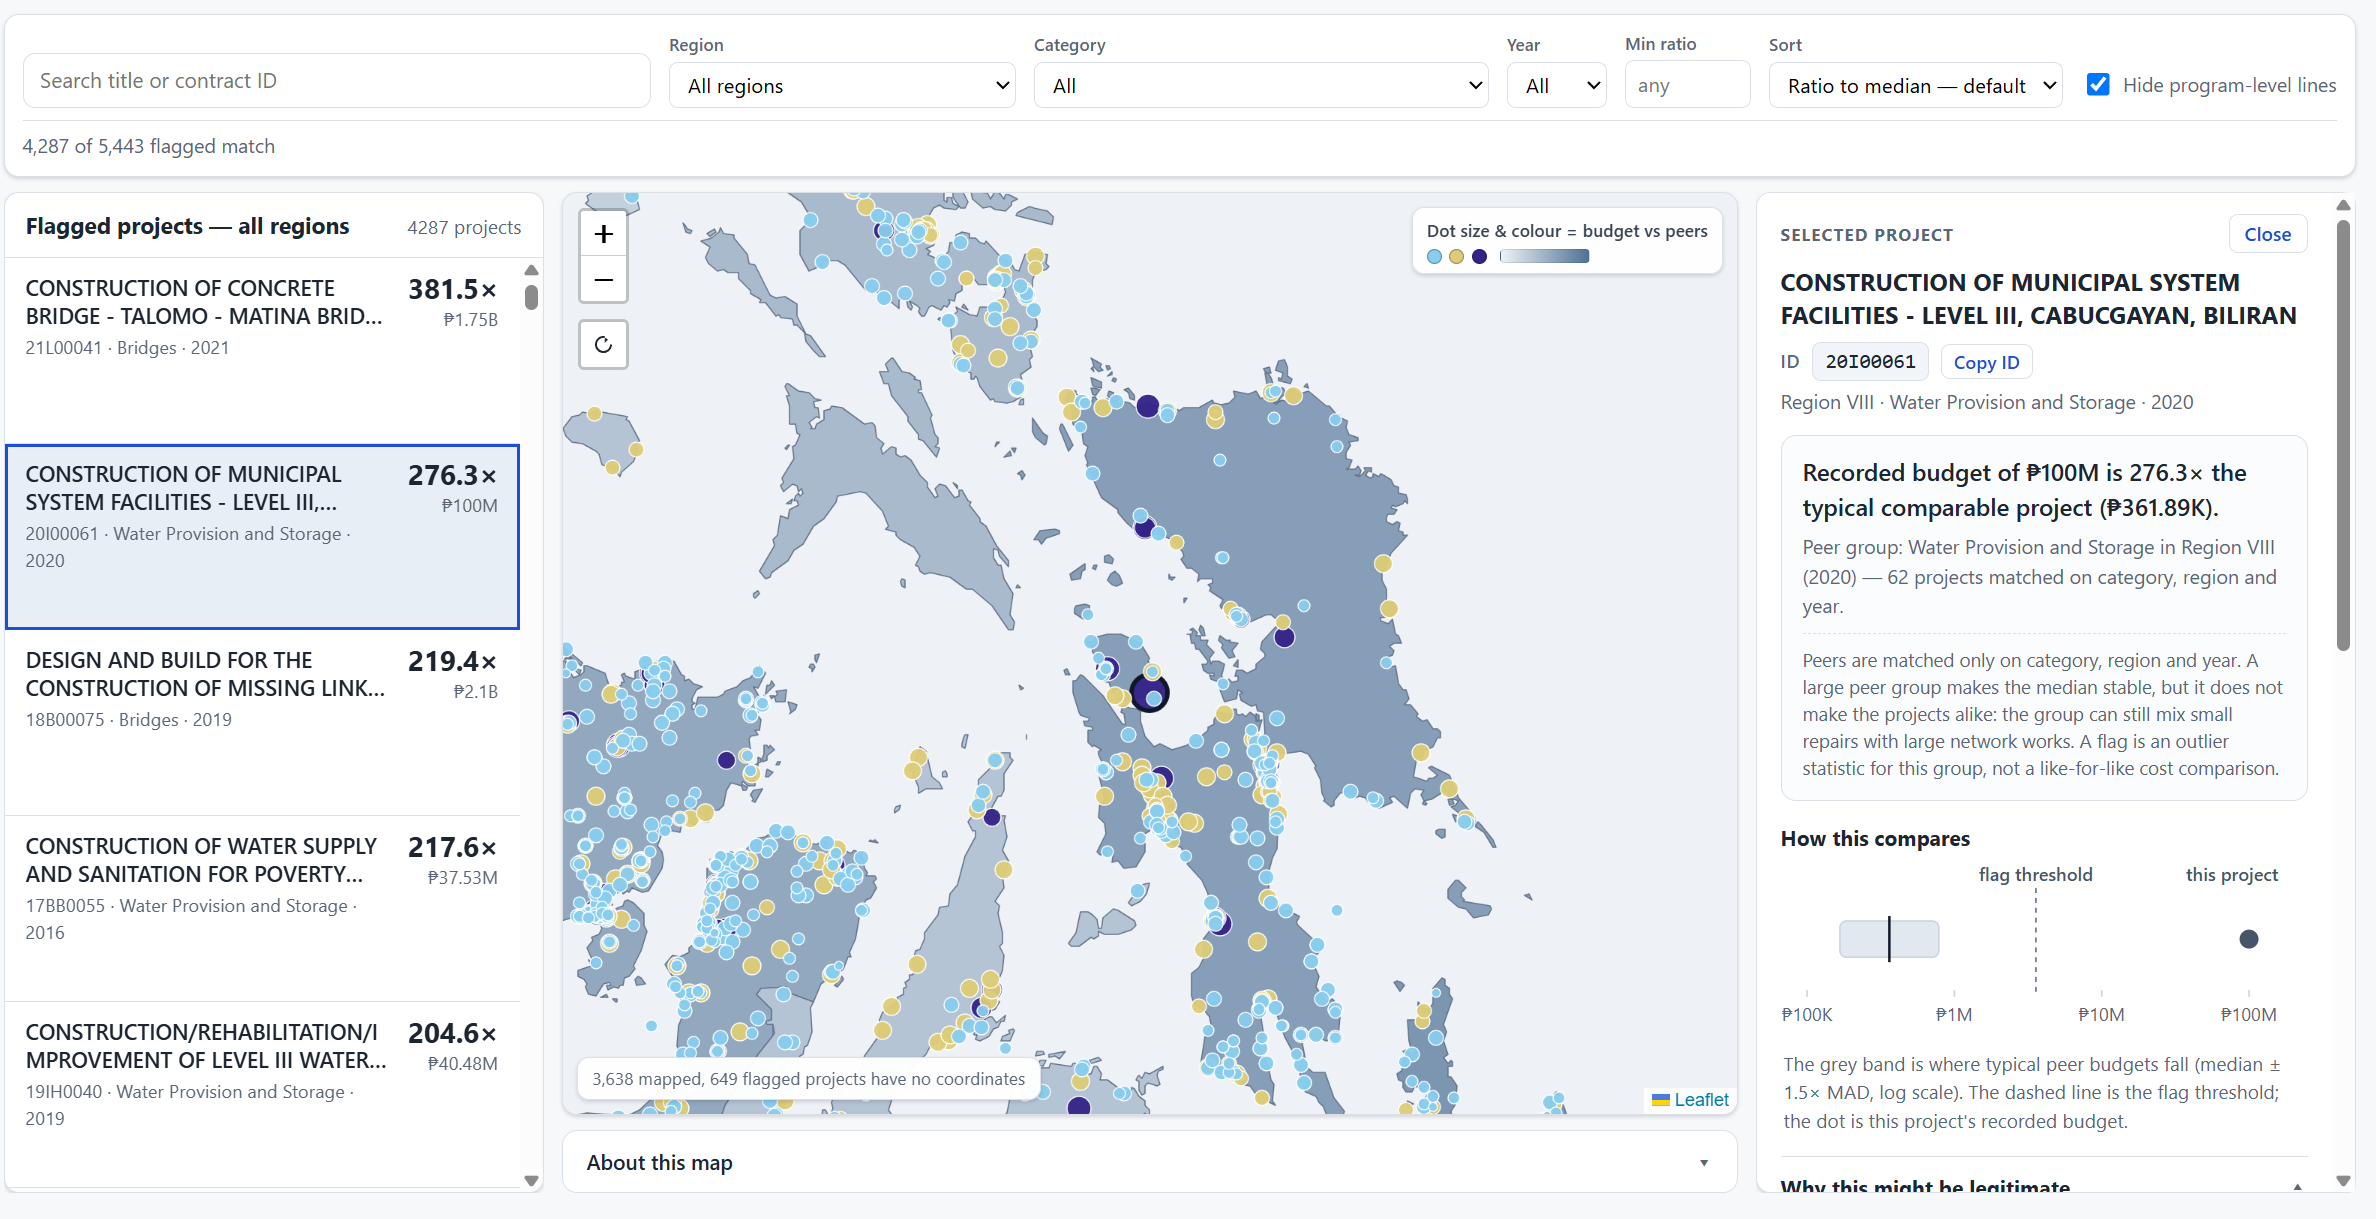
Pondo Watch analyzes DPWH infrastructure project budgets and flags projects that are unusually expensive compared with their peer groups. Instead of relying on arbitrary peso thresholds, it uses robust statistics to compare projects within the same category, region, and infrastructure year.
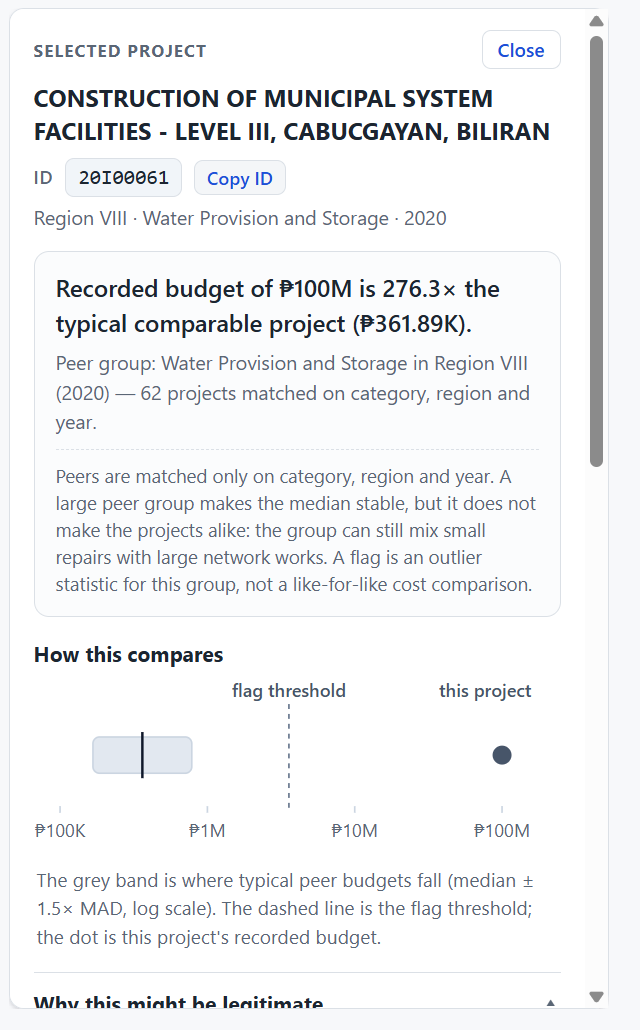
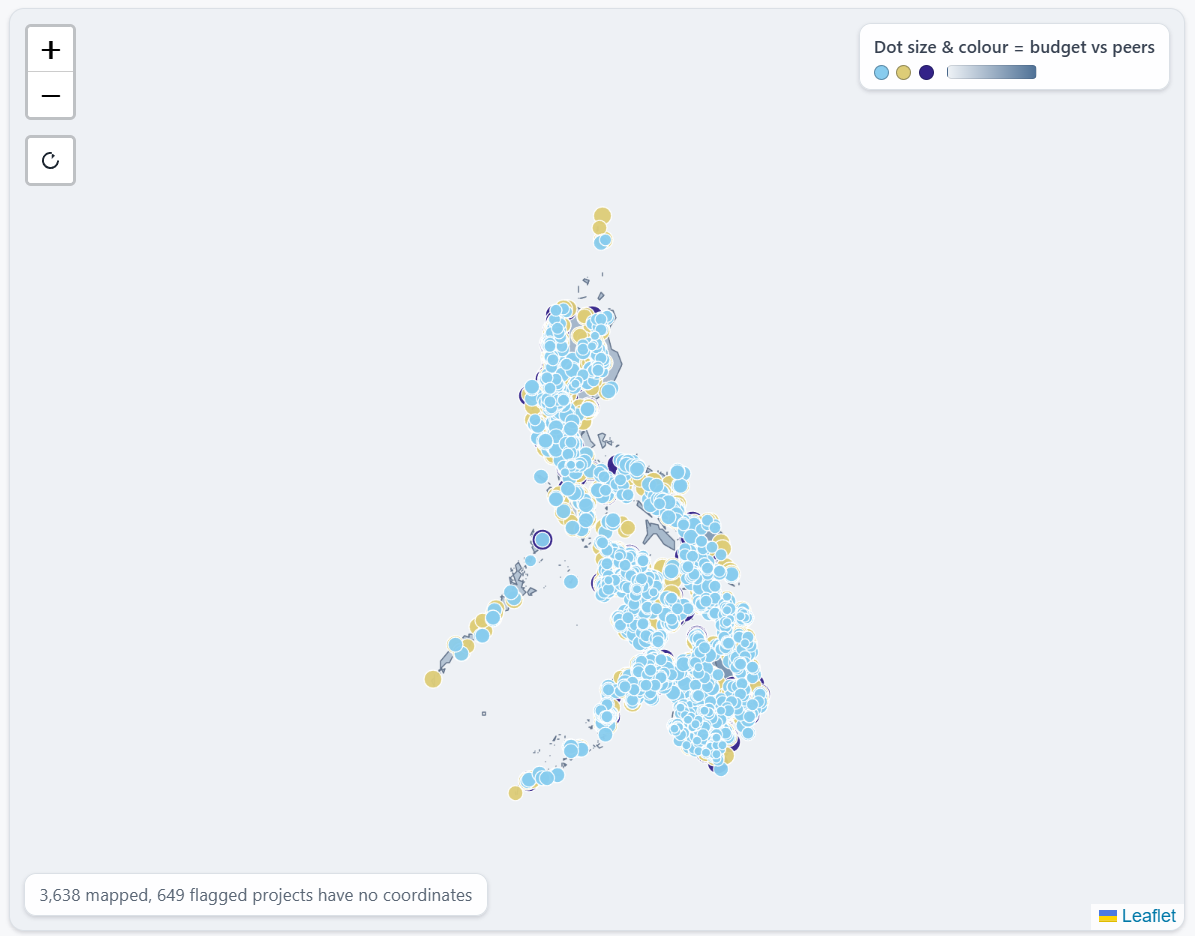
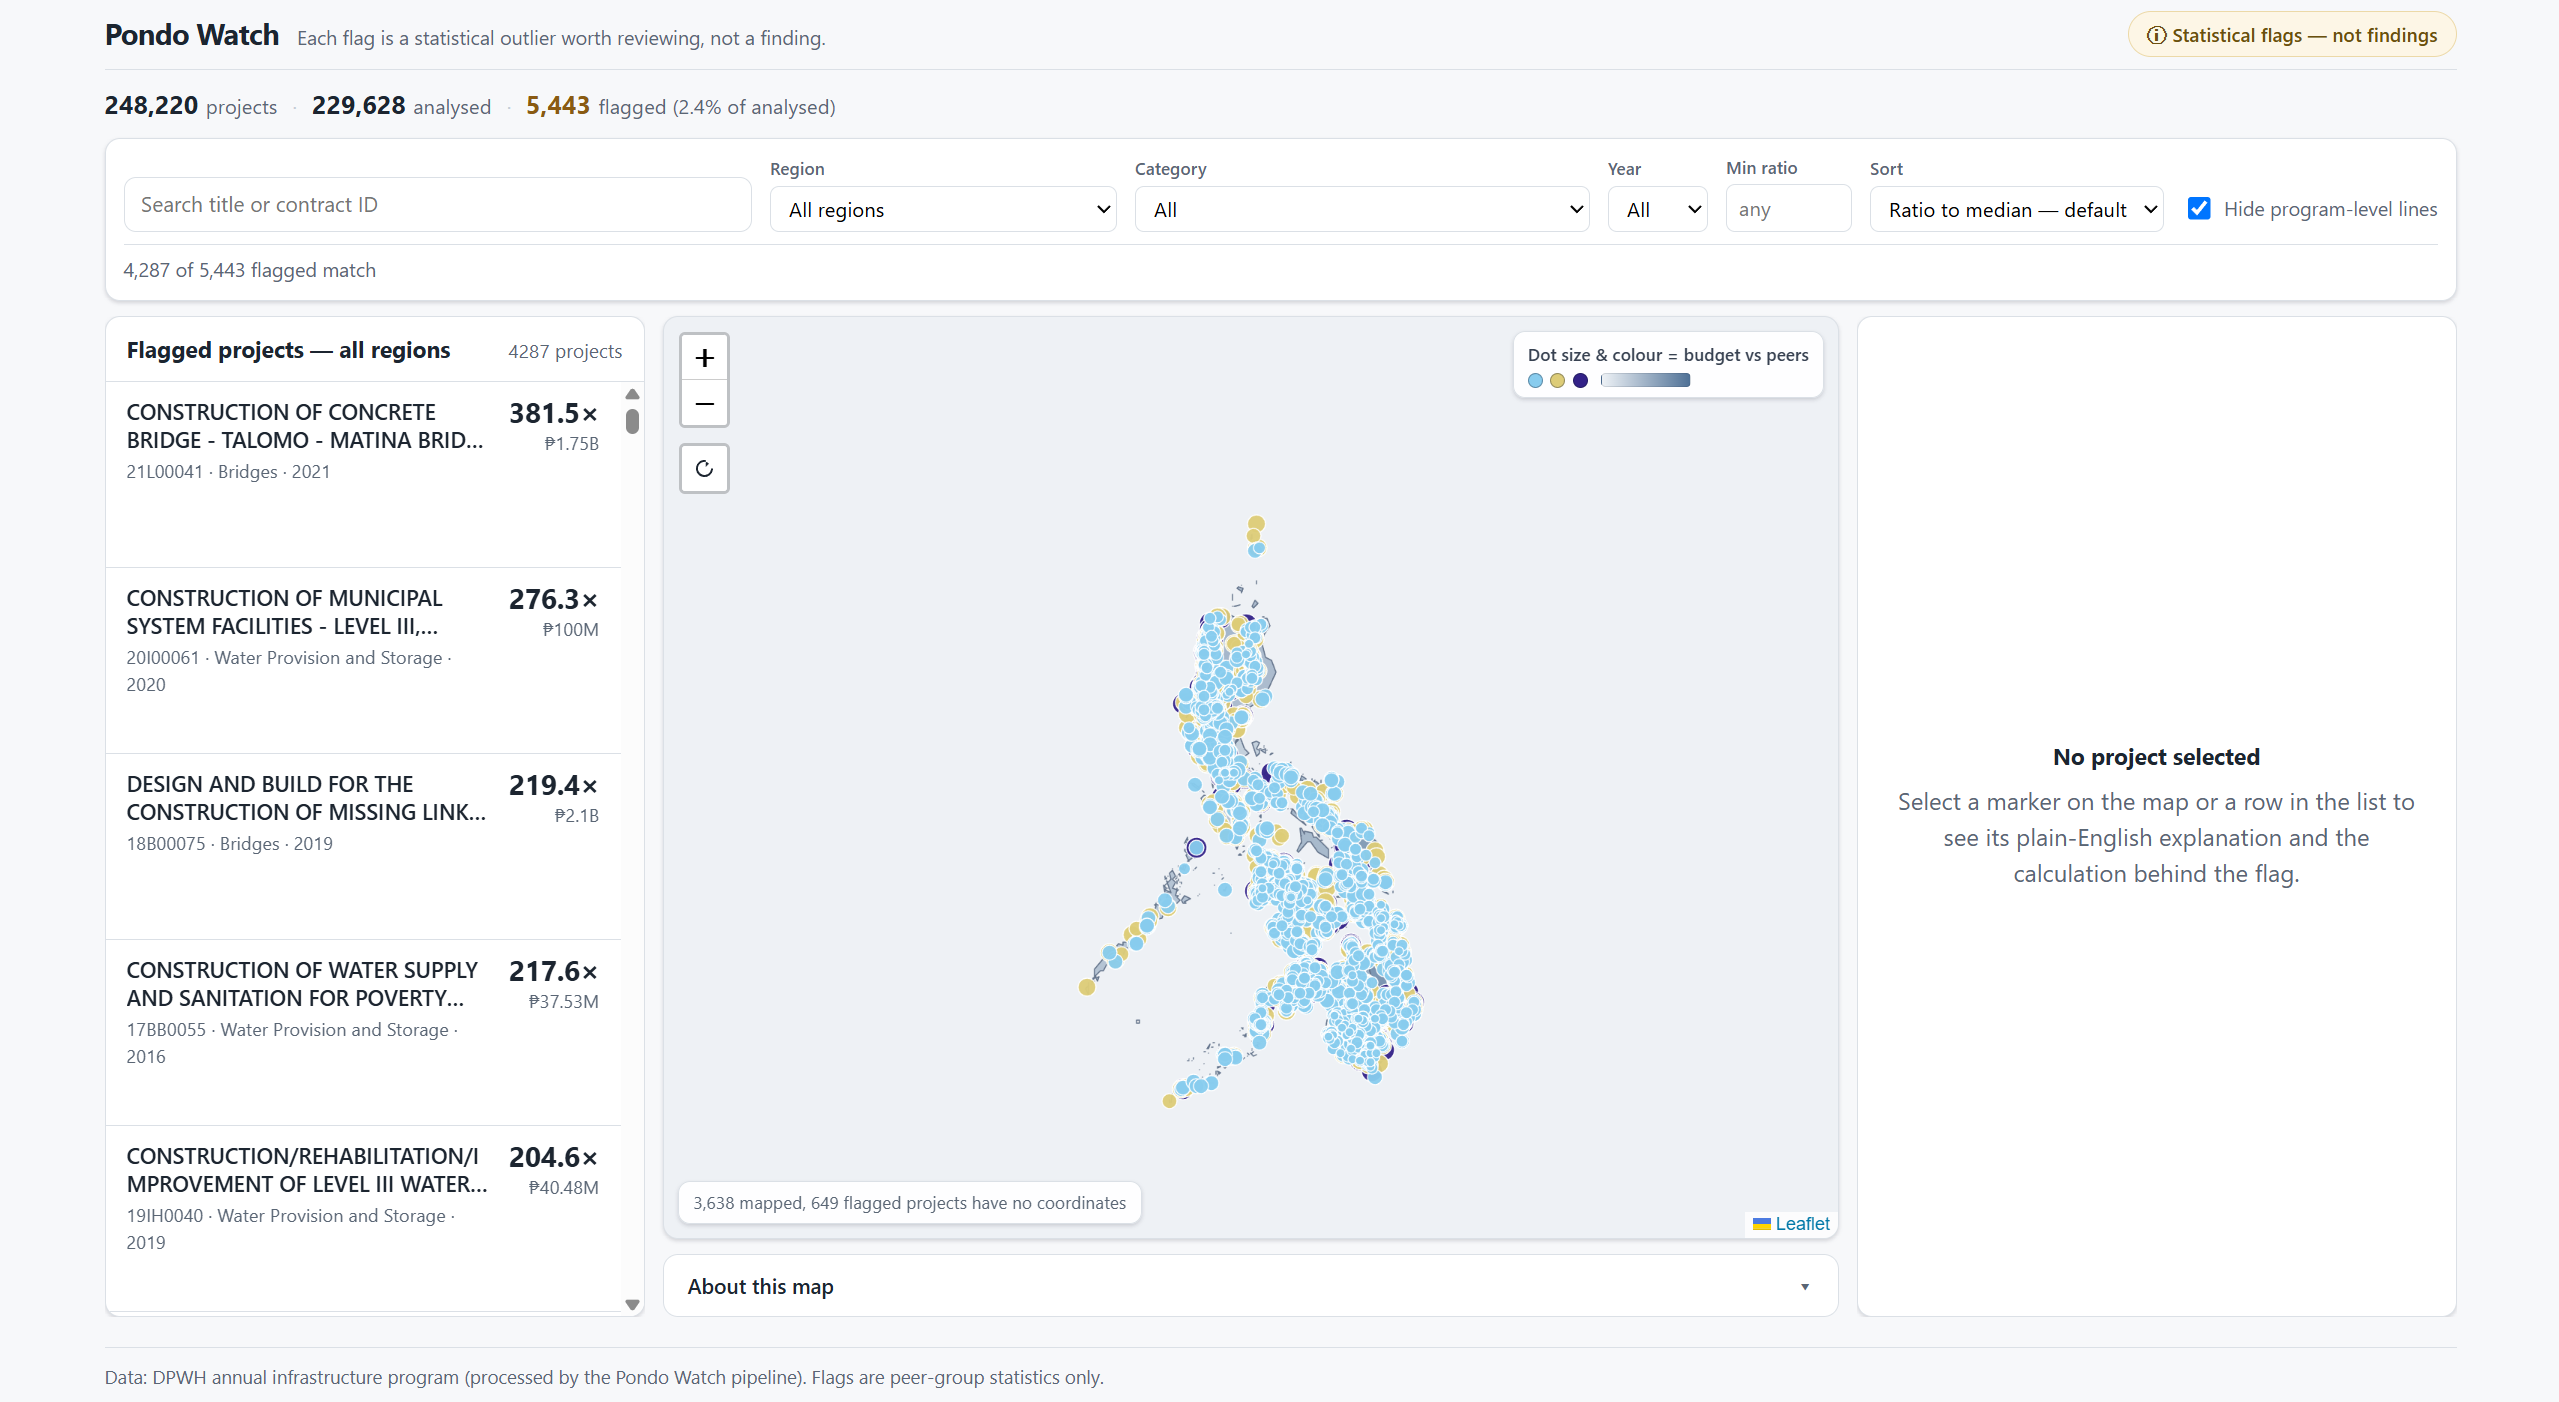
The dashboard includes a map, a searchable list of flagged projects, and an evidence panel showing the peer-group median, statistical spread, modified z-score, and flag threshold.
Most importantly, a flag is a screening signal, not proof of overpricing or corruption. Every result is intended to support further investigation, not replace it.
How we built it
We built a data pipeline in Python to clean and filter project records, detect budget outliers using the median and median absolute deviation (MAD), and export the results as JSON. The frontend uses React, Vite, and Leaflet to visualize flagged projects geographically and make the results easy to explore.
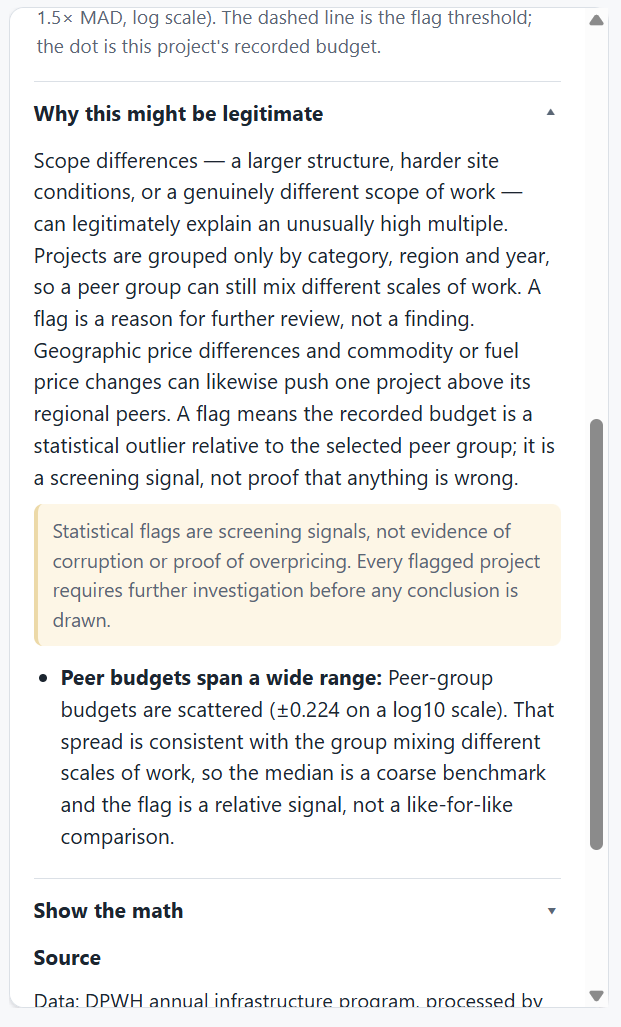
We also prioritized explainability: users can inspect the calculations behind a flag and see reasons why a project's unusually high budget might still be legitimate.
Challenges we faced
One of our biggest challenges was making fair comparisons. Projects within the same category and region can still differ significantly in scope, size, and construction requirements. A statistically unusual budget does not automatically mean that a project is overpriced.
We addressed this by exposing the peer-group details and calculations, explaining the limitations of the comparison, and avoiding claims that the data cannot support. We also had to make a large dataset usable in a responsive dashboard without loading every project into the browser.
What we learned
We learned that data analysis is not just about finding anomalies. It is also about understanding what the data can and cannot prove, presenting results clearly, and making the reasoning open to scrutiny.
With Pondo Watch, we hope to make public infrastructure data easier to investigate and help citizens, journalists, and auditors focus their attention where further review may be warranted.
What's next
We hope to expand coverage to more public datasets, connect project records to supporting documents, and introduce tools that help reviewers track findings over time.
Built With
- data
- javascript
- leaflet.js
- numpy
- pandas
- python
- react
- statistic
- vite


Log in or sign up for Devpost to join the conversation.