-
Screenshot of a search
-
Screenshot of a search
Inspiration
How can individuals strive to combat global warming? Today’s consumer is concerned about ecological issues and continually seeks to make smarter, sustainable choices. Pompeii Solutions is a web-based service that offers consumers an accessible, visually striking way to better understand how the food we eat impacts the environment.
What it does
Our service helps users identify different food items' carbon footprint, that is, the quantity of greenhouse gas emissions produced by growing, farming, processing, storing, packaging and transporting food, from the farm to our plate. While there exists many databases that compile the carbon footprint of different products, most of these are inaccessible to the average consumer. Furthermore, even when available, these numbers may not help the individual decide what to purchase. While most people are aware of the general guidelines for greener living (e.g. purchasing local food), the issue is often much more complex.
How our app works
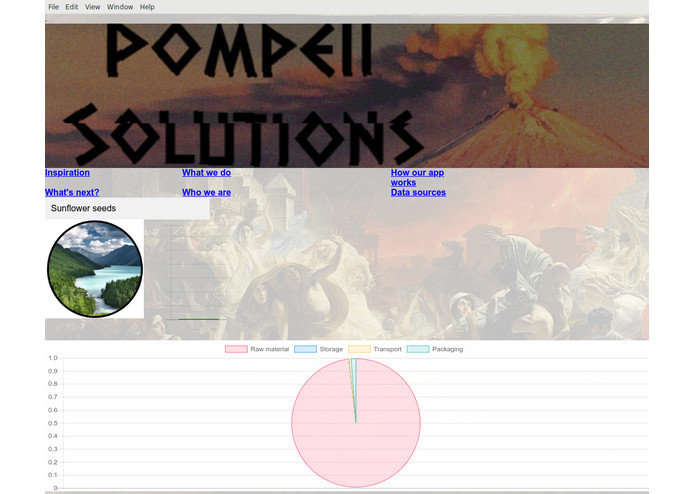
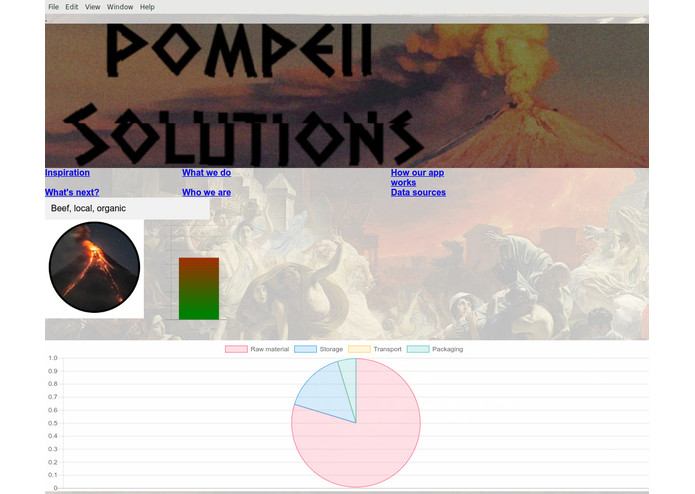
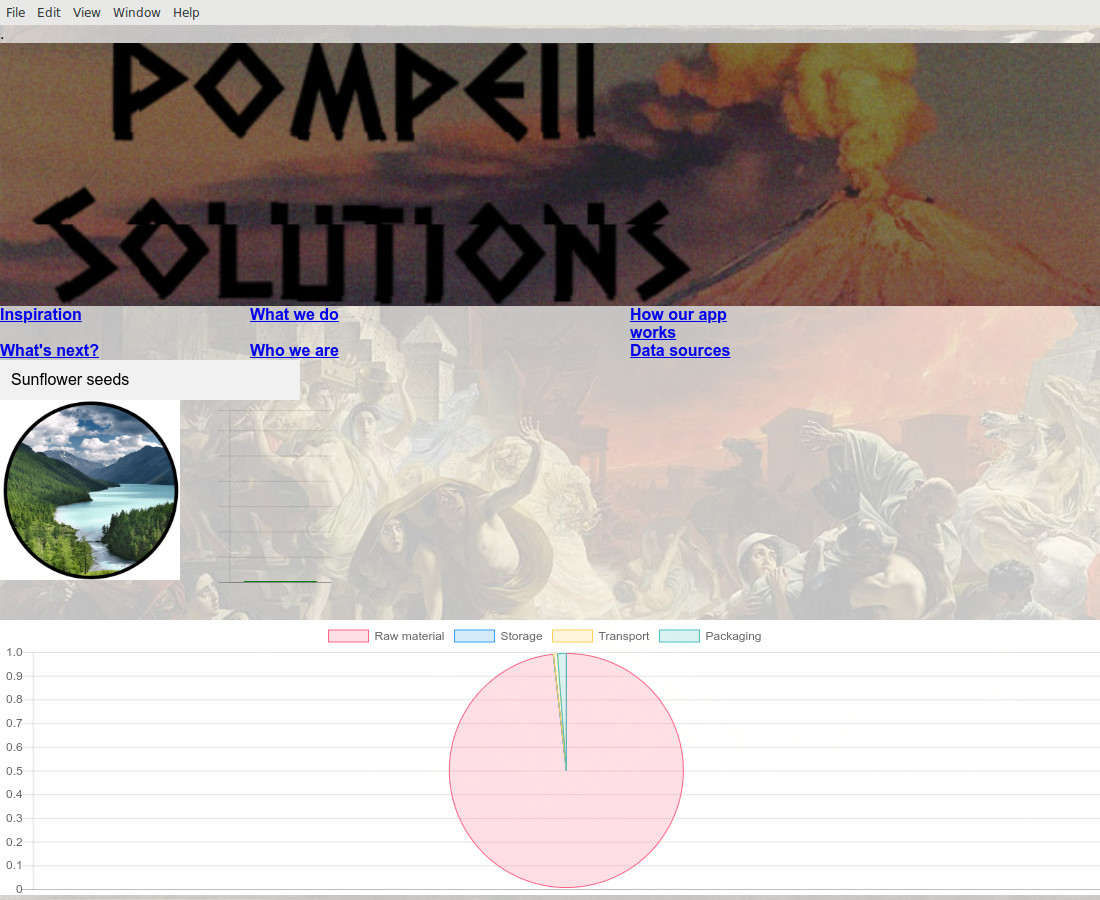
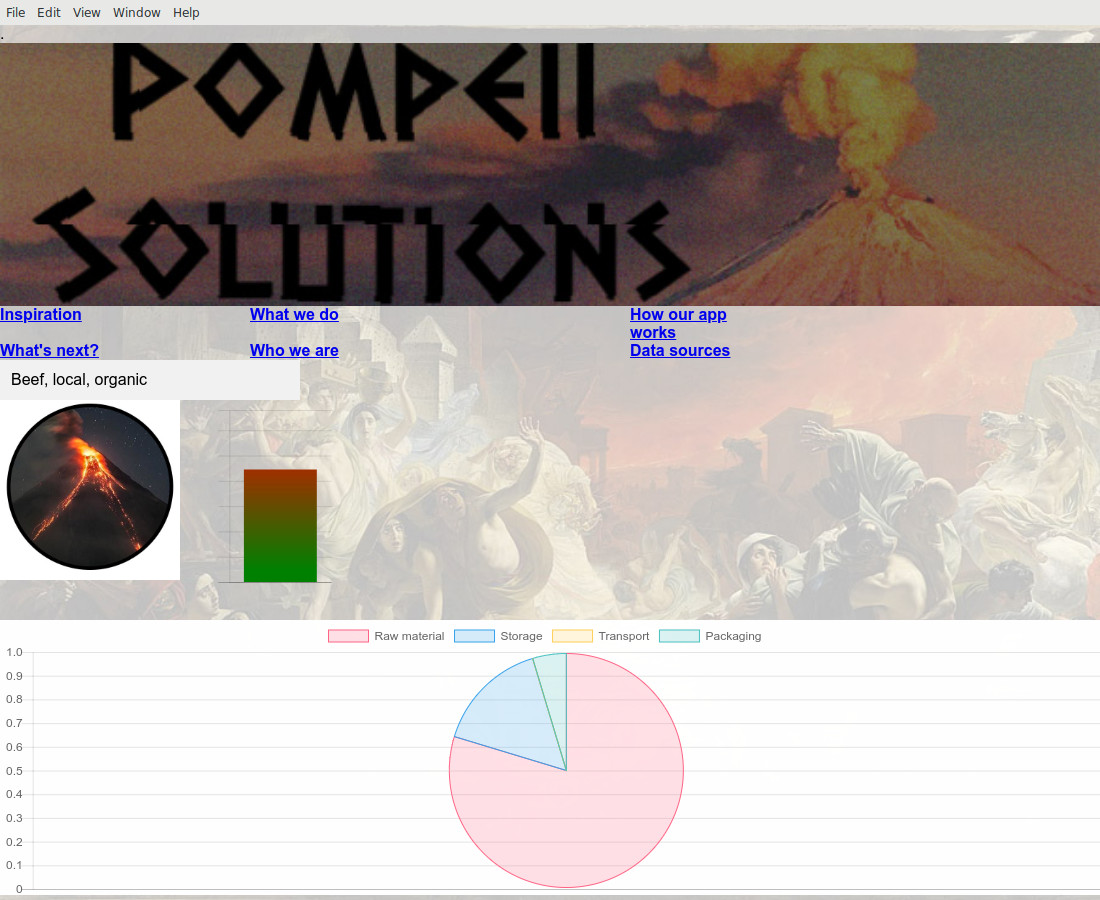
The user simply needs to input in the search bar the name of the item they desire and select the corresponding option from the scroll down menu. The program will search the database and display the carbon dioxide equivalent, a specific measure used to describe how much greenhouse gas is produced (and subsequently, its impact on global warming). The result is then converted to an index and assigned to one of four categories: very low impact, low impact, moderate impact or high impact. For the more savvy or curious users, the program also displays a pie chart showing the source of the emissions – costs of cultivation and harvesting as well as the costs associated with storing, packing and transporting the produce. We hope to help consumers better understand the whole “farm-to-plate” process and visualize how different food items impact the environment.
What's next for Pompeii Solutions?
In the future, we hope to increase the ease of use and interactivity of our web application. We wish to include a scanner function with which the user can scan the desired item’s bar-code (instead of manually typing the item’s name). To help the user when making a purchase, a future version of the app could display side by side comparison of two desired products. Finally, we could include additional metrics, such as water consumption in order to provide a deeper analysis.
Who we are
We are Team Pompeii: Vincent Magnoux, Marie-Anne Prud'homme and Justine LaFerrière
Where does the data come from?
Main databases:
Academic sources:
- Lukas, M., Rohn, H., Lettenmeier, M., Liedtke, C. and Wiesen, K. 2016. "The nutritional footprint - integrated methodology using environmental and health indicators to indicate potential for absolute reduction of natural resource use in the field of food and nutrition", Journal of Cleaner Production vol 132
- Pandey, D., Agrawal, M. & Pandey, J.S. 2011. "Carbon footprint: current methods of estimation", Environmental Monitoring and Assessment No 4, vol 178, pp. 135-160
- Virtanen Y. et al. 2011. "Carbon footprint of food - approaches from national input-output statistics and a LCA of a food portion", Journal of Cleaner Production, No. 16, vol. 19, pp. 1849-1856
- Röös, E. 2013. Analysing the carbon footprint of food - Insights for consumer conmmunication. Doctoral Thesis, Faculty of Natural Resources and Agricultural Sciences, Department of Energy an Technology, Swedish University of Agriculture Sciences, Uppsala, Sweden


Log in or sign up for Devpost to join the conversation.