
PolyHedge: Your Portfolio's Hidden Bets on Polymarket
Every stock portfolio is secretly a prediction market position. If you hold tech stocks, you're implicitly betting against recession, for continued low rates, and on AI growth, behind the scenes. PolyHedge makes these hidden bets visible, finds where your portfolio disagrees with Polymarket's crowd wisdom, and sizes hedges to protect you.
The Problem
Traditional portfolio holders have no idea how their positions map to real-world event outcomes. A portfolio heavy in TLT and XLE carries implicit bets on Fed rate policy and oil prices, but these exposures are invisible, unhedged, and unpriced.
Meanwhile, Polymarket offers liquid, real-time probability pricing on exactly these events. There's a bridge missing between TradFi holdings and prediction market insights, one that would let any investor see what they're really betting on, and hedge the risks they didn't know they had.
The Solution
PolyHedge is an end-to-end analytical engine that translates any equity/ETF portfolio into Polymarket-denominated exposures, detects divergences between your portfolio's implied view and the crowd's pricing, and generates sized hedge recommendations.
High-Level: How It Works
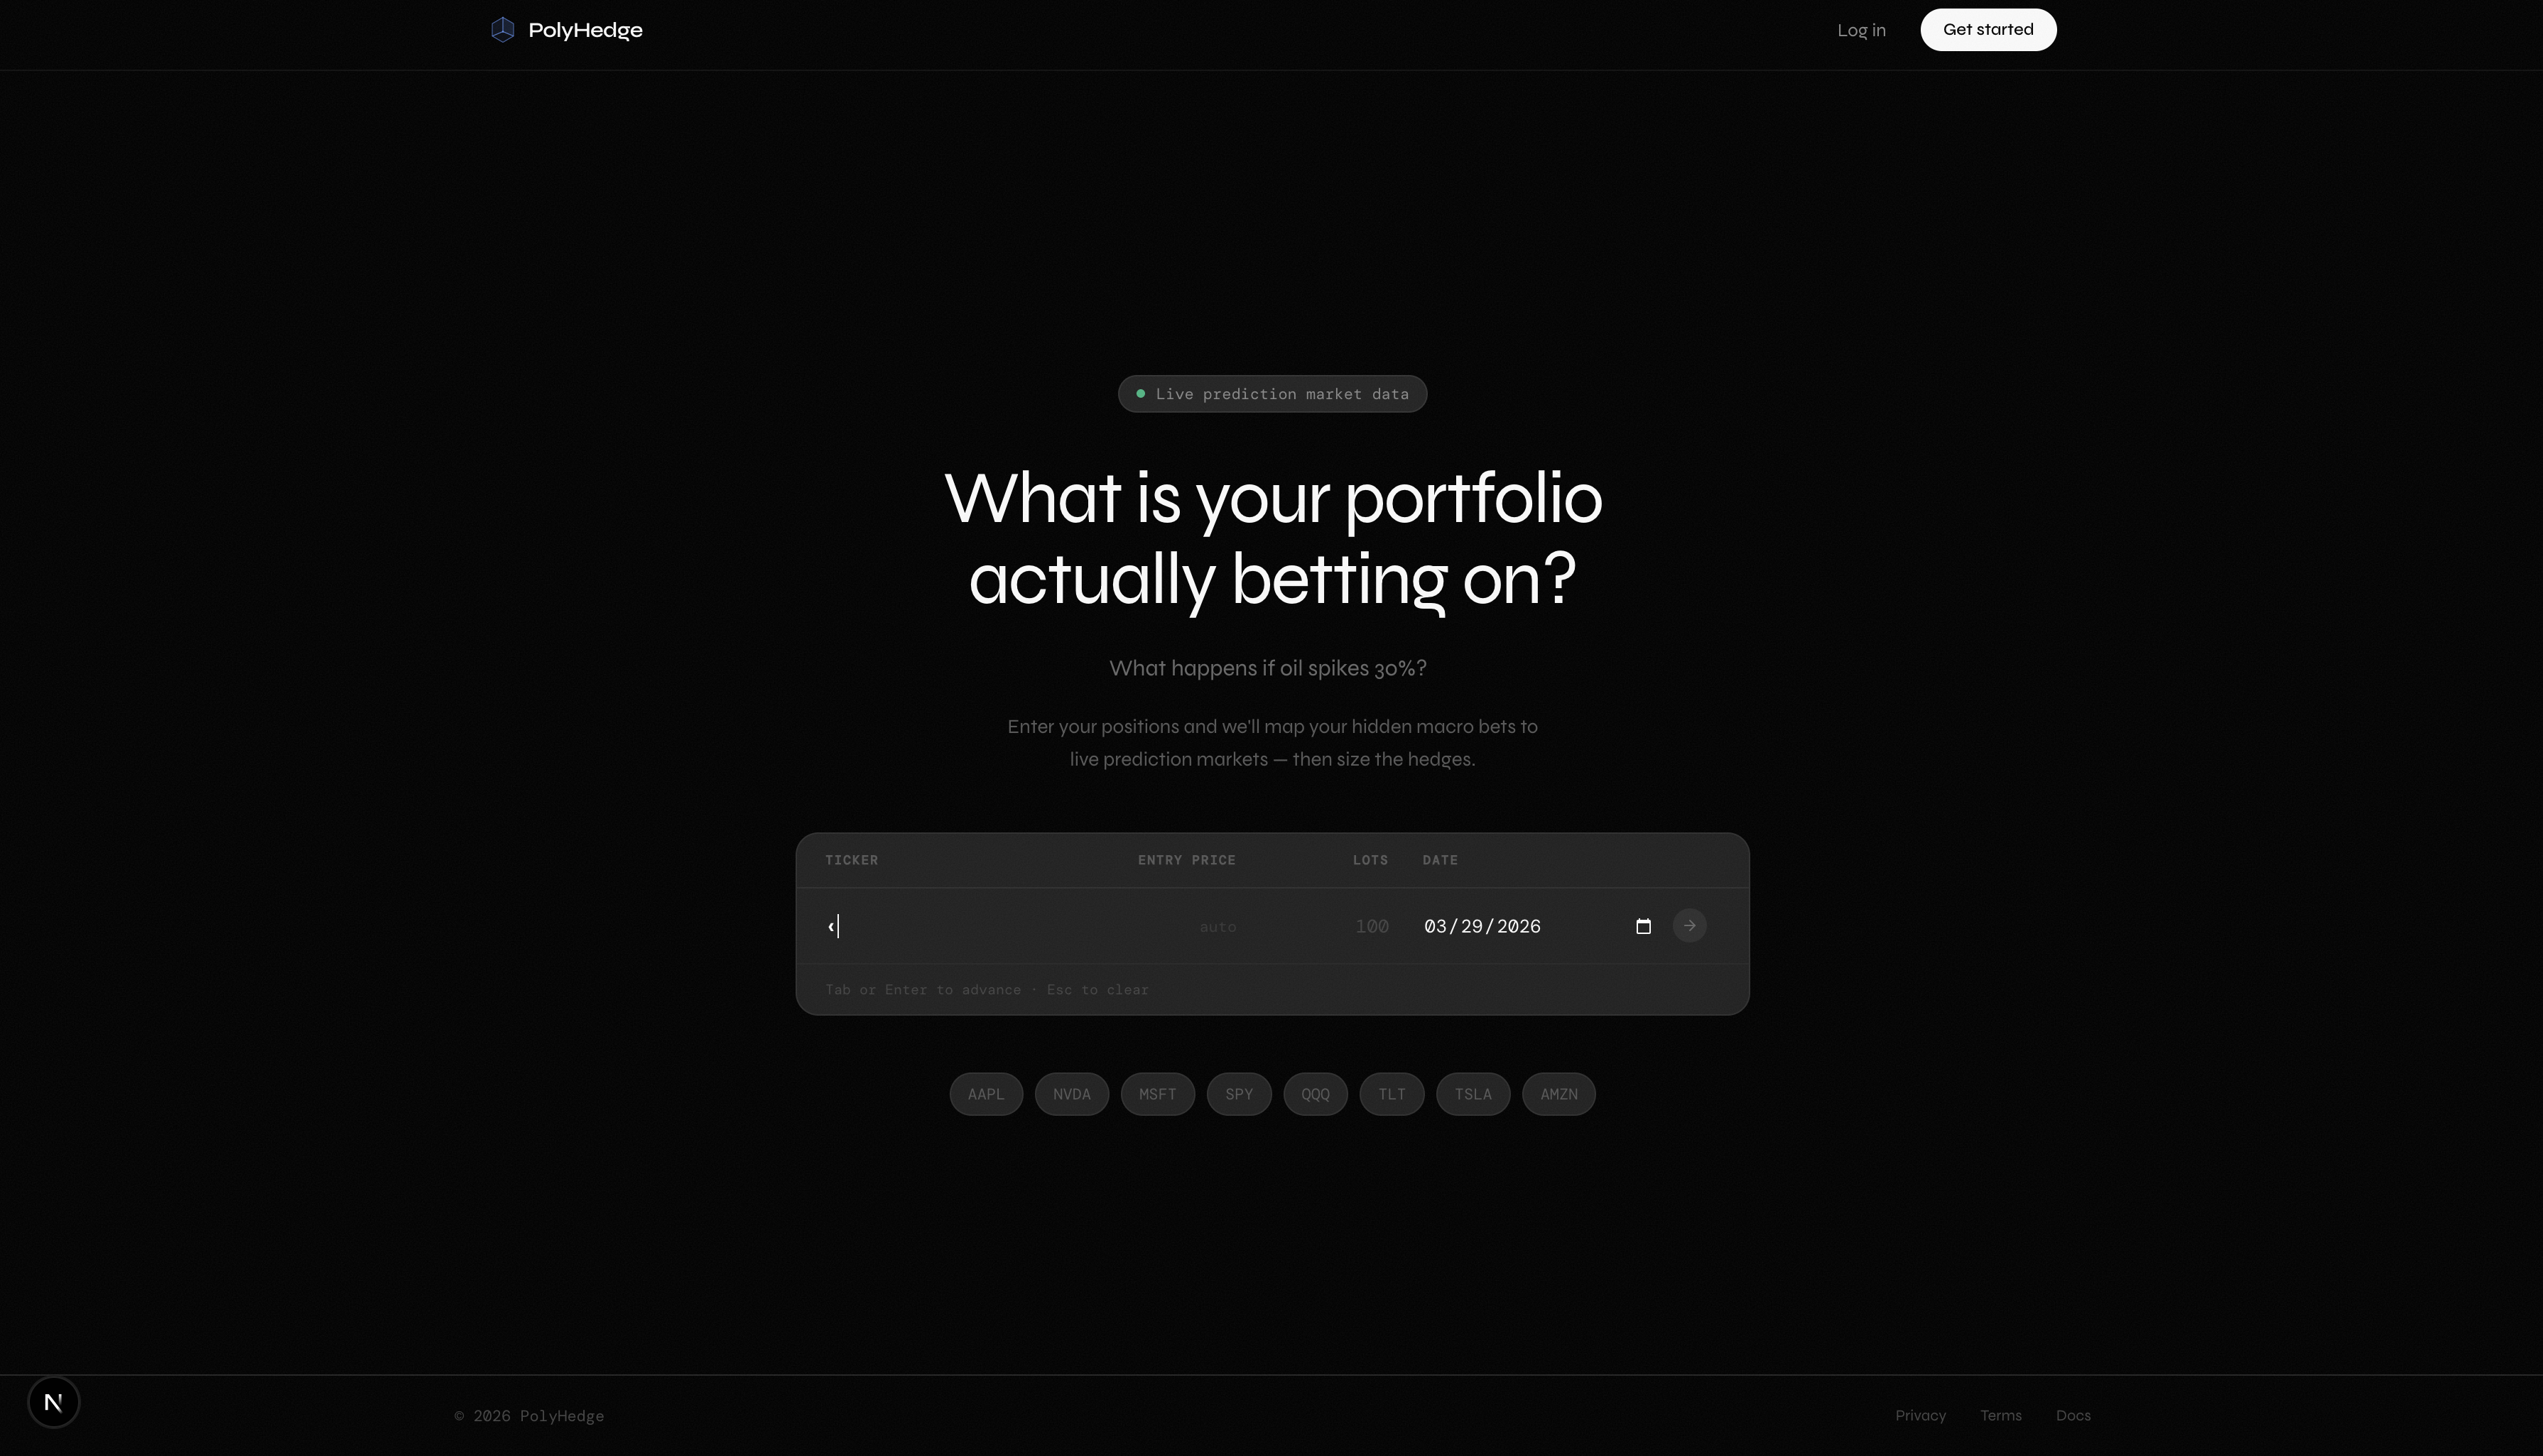
Users enter their portfolio tickers, position sizes, and entry dates on the web with real-time ticker validation and auto-filled prices.
Holdings regressed against 18 economic factors (equity style, rates, inflation, credit, commodities, yield curve) using OLS. This produces a beta (sensitivity) for each factor per holding.
Per-holding betas are weighted into a portfolio factor profile. The exposure tells you "how many dollars you gain/lose per 1-sigma move in this factor."
Each factor maps to Polymarket categories via a static keyword taxonomy, generated by analysis on cached unclassified markets.
Compares TradFi implied probability vs Polymarket price. Divergences are classified into signals for hedging, discounted by confidence.
Position size is optimized via Quarter-Kelly criterion with caps and correlation adjustments for overlapping factor exposures.
Details
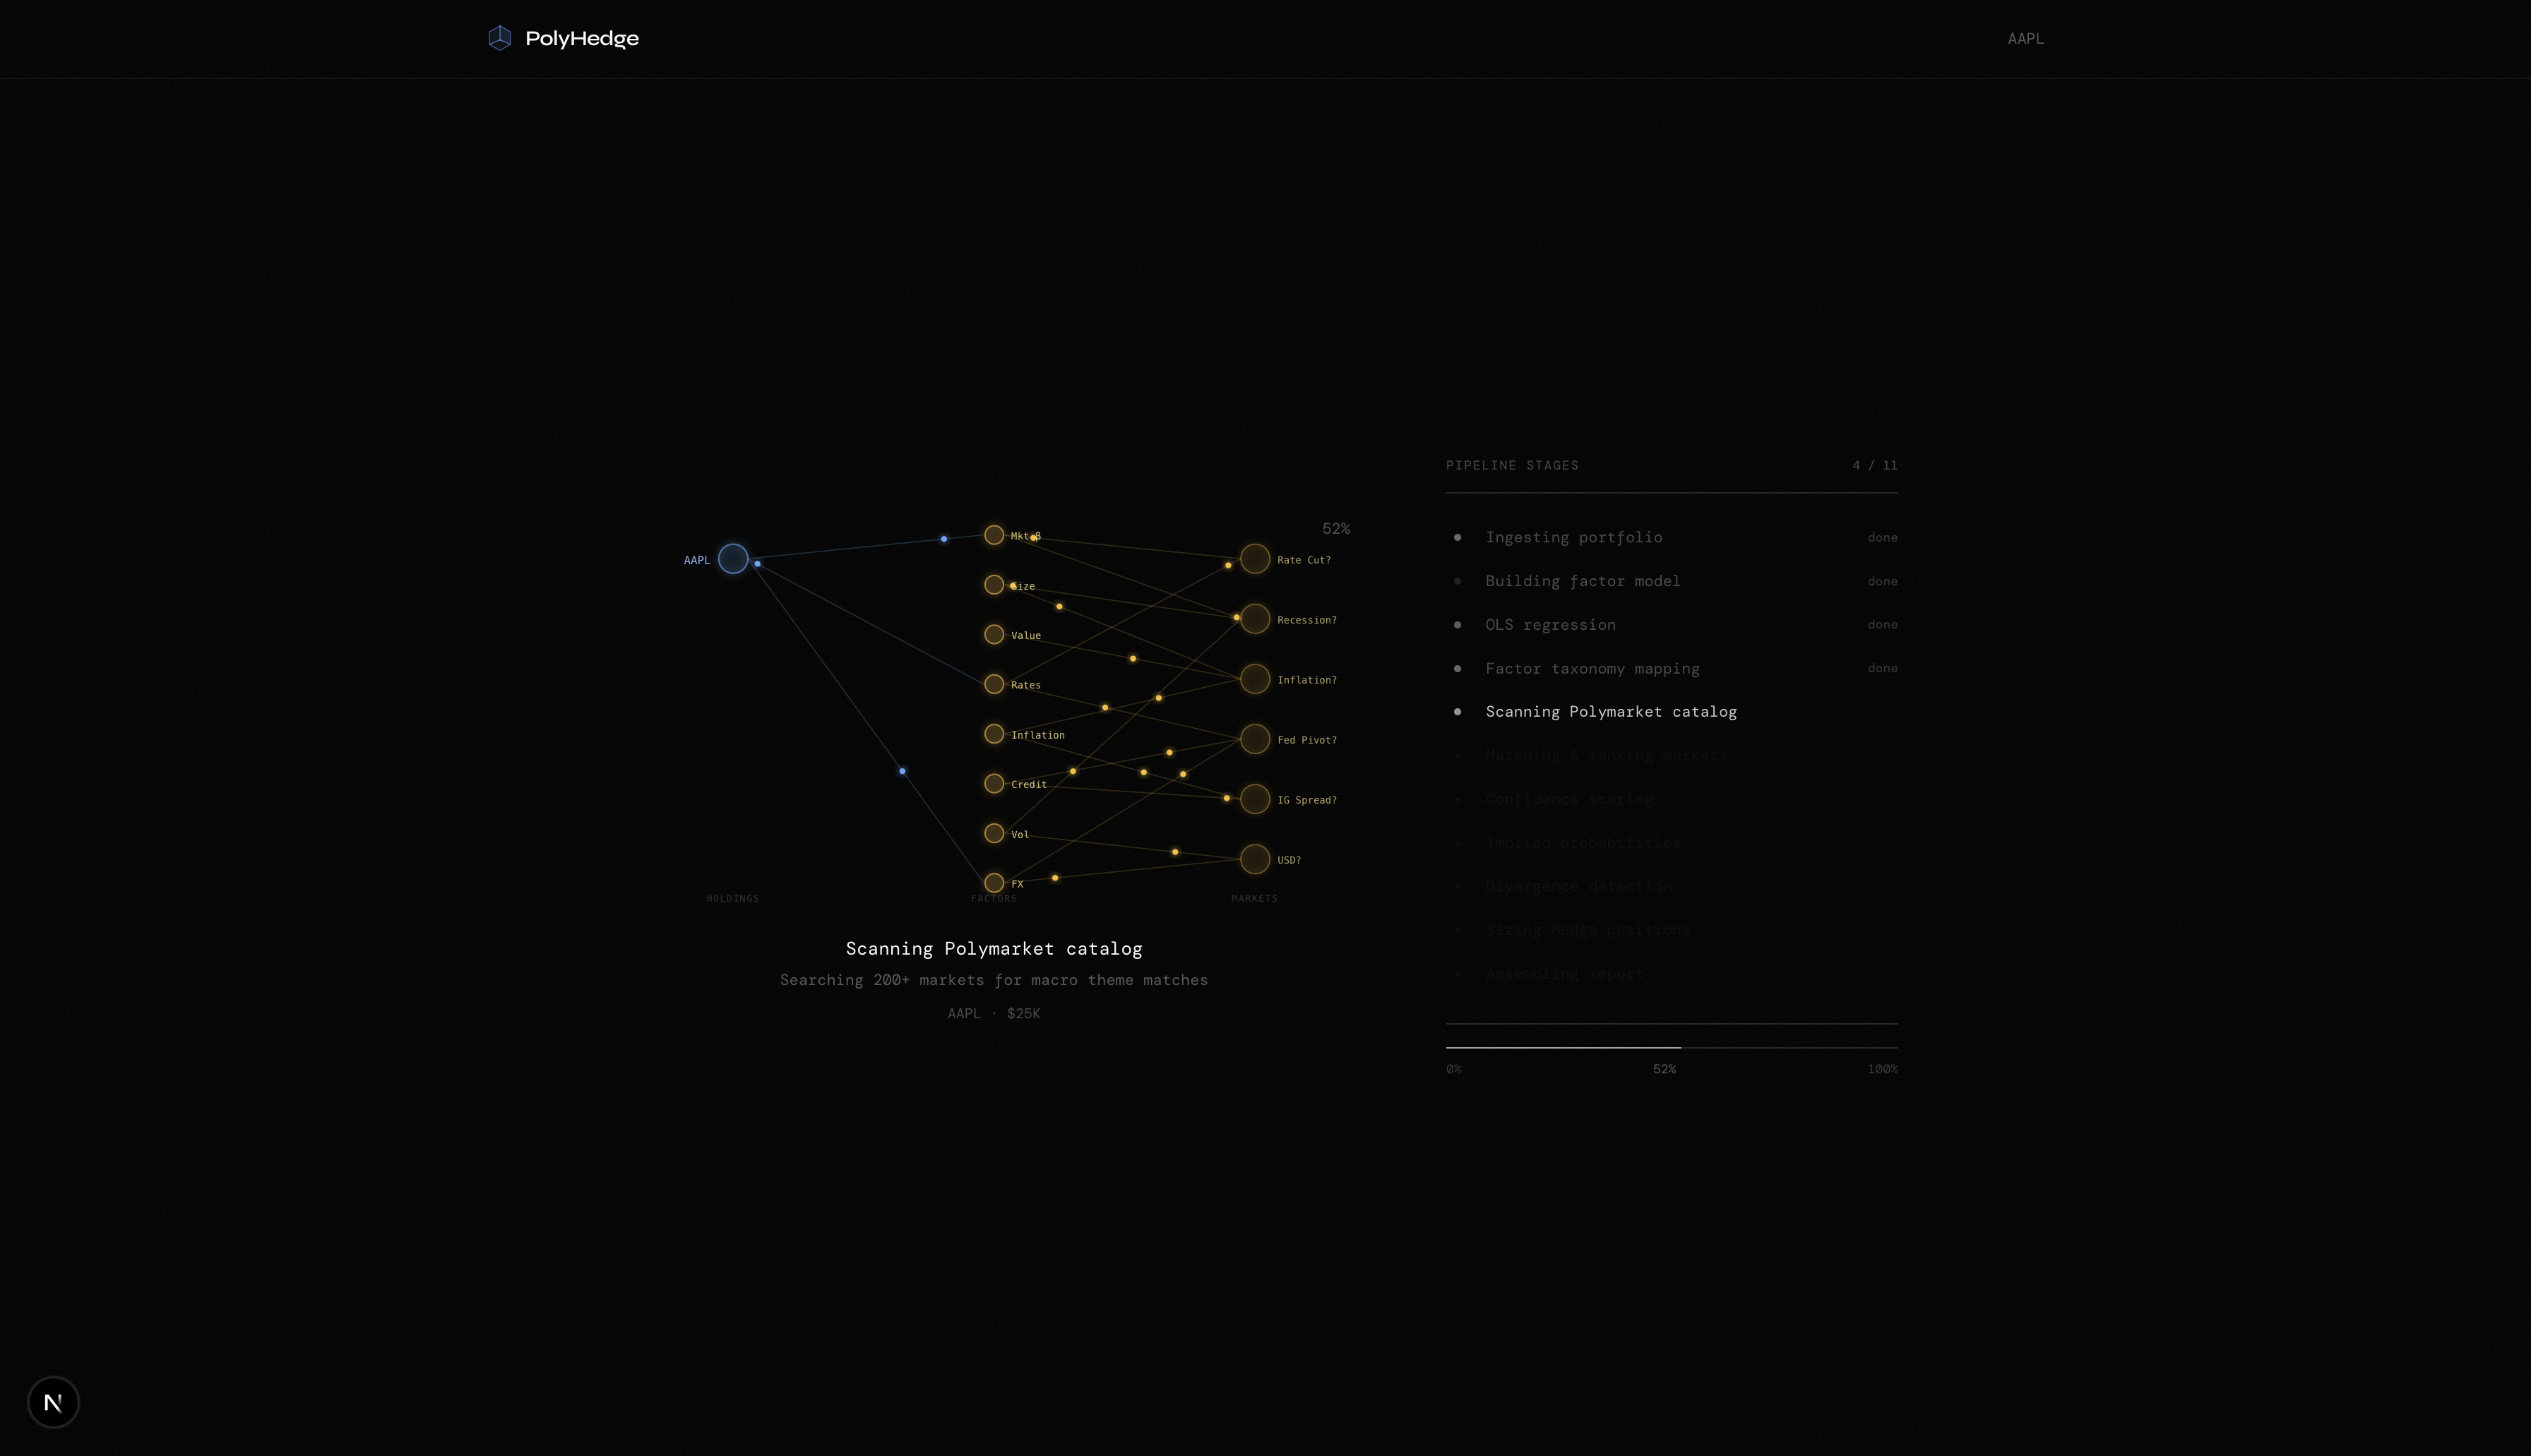
PolyHedge's Python backend runs an 11-stage quantitative pipeline:
Stage 1–3: Factor Decomposition
Your portfolio is decomposed into exposures across 18 orthogonalized macro factors using OLS regression with Newey-West standard errors:
- Equity style: Market, Size, Value, Profitability, Investment, Momentum (Ken French)
- Rates: 2Y, 10Y Treasury yield changes, 3M T-bill (FRED)
- Inflation: 5Y and 10Y breakeven rates (FRED)
- Credit: High-yield and investment-grade spreads (FRED)
- Commodities: WTI crude, gold, natural gas (FRED)
- Yield curve: Level, slope, curvature via PCA on the Treasury curve
QR decomposition orthogonalizes the factors to prevent multicollinearity. A Chow structural-break test flags regime changes. Per-holding loadings are dollar-weighted into a portfolio-level factor profile.
Stage 4–6: Market Matching
Each significant factor maps to Polymarket categories via a deterministic taxonomy. Markets are pulled from Polymarket's Gamma API, hard-filtered (volume, expiry, binary), domain-filtered (sports/entertainment dropped before classification), and keyword-classified. A composite score (40% relevance, 35% liquidity, 25% timing alignment) ranks the top 3 markets per factor.
Stage 7–8: Probability Inversion
For each matched market, the pipeline inverts observed asset-price movements through factor loadings to derive a TradFi-implied probability:
- Holdings with strong factor loadings contribute more signal (loading-weighted averaging)
- Implied factor movements are capped at ±3σ to prevent noise amplification from small loadings
- A tanh mapping converts sigma-unit movements to probability shifts
- Bond ETF contributions use duration/convexity correction for yield-space accuracy
Stage 9–10: Divergence Detection & Sizing
The TradFi-implied probability is compared to the Polymarket YES price. Divergences are classified as noise, hedge signal, and strong signal.
Positions are optimally sized via the Quarter-Kelly criterion with:
- 1.5% max single position, 10% total portfolio cap
- Proportional correlation haircuts using a pairwise factor correlation matrix
- Cross-factor market deduplication to prevent double-betting
Stage 11: Output Assembly
The final output renders as an interactive dashboard with belief cards, hedge recommendations, scenario tables, and portfolio risk summaries.
Backtest Results
We validated PolyHedge against 20 synthetic portfolios with 90-day forward evaluation windows, using historical Polymarket prices from the Predexon API.
| Metric | Result |
|---|---|
| Average alpha | +0.32% over TradFi-only |
| Portfolios with positive alpha | 60% |
| Sharpe ratio improvement | +0.07 average delta |
| Directional accuracy | 62.5% |
| Win/loss ratio | 9.9:1 |
| Dollar-weighted hedge return | +2.72% |
| Average hedge allocation | 2.18% of portfolio |
| Insurance effectiveness | 60% |
The system acts as portfolio insurance; spending ~2% of portfolio value to generate positive alpha across diverse market conditions. When portfolios decline, hedges offset losses; when portfolios rise, hedge costs are minimal.
Dashboard
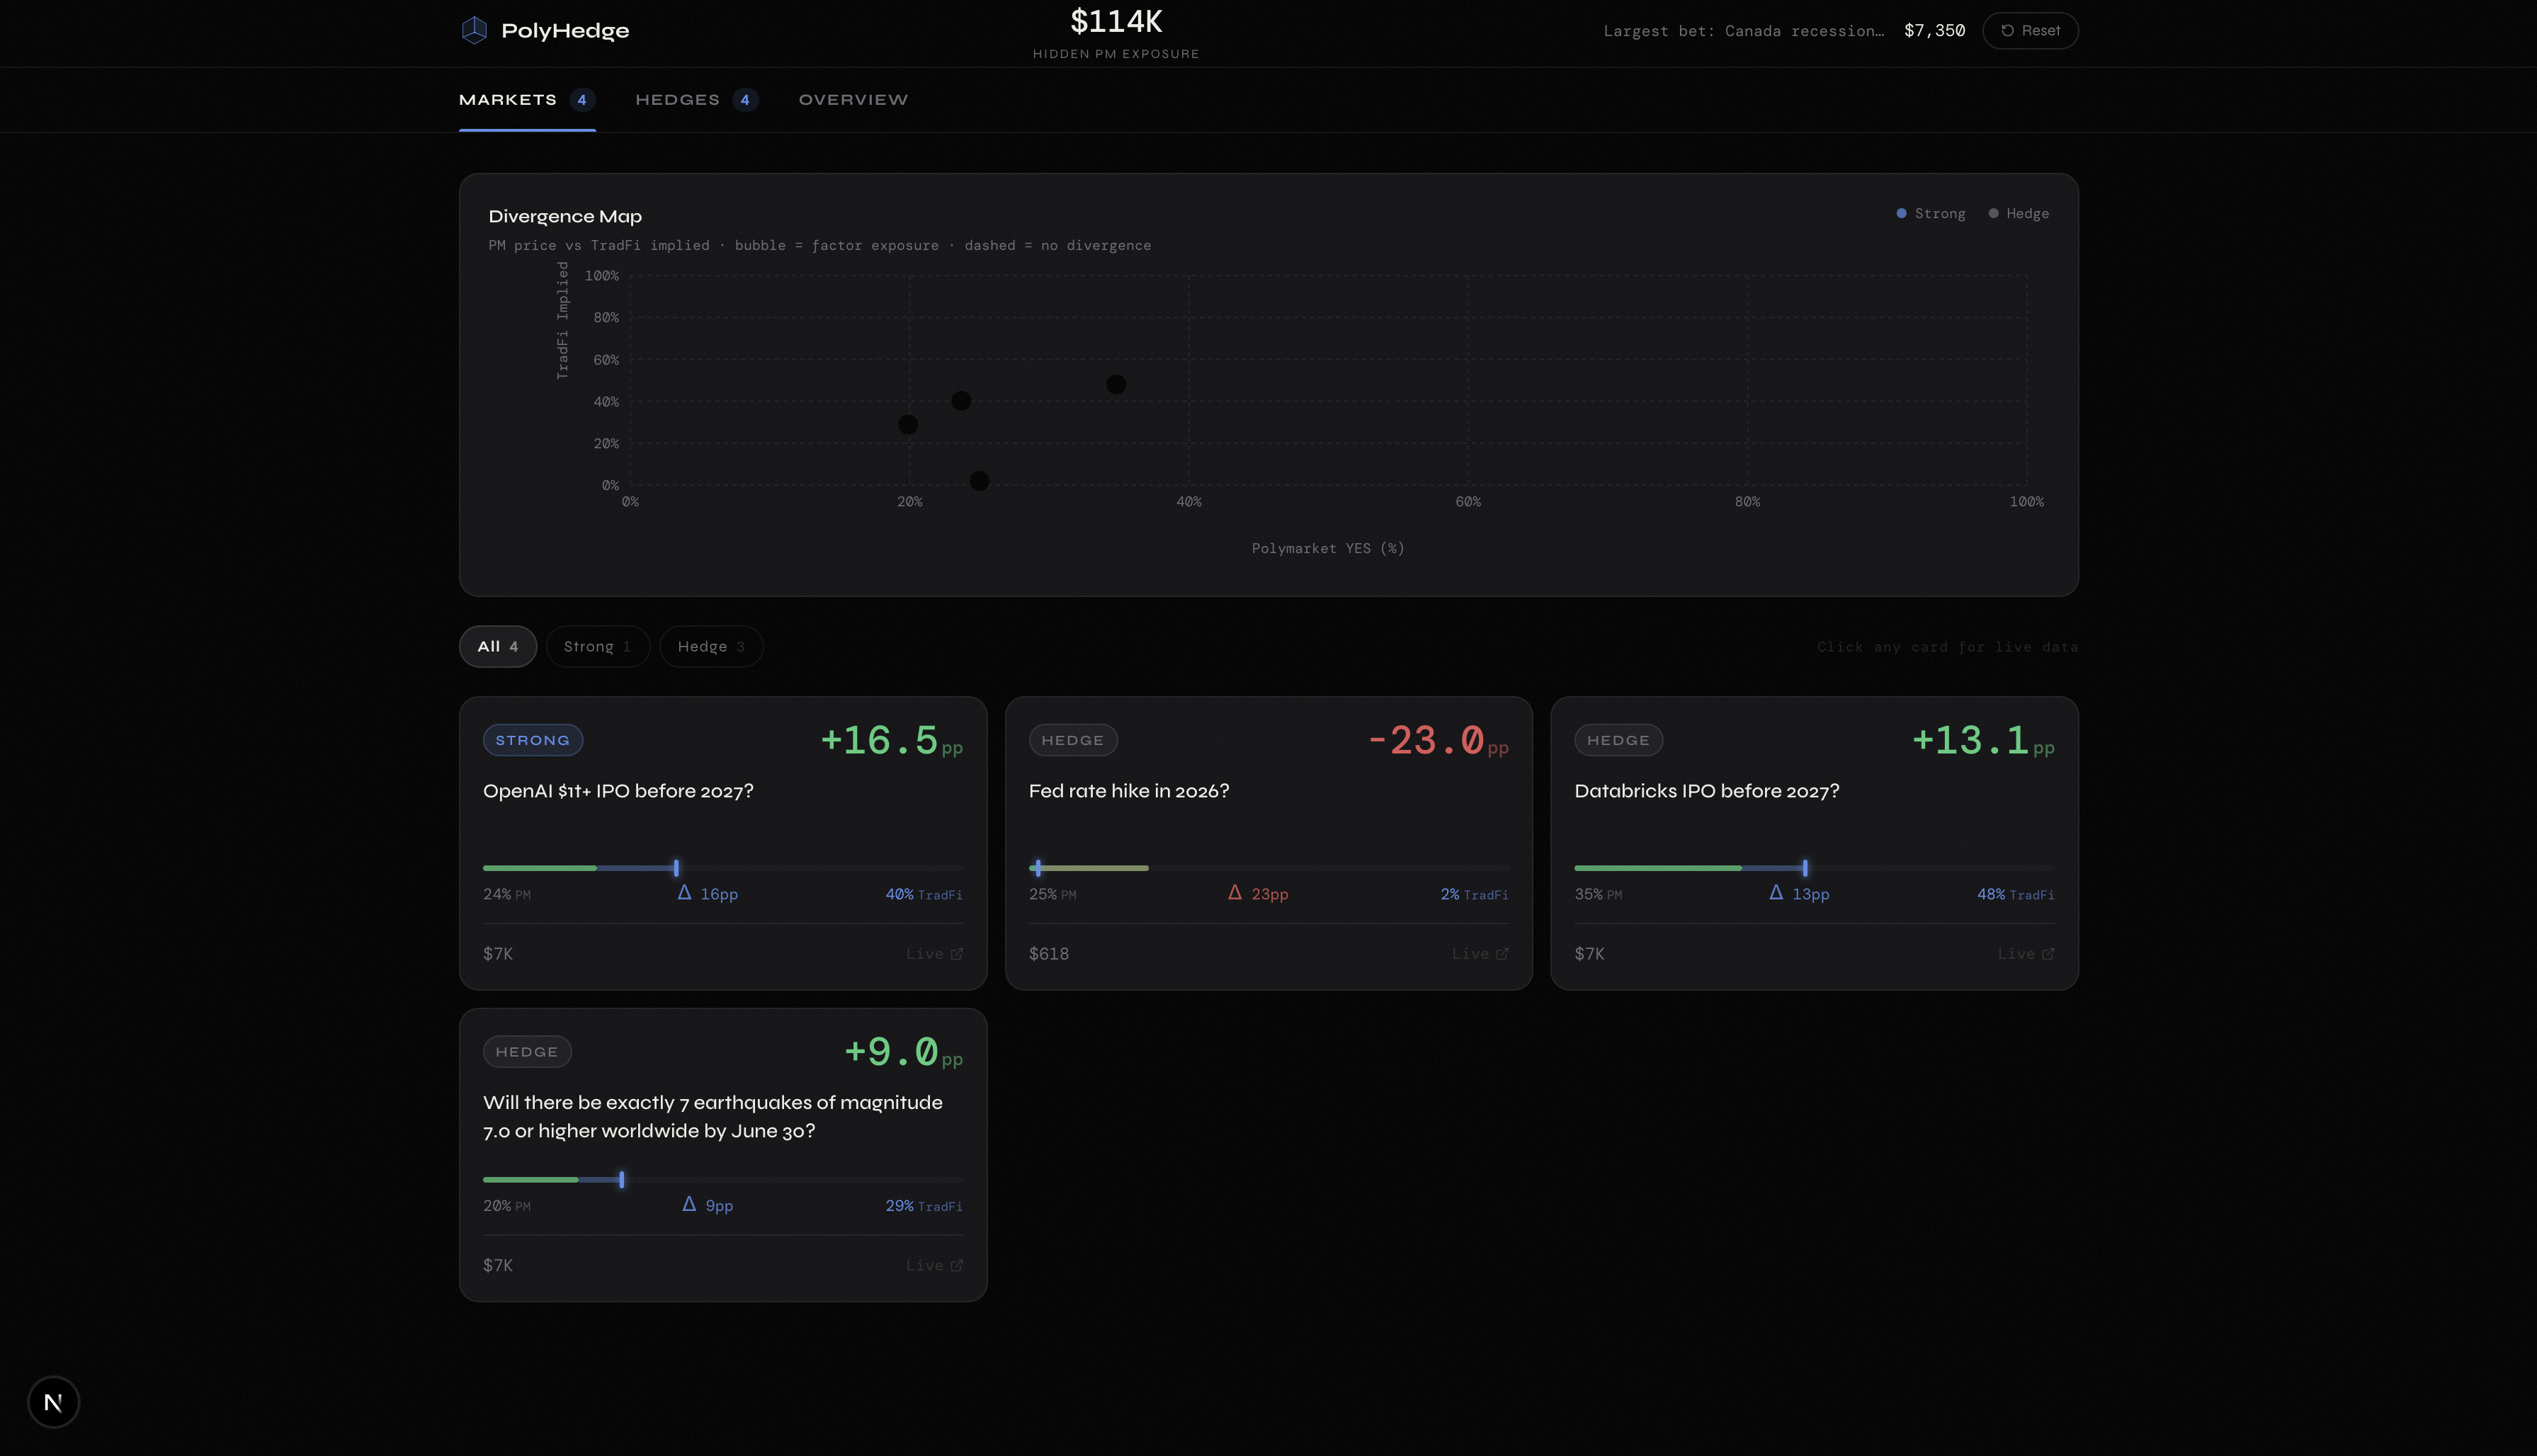
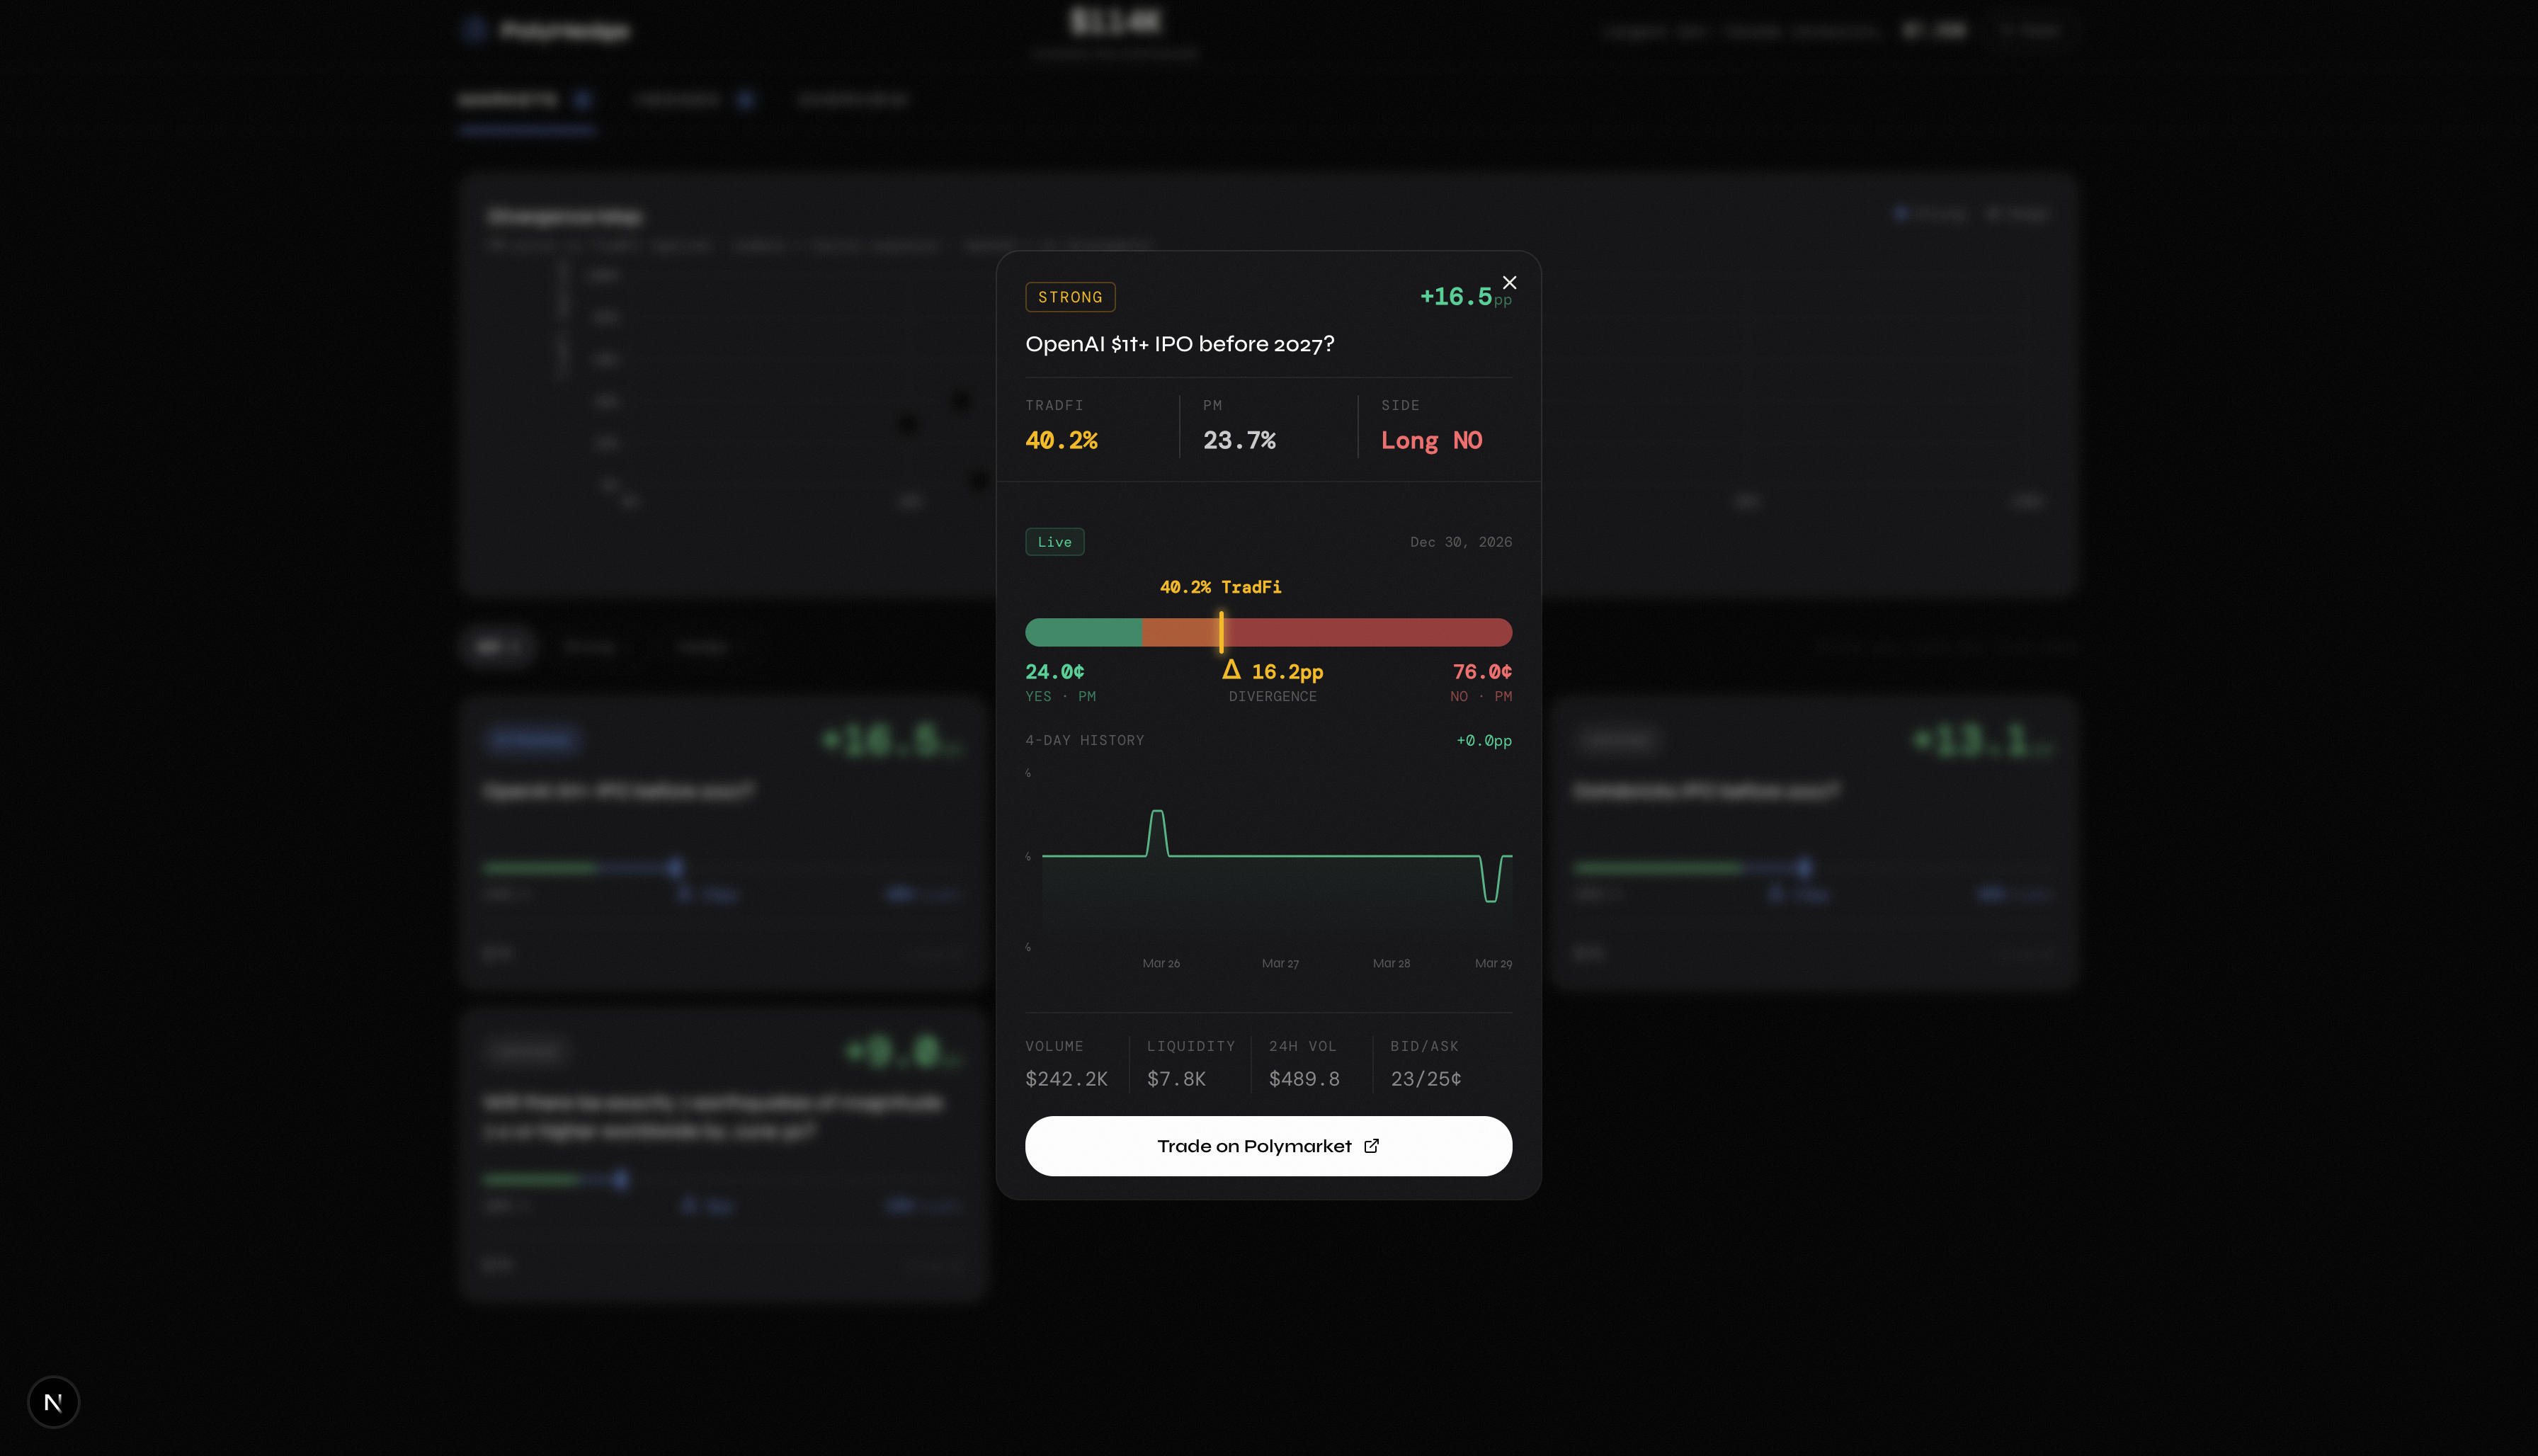
Markets Tab: A divergence scatter chart plots every matched Polymarket market, entries sized by notional exposure, colored by signal strength. Market cards show probability bars with your TradFi-implied view vs. the crowd, highlighting the gap. Filter by signal type (Strong / Hedge / Noise).
Hedges Tab: An outcome bar chart shows profit/loss scenarios for each recommended position. Hedge cards display the action (Buy YES / Buy NO), edge magnitude, P&L under YES/NO resolution and early exit, and correlated factor warnings.
Overview Tab: KPI cards (hidden PM exposure, portfolio value, hedge cost, recommended spend), a top-10 factor exposure chart with classification, sector weight distribution, and a signal summary donut chart.
Tech Stack
Backend
- Python 3.11: pandas, numpy, statsmodels, scikit-learn, yfinance, fredapi
- Data sources: Ken French (equity factors), FRED API (macro series), Polymarket Gamma + CLOB APIs, Predexon (historical prices)
Frontend
- Next.js 16 with React 19, npm, TypeScript
- Recharts for scatter plots, bar charts, and donut charts
- Framer Motion for pipeline animations and staggered reveals
- Tailwind CSS
Challenges
- Probability inversion noise: Small factor loadings produced extreme implied movements.
- Polymarket historical prices: No native historical API; required Predexon integration with 1 req/sec rate limiting for backtest evaluation
- Cross-factor double-counting: Correlated factors would produce duplicate hedges.
- ETF decomposition overlap: A position in SPY and AAPL double-counts Apple's factor exposure. Source-ticker tracking prevents this
Created by
- Chris Chang
- Jonathan Wang
- Armaan Agrawal
- Ansh Krishna
Built With
- fred-api
- nextjs
- npm
- polymarket
- scikit-learn
- tailwind
- yahoo-finance


Log in or sign up for Devpost to join the conversation.