-
-
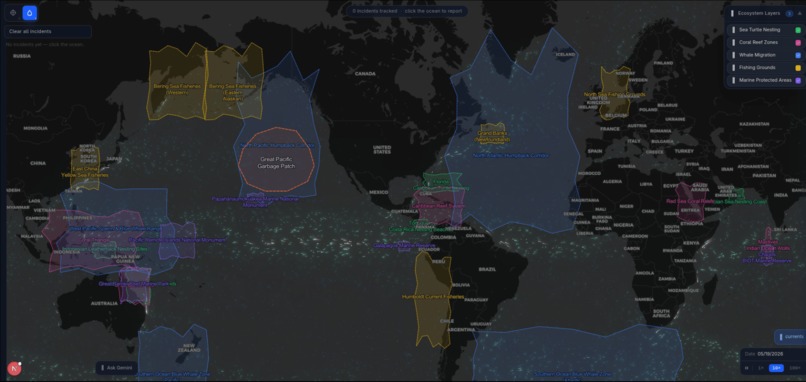
Shows the rough outlines of sensitive zones to pollution
-
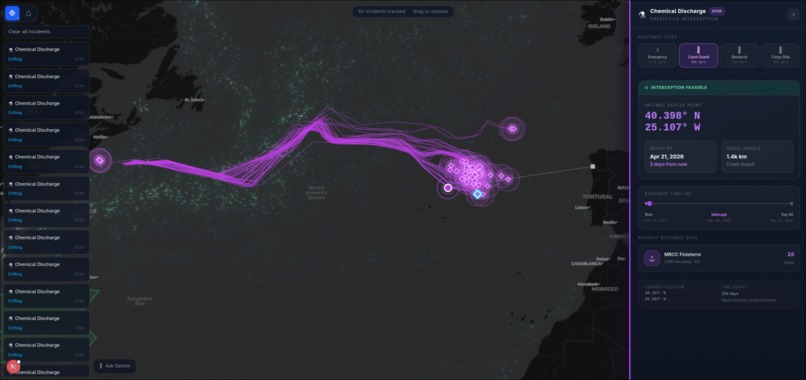
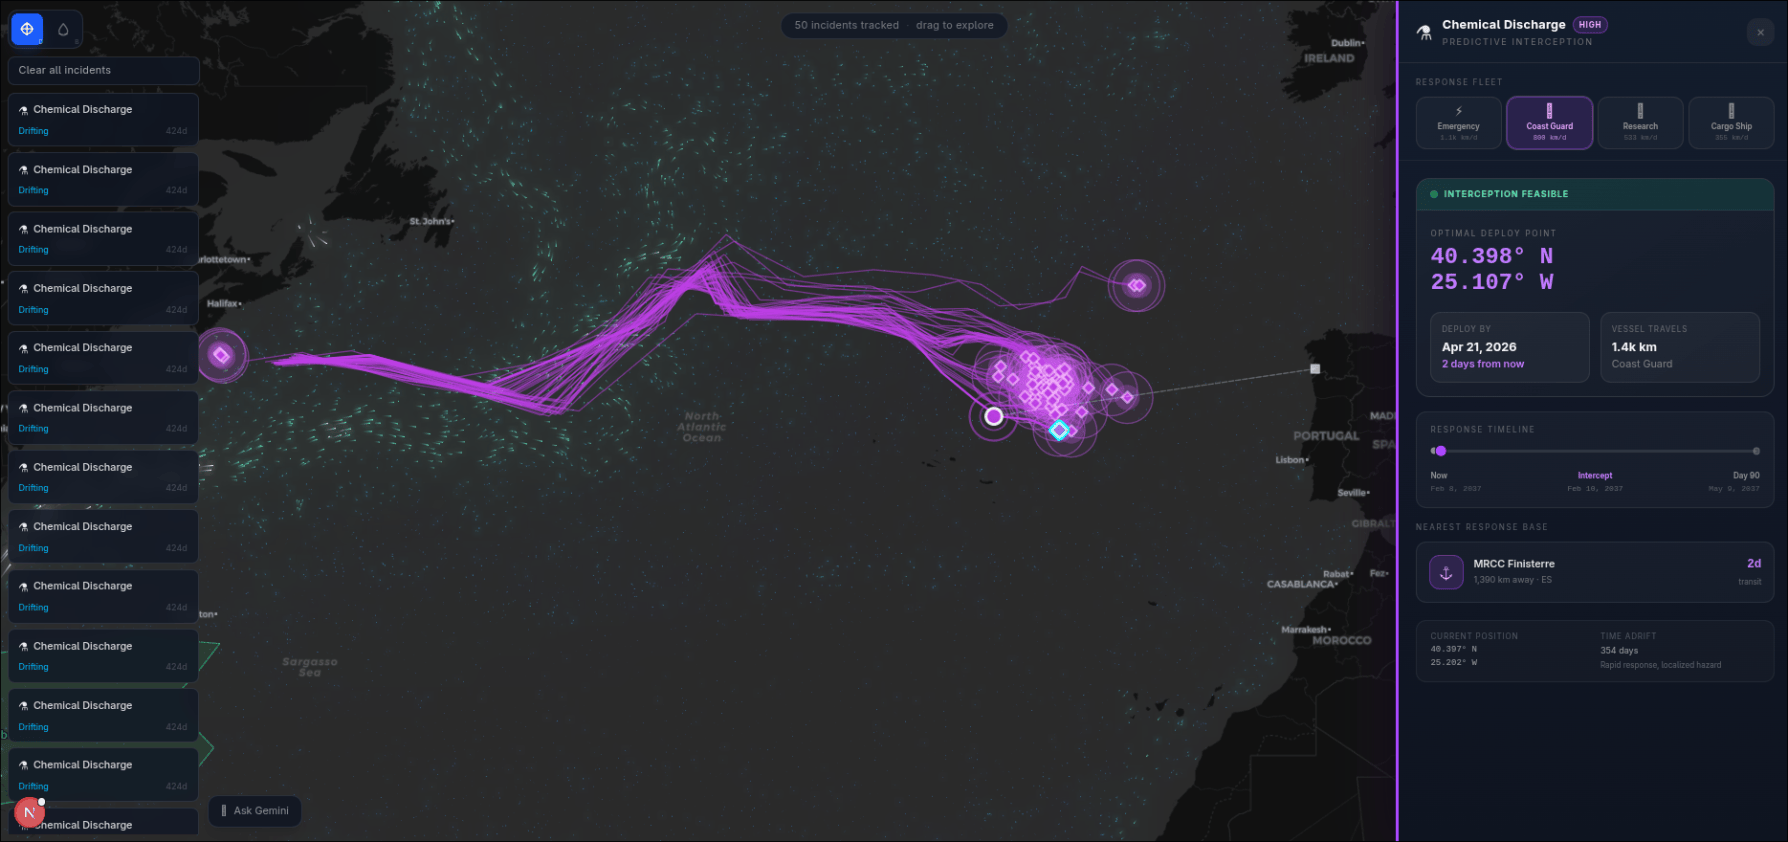
Shows the path prediction and interception calculation for a chemical drop that was quickliy rendered(less detail) to get the results fast
-
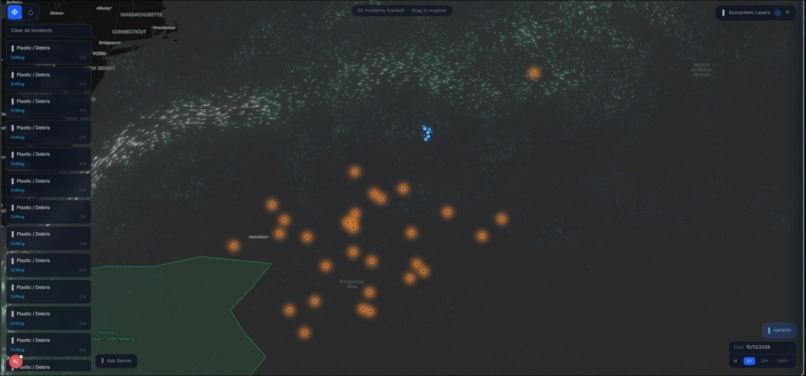
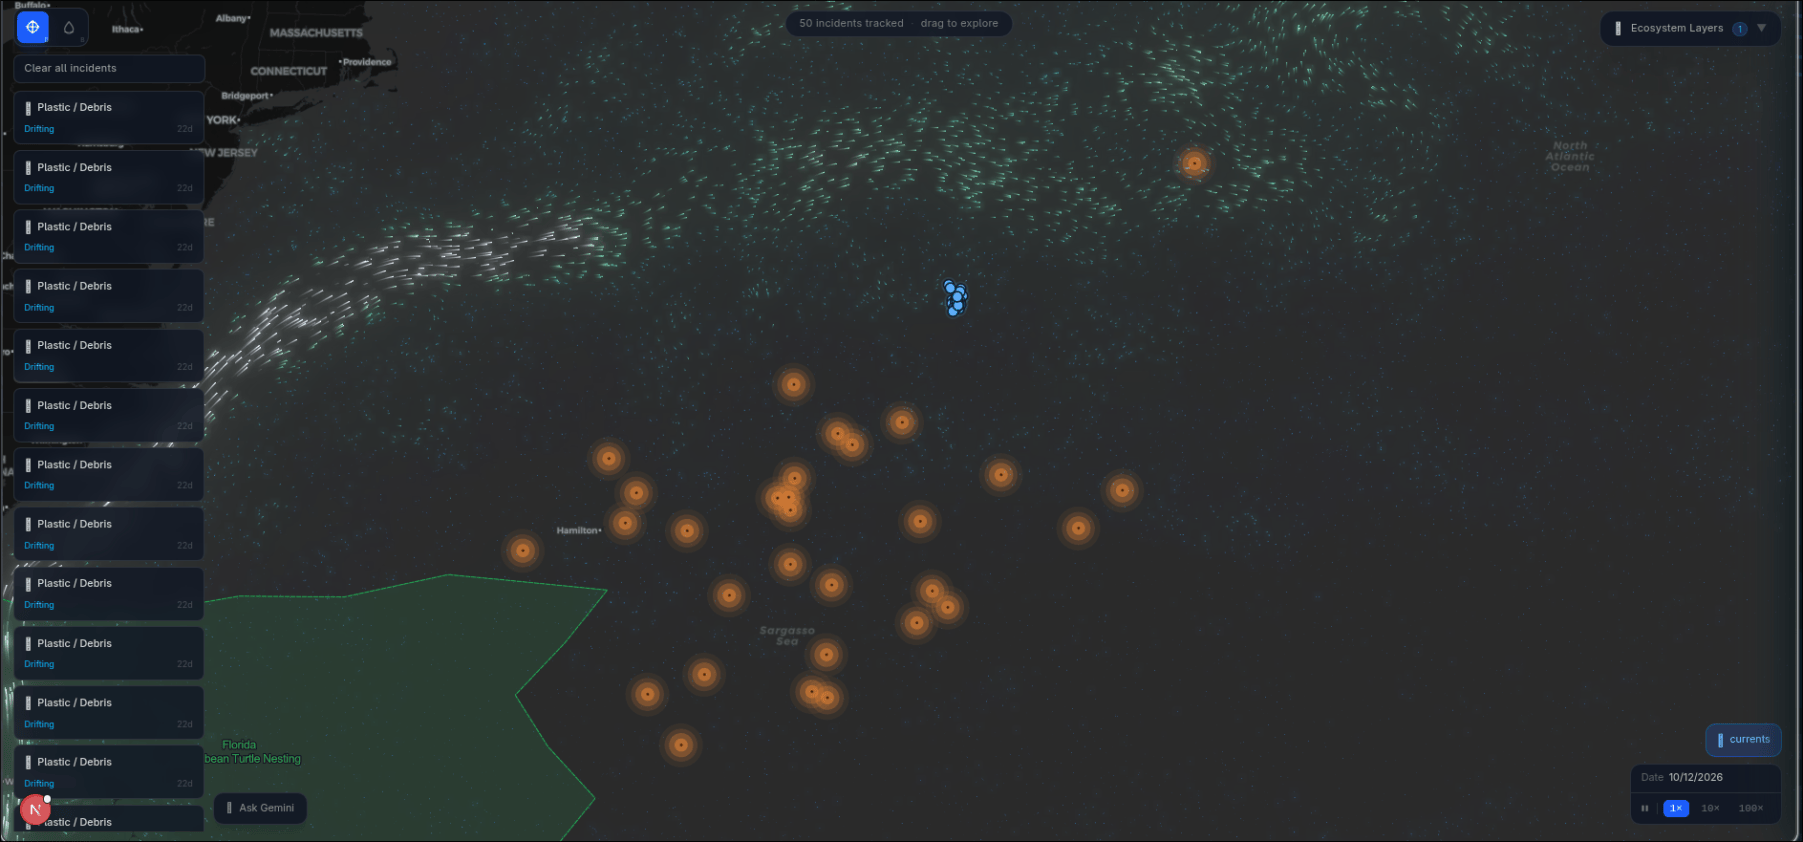
Shows wide range oil spill and a new bottle cluster drop

Inspiration
We were inspired by wondering what happens when plastic, oil, or chemical waste enters the ocean, where does it actually go? News coverage usually shows the moment of pollution, but not the long afterlife of that pollution once currents pull it across open water, into gyres, onto coastlines, or through fragile habitats.
That led us to build an experience that turns ocean drift into something visible. Instead of treating pollution as an abstract statistic, PPPs lets people place virtual bottles or spill points on the ocean and watch how far even a small release can travel. The goal was to make ocean connectivity feel immediate, visual, and hard to ignore.
We were also inspired by globe and current visualizations from esri's arcGIS, but wanted to make the experience more interactive, personal, and exploratory. Rather than only viewing the ocean, we wanted users to intervene in it, run scenarios, compare trajectories, and understand the environmental consequences of where a pollutant starts.
What it does
Pollution Path Prediction Simulator (PPPs) is an interactive ocean drift simulator built around a map-first interface. Users can drop one bottle or a cluster of bottles anywhere on the ocean surface, then watch each object move over time according to sampled ocean-surface current data. The simulation advances day by day, stores each object's drift history, and visualizes both the current position and the trail it leaves behind.
The app includes:
- Time controls to pause, resume, and accelerate the simulation across multiple speed settings.
- A current-field visualization layer so users can see the flow patterns driving the drift.
- Persistent local state so dropped bottles remain in the browser between sessions.
- Environmental hazard overlays for sea turtle nesting grounds, coral reef regions, whale migration corridors, fishing grounds, and marine protected areas.
- An integrated Gemini analysis that inspects a bottle's current position against tracked marine zones and generates a short AI-assisted environmental analysis.
- An interception path calculation to launch the best boat to combat the spread of pollution and calculate where to go to stop the spread
How we built it
We built PPPs as a browser-based simulation in Next.js 16, React 19, TypeScript, and Tailwind CSS, with the map and ocean layers rendered through the ArcGIS JavaScript SDK.
The project breaks down into a few major pieces:
- Map and interaction layer: We built a map interface where users can explore the ocean, switch modes, and drop new bottles directly onto the water.
- Simulation engine: A pure TypeScript drift engine updates each bottle once per simulated day. It samples a gridded flow field, converts current vectors into movement across latitude and longitude, tracks elapsed drift time, and updates destination states like
ashoreorgarbage_patch. - Ocean current data pipeline: We generated local current-field JSON assets from ArcGIS ocean current services, including monthly climatology-based surface current data, so the simulator could run quickly in the browser while still being grounded in real oceanographic datasets.
- Visualization: We render bottle markers, spill plumes, and path trails on top of the map, while also exposing a toggleable current-flow renderer so users can see the larger motion of the water itself.
- Hazard analysis: We added ecosystem overlay categories and a side-panel impact view that checks whether a drifting bottle is intersecting tracked marine risk regions.
- AI explanation layer: We integrated Gemini-based text analysis so a selected bottle can produce a short, region-aware summary of ecological risk and trajectory significance.
One of the strongest architectural decisions was keeping the core simulation logic pure and the storage local. That made the drift logic easier to reason about, easier to test, and faster to iterate on during the build.
Challenges we ran into
We had a hard time working out the math calculations for the vector predictions and rendering the actual data used to predict the path of pollution items
Accomplishments that we're proud of
We are proud that PPPs already feels like an operation viable application. It behaves in a live system: users can drop objects anywhere, accelerate time, and watch different parts of the ocean reveal very different outcomes.
We are also proud of:
- Building a full browser-based drift simulator without requiring a backend.
- Turning real ocean-current data into an interactive, understandable experience.
- Combining simulation, mapping, hazard overlays, and AI explanation into one workflow.
- Making the project useful both as a visualization tool and as an educational tool.
- Designing the system so it can grow from "message in a bottle" scenarios into broader pollution tracking use cases.
- Implementing an a best interceptor calculation to best stop the spread of the polluted items
- Rendering and caching the huge amount of data points needed without overwhelming our systems
What we learned
We learned that environmental visualization is not only about accuracy; it is also about framing. Even a strong dataset can feel distant unless users can interact with it and see consequences unfold over time.
On the technical side, we learned a lot about:
- working with geospatial data and current-vector fields
- translating physical motion into stable browser simulation steps
- handling map rendering constraints in a modern React app
- connecting environmental datasets to user-facing explanations
- designing interfaces that stay readable while layering multiple ocean signals at once
What's next for Pollution Prediction Path Simulator (PPPs)
The next step is expanding PPPs from a strong prototype into a richer decision-support tool.
Planned improvements include:
- Replacing simplified hazard boxes with more accurate GeoJSON overlays
- Supporting explicit oil spill, chemical spill, and plastic spill modes with more accurate movement
- Adding stronger interception and response planning, so users can estimate where cleanup vessels could realistically meet a drifting spill.
- Incorporating richer forcings such as winds, tides, and weather-linked conditions where feasible.
- Allowing side-by-side scenario comparison across seasons or different start dates.
- Expanding the educational storytelling layer with clearer source attribution, environmental context, and regional case studies.
Long term, we want PPPs to help people move from "pollution happened here" to "here is where it may travel, who it may affect, and why prevention matters globally."
Built With
- esri
- figma
- geminiapi
- leaflit
- next.js
- node.js
- typescript


Log in or sign up for Devpost to join the conversation.