-
-
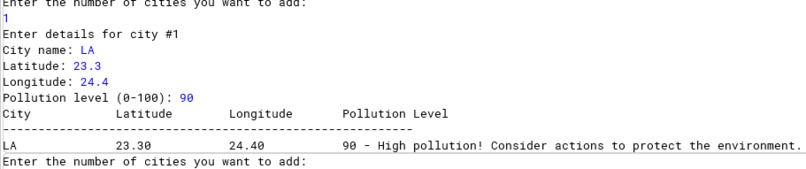
Example Input/Output

Inspiration
We were inspired by the idea of a user-friendly tool and then we developed a model that can quickly inform people about pollution levels in their city and encourage them to take action when needed.
What it does
PollutionMap uses a Blu-J model that takes two inputs: a city name and a pollution score. Based on this pollution score, it displays a message encouraging people to protect the environment if the score is above 50. If the score is below 50, it congratulates the community on their efforts to keep pollution low.
How we built it
Blu-J Model: Developed with a simple input/output functionality that allows users to enter city names and receive feedback based on pollution scores.
Challenges we ran into
One of the main challenges was establishing the Blu-J model to ensure accuracy and responsiveness to the number of cities and their consequent pollution scores.
Accomplishments that we're proud of
We’re proud of successfully implementing a simple yet impactful model that can be easily accessed and understood by a broad audience while also encouraging them to do the same.
What we learned
Through this project, we gained insights into environmental data interpretation and the simplicity of communication for social impact. We also learned about the Blu-J model’s capabilities and how to build interfaces for environmental data.
What's next for PollutionMap
We plan to enhance PollutionMap by having real-time pollution data from APIs and expanding it to include different types of environmental factors like water and noise pollution.

Log in or sign up for Devpost to join the conversation.