Inspiration
I have always loved interactive and visual features that javascript has to offer.So keeping that in mind I thought maybe I can integrate this feature into a webapp and make climate data more visual. Because visualisation of climate data especially in your current location can give a person a very interactive understanding of various climate paramaters in a simplistic manner.
What it does
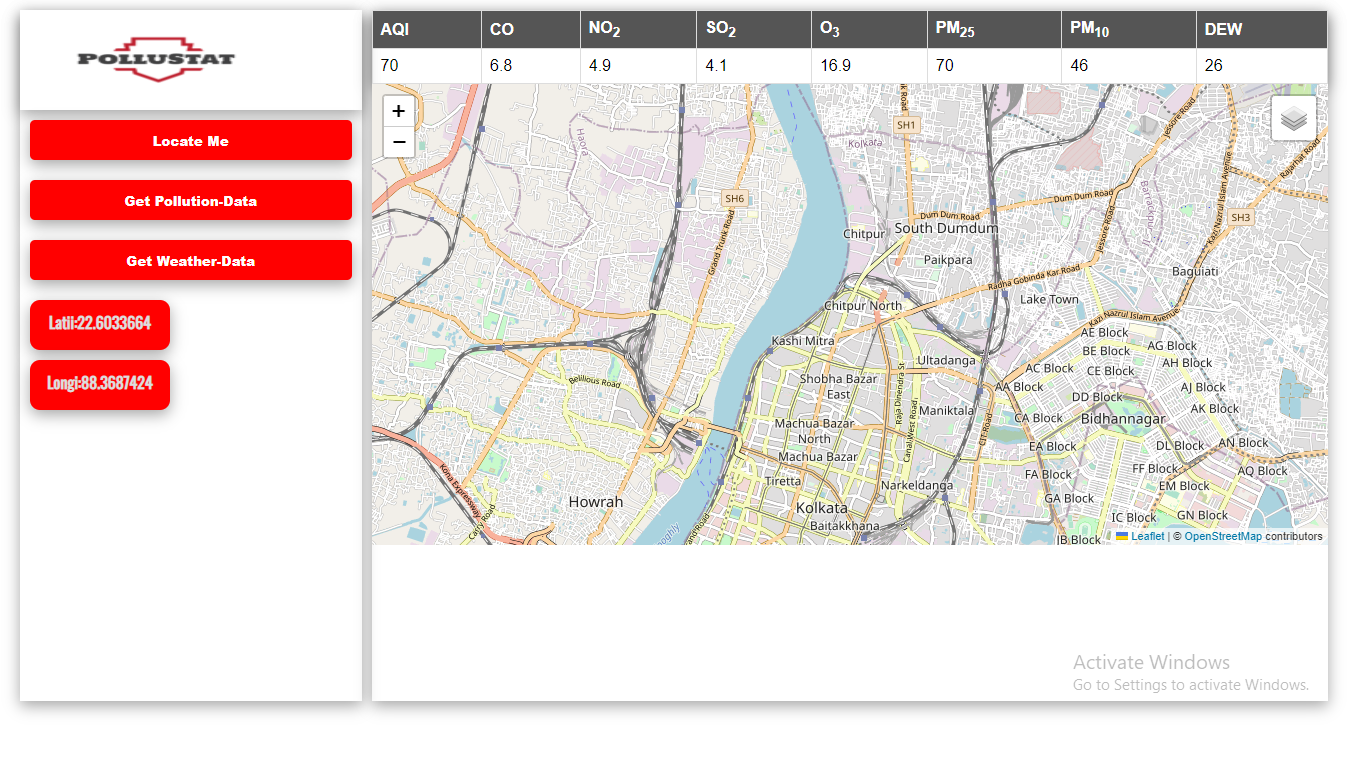
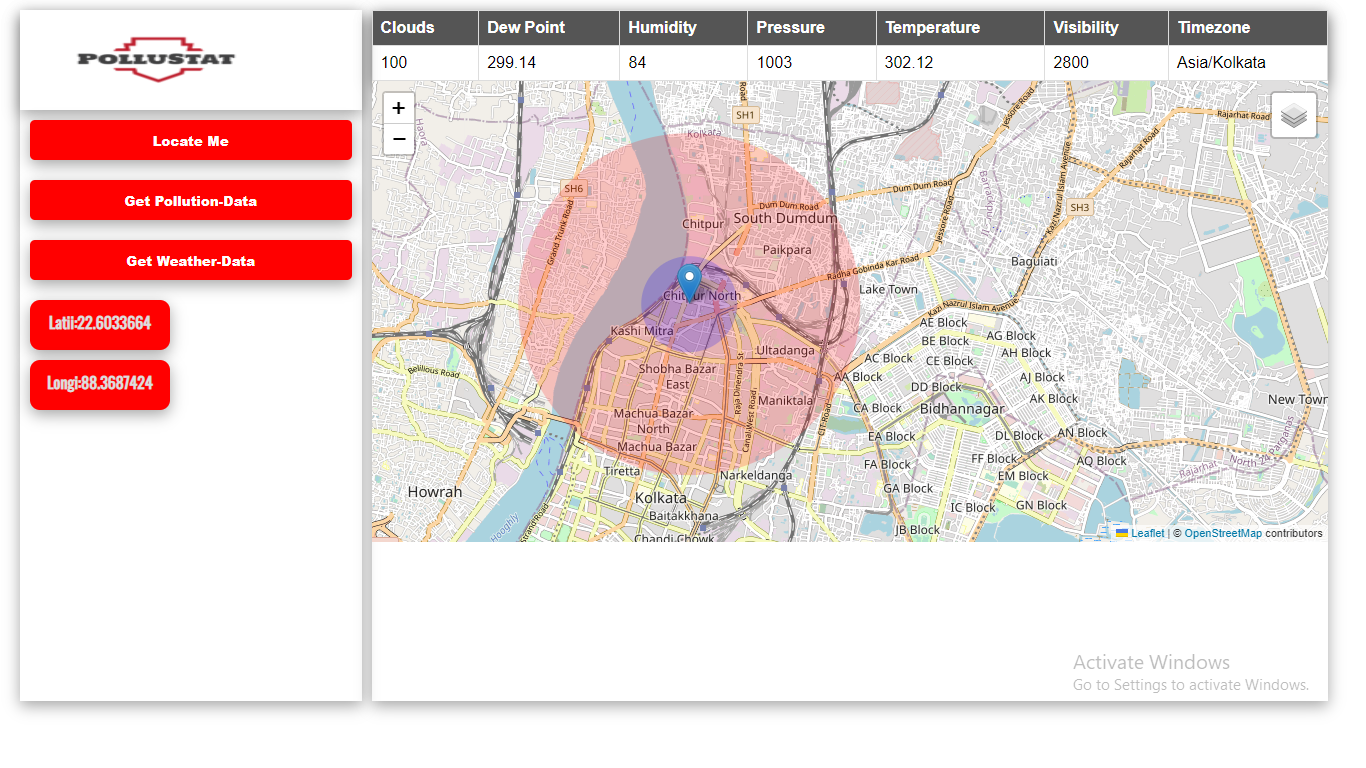
My app PolluStat takes user location and collects various Climate and weatherData using WAQI API and openweathermap API .It then layers those data on a Leaflet.js Map.
How we built it
The App is built using react . For collection of climate data it uses WAQI API. For weather data of a the location it uses openweathermap API. React-Leaflet is used to make Maps on which the data is layered.
Challenges we ran into
This was my first time using React-Leaflet .So I ran into basic problems which was easier to solve as the documentation is amazing.
What we learned
I learned how to make use of React libraries like React-Leaflet to make interactive maps and layer data on top of them using various API's like WAQI and openweathermap
What's next for Pollustat
I would love to use libraries like recius and caesium to integrate 3-D modelling in my App in the future.
Built With
- javascript
- leaflet.js
- openweathermap
- react
- react-leaflet
- waqi

Log in or sign up for Devpost to join the conversation.