Inspiration
Most people will never read a piece of legislation. Not because they don't care — but because bills are written in dense legalese, buried in hundreds of pages, and structured in a way that makes it nearly impossible to understand what's actually being proposed, who it affects, and how much it costs. We wanted to change that. PolicyMap was born from a simple question: what if a law looked less like a document and more like a map?
What it does
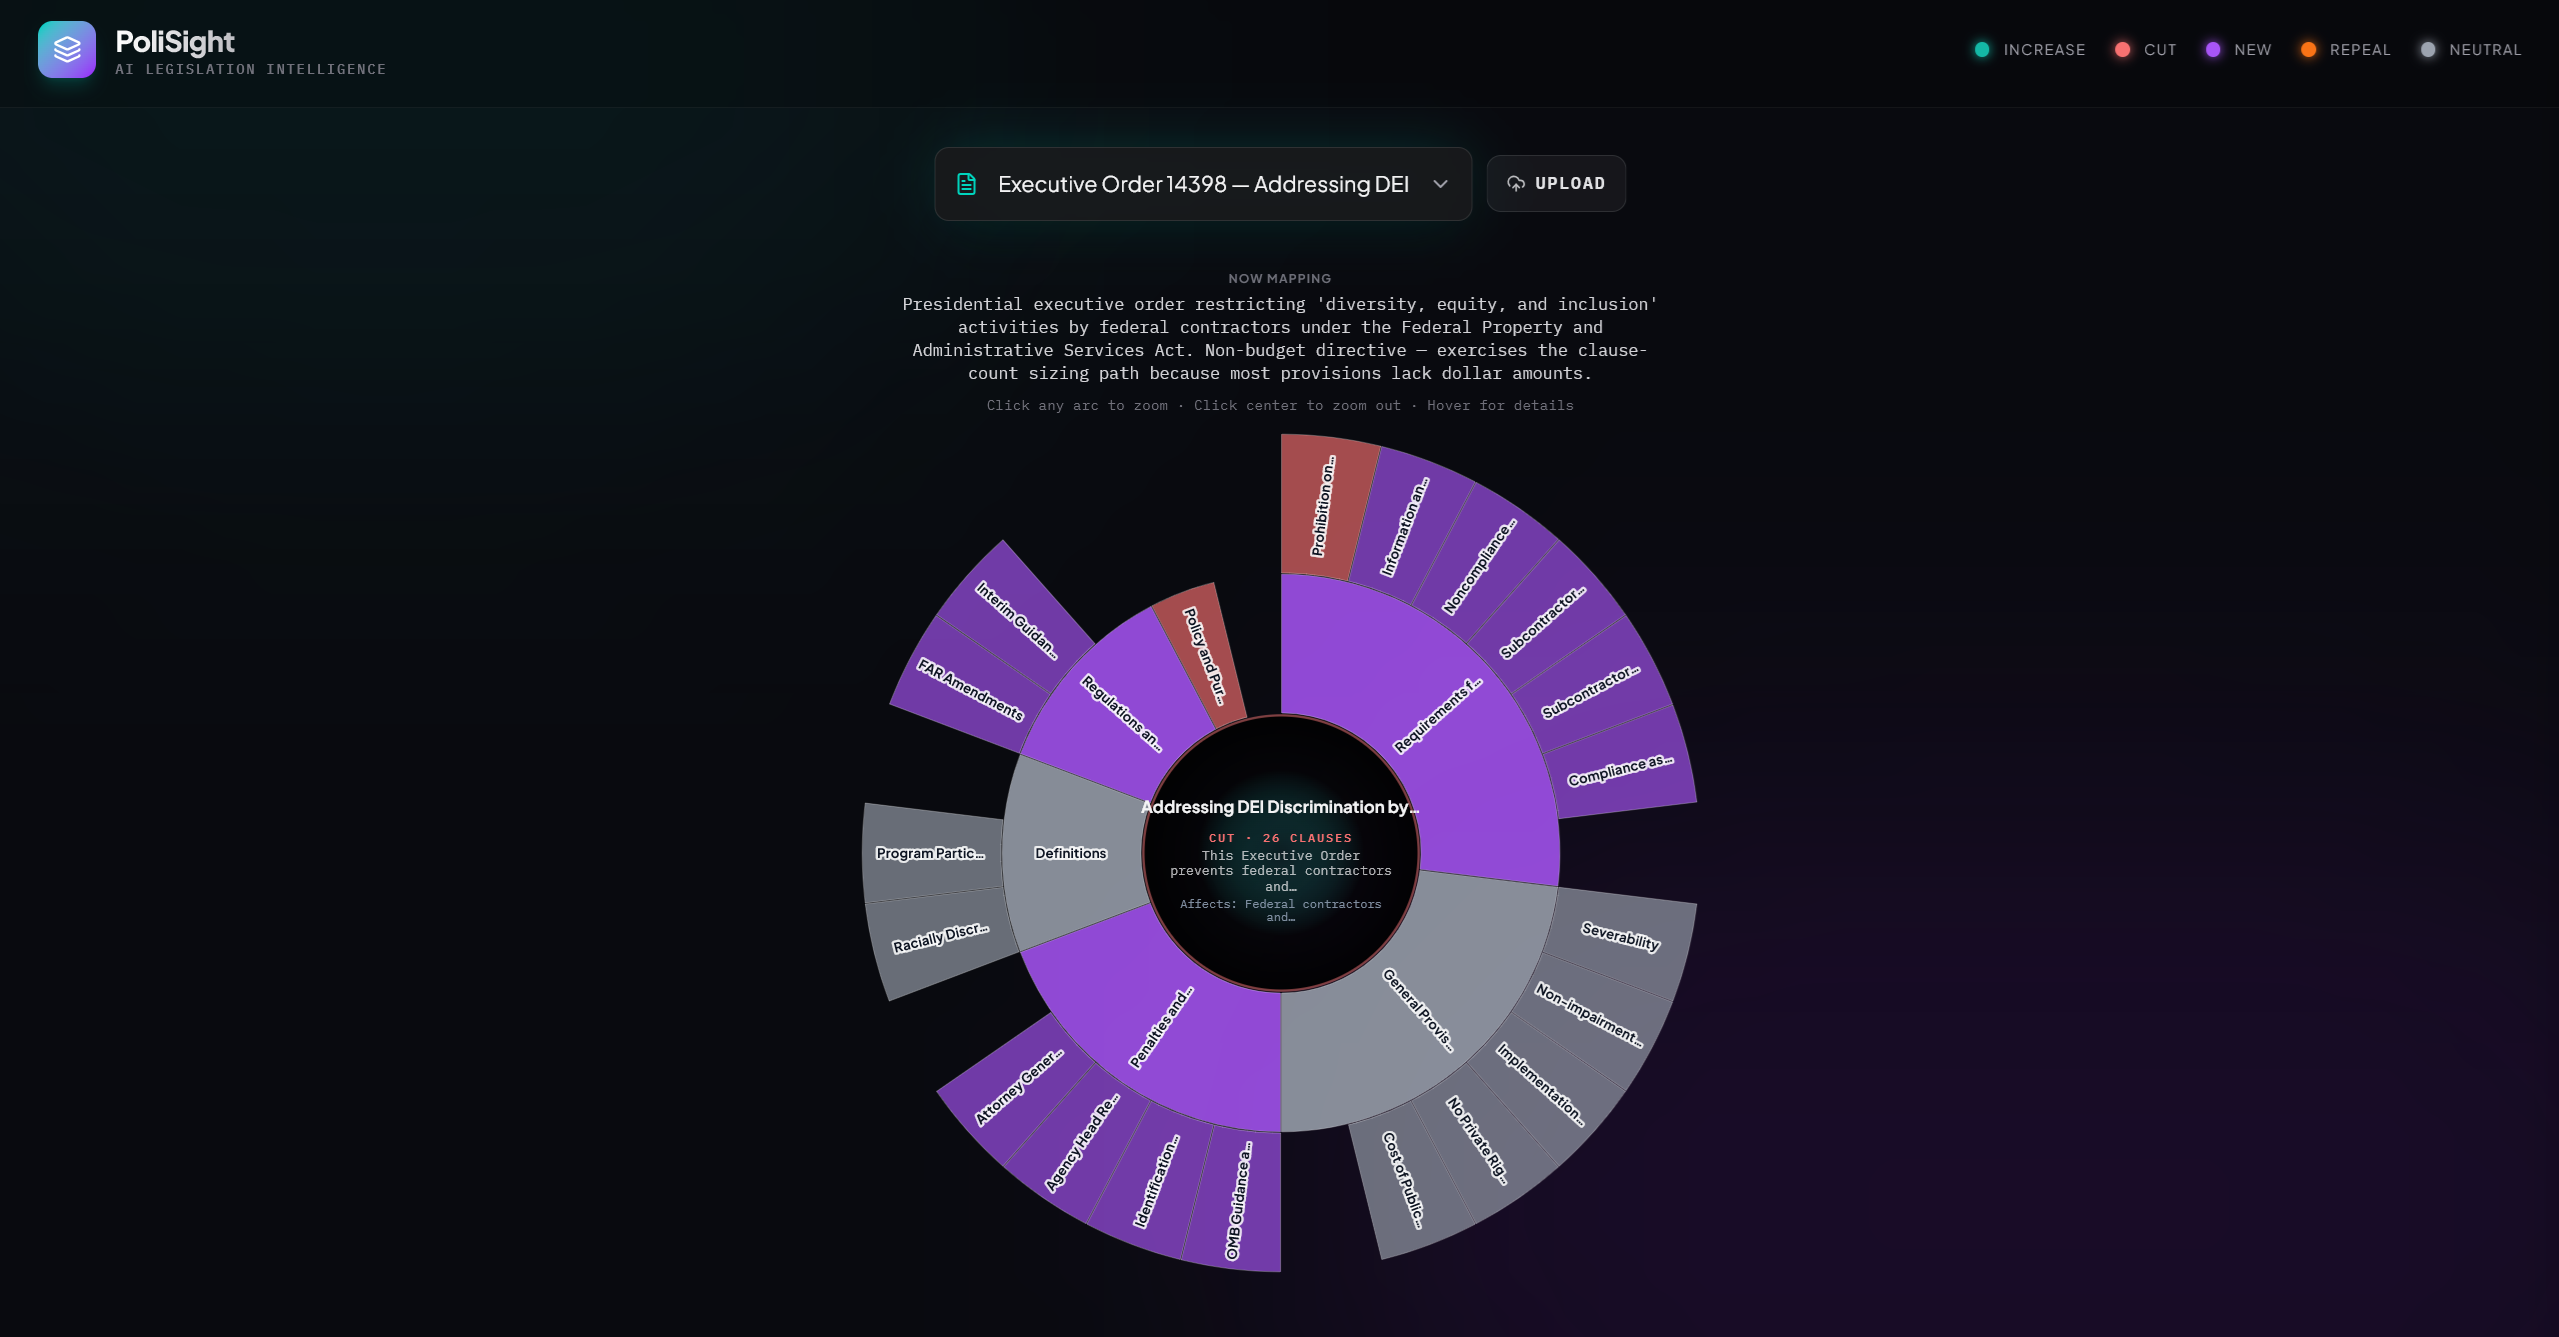
PoliSight takes any piece of legislation and turns it into an interactive zoomable sunburst chart. Each arc represents a section of the bill — sized by dollar amount (or clause count for non-budget documents) and color-coded by type: teal for spending increases, coral for cuts, purple for new programs, orange for repeals, and gray for neutral clauses.
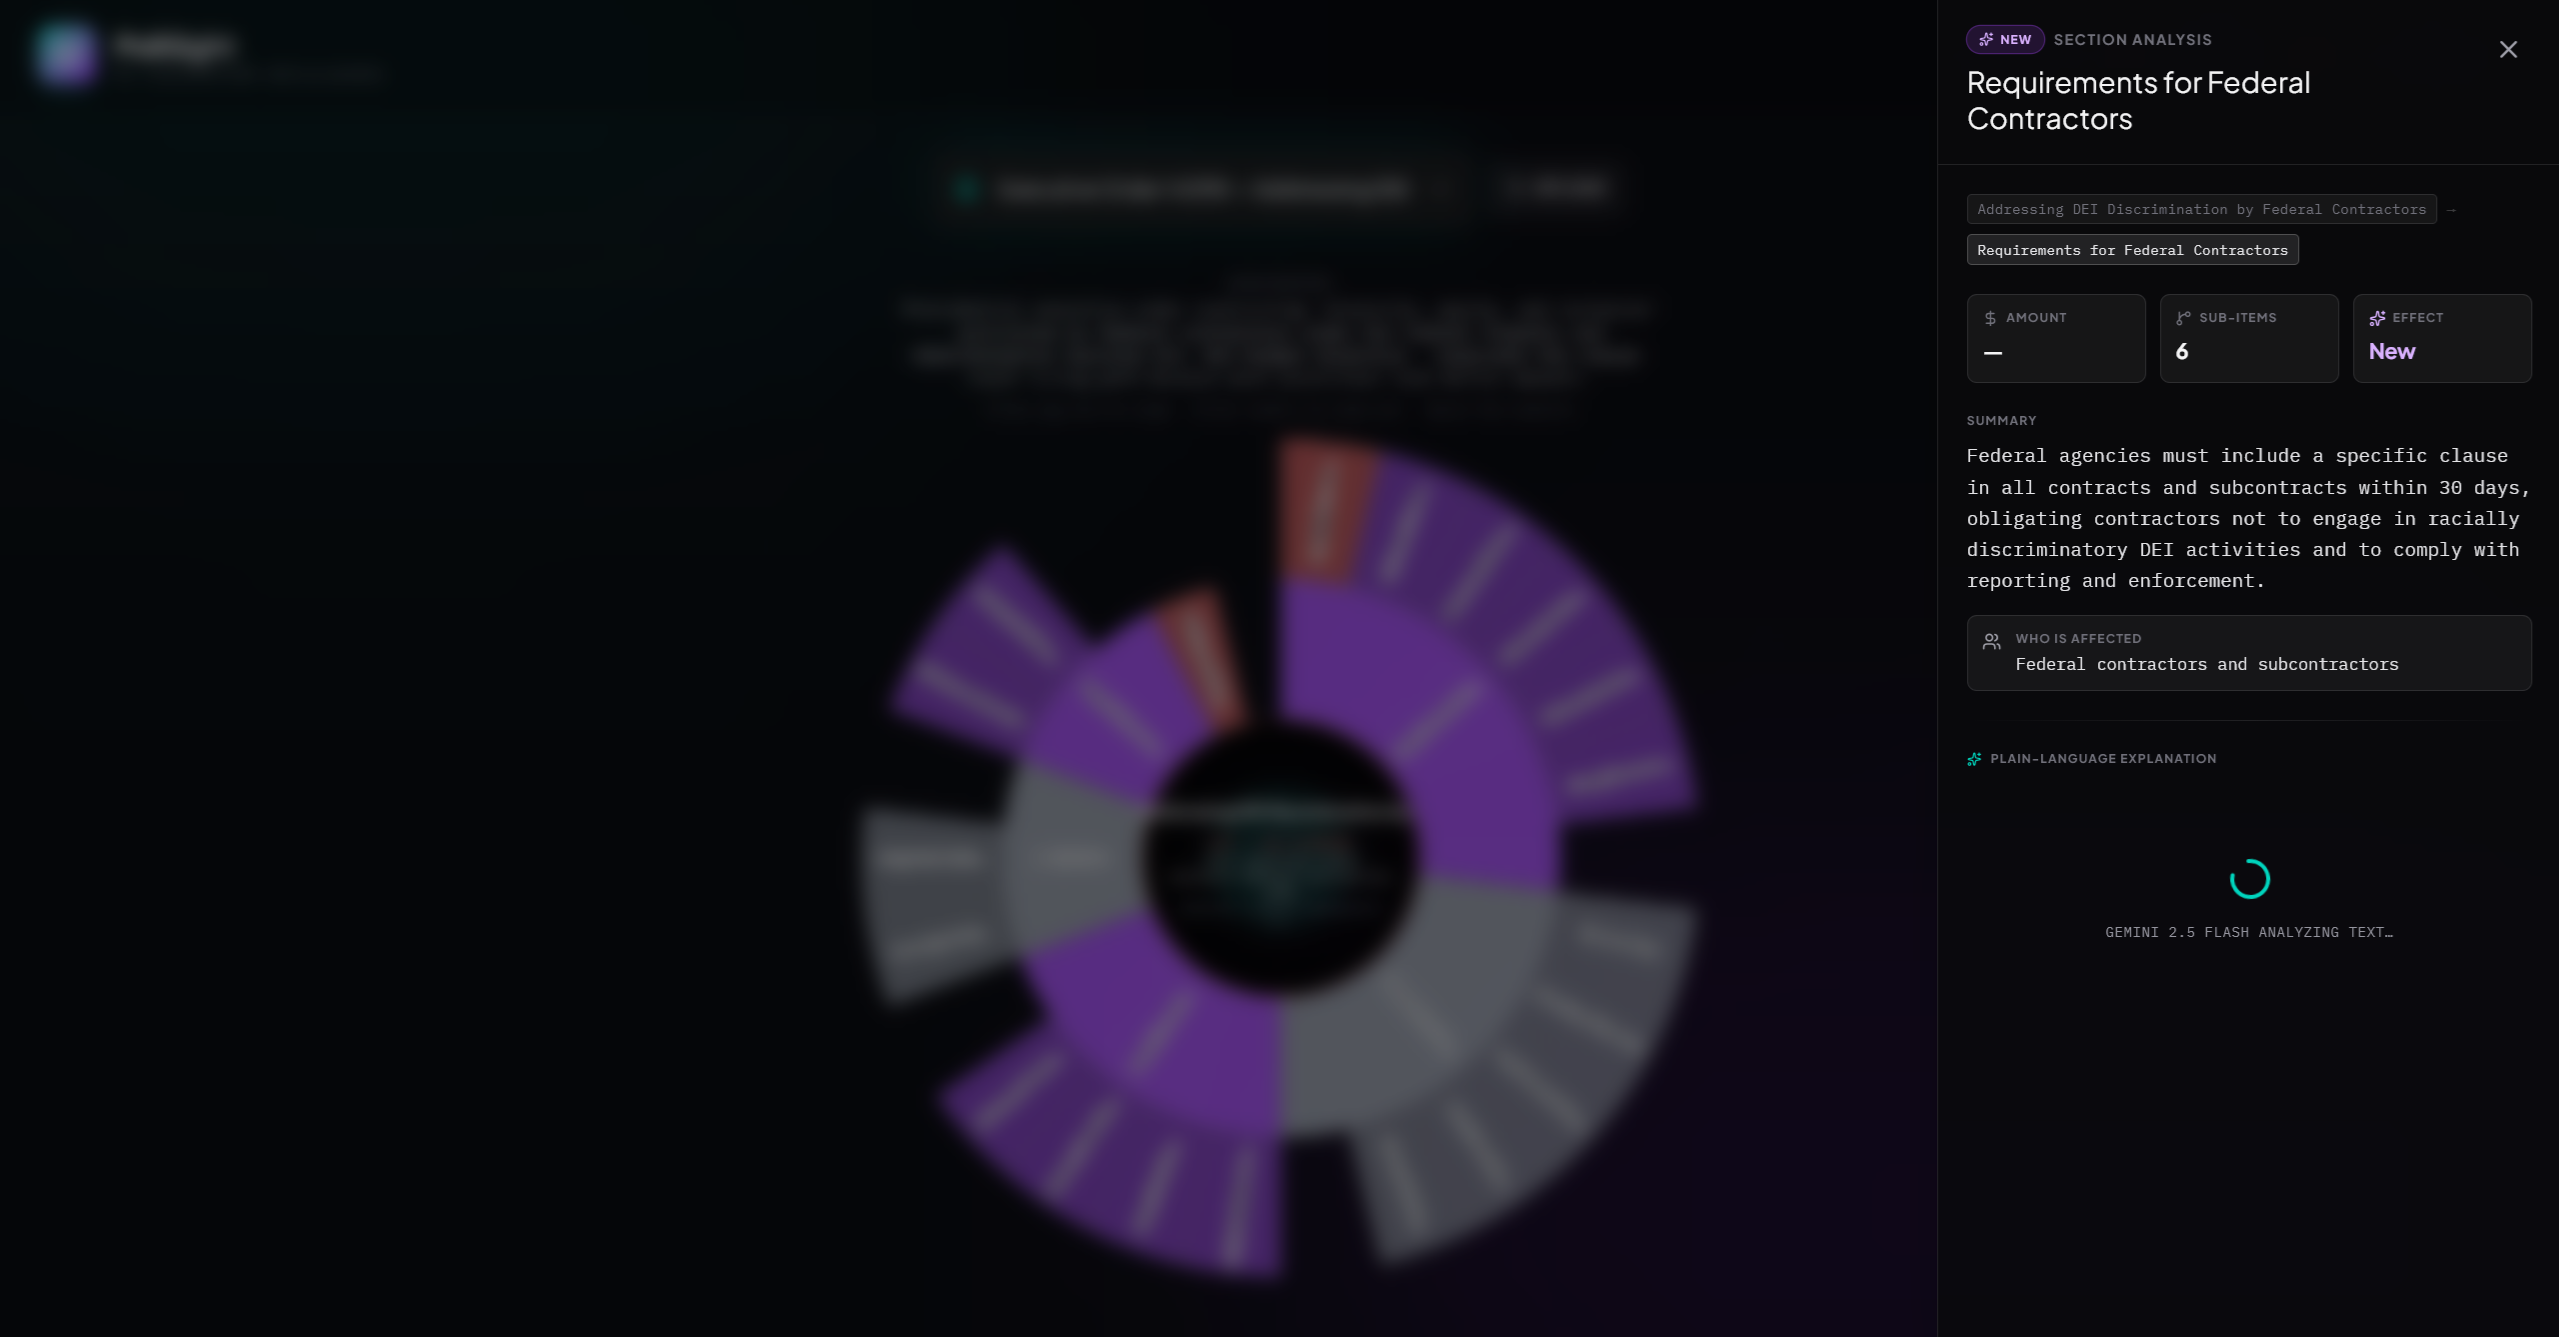
Hover over any arc to see the section name, dollar amount, summary, and who it affects — all displayed live in the center of the chart. Click any arc to zoom in and explore its sub-sections; click the center to zoom back out. Click any section and a right-side drawer slides open with a plain-language AI breakdown of exactly what that part of the law means.
How we built it
Frontend: React + Vite + TypeScript + D3 v7. The sunburst is a full D3 implementation with tweened arc transitions, a dynamic center disc that updates on hover and zoom, smart label truncation, and a Tailwind UI with glassmorphism aesthetics.
LLM layer: Gemini with JSON-mode structured output for hierarchy extraction and plain-language explanation generation, including a retry-and-repair loop for reliability.
Data layer: A file-based bill store supporting both .txt and .pdf inputs via pypdf, with a seeding script that pre-caches extracted hierarchies so the demo starts instantly.
API layer: A FastAPI server with three routes wired through a Vite dev proxy, so the frontend talks to the backend with zero CORS friction in development.
Challenges we ran into
Getting the LLM to return a valid nested JSON tree on the first try proved harder than expected. We solved it with a retry-and-repair loop that feeds the exact Pydantic validation error back to the model along with the original document.
Court opinions and executive orders have no dollar amounts. We built a clause-count fallback so the sunburst renders meaningfully even when all amounts are null, with the center disc dynamically switching between dollar and clause labeling.
Fitting a section name, type badge, dollar amount, 3-line summary, and an "affects" line into a small circle required custom word-wrap logic and careful offset tuning in D3.
Coordinating four people on a greenfield repo was solved by partitioning file ownership strictly — zero overlap across all three backend layers and the entire frontend directory.
Accomplishments that we're proud of
The sunburst zoom animation runs at 60fps with smooth arc tweening even on deeply nested trees.
The center disc updates live on hover — showing name, type, dollar amount, a 3-line summary, and who is affected — without any additional API calls.
The clause-count fallback means non-budget documents like Supreme Court opinions render just as beautifully as appropriations bills.
The seeded demo loads any cached bill in under 200ms.
What we learned
Freezing a shared data contract before writing any feature code is one of the highest-leverage things a small team can do at a hackathon.
Structured LLM output with a repair loop is far more reliable than prompt engineering alone.
D3 and React coexist cleanly when all D3 mutation lives inside useEffect and never touches React state directly.
Non-budget text is actually a great demo — clause-count sizing on a Supreme Court opinion produces a surprisingly beautiful and informative chart.
What's next for PoliSight
Upload intake API — the upload button is already in the UI; connecting a backend endpoint would let anyone drop in any PDF or text file on the spot.
Live bill fetching — pull directly from Congress.gov, the Federal Register, or state legislature APIs by URL.
"How does this affect me?" — personalized impact summaries based on user context like location, profession, or income bracket.
Shareable links — deep-link to any zoom state so journalists and researchers can embed or share a specific section.
Bill comparison — overlay two versions of the same bill to visualize what changed between drafts.
Classroom mode — guided walkthrough with annotations, designed for civic education.


Log in or sign up for Devpost to join the conversation.