-
-

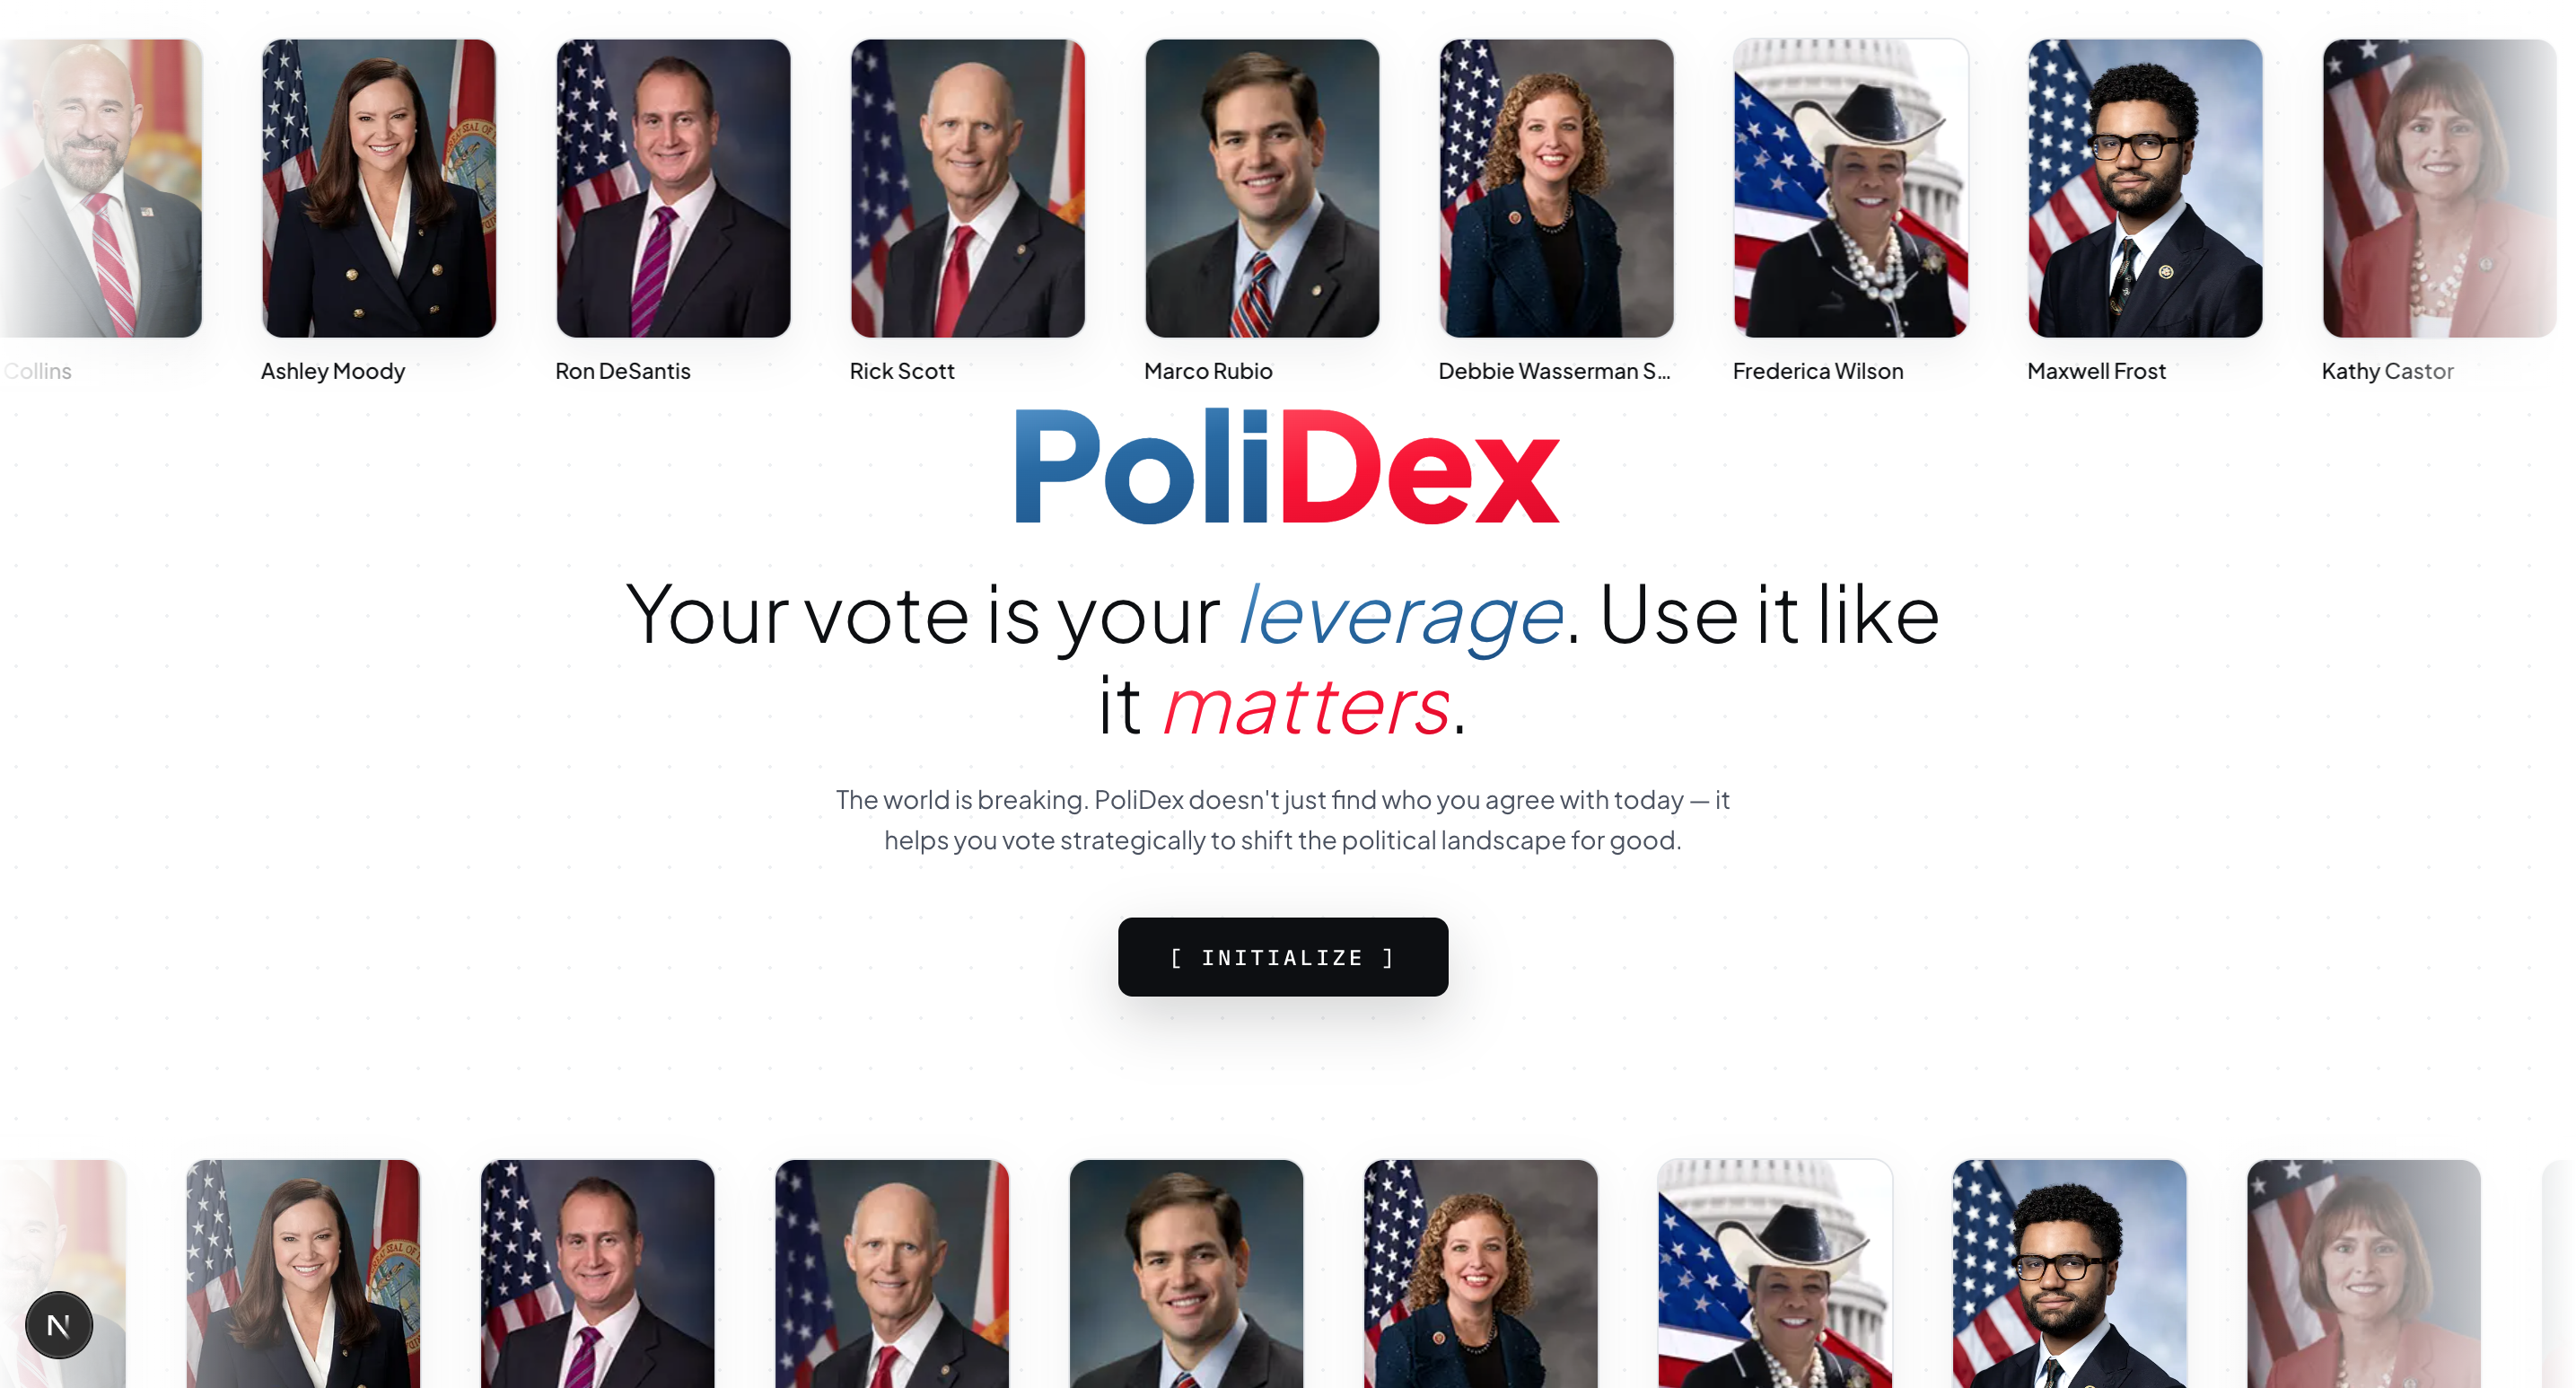
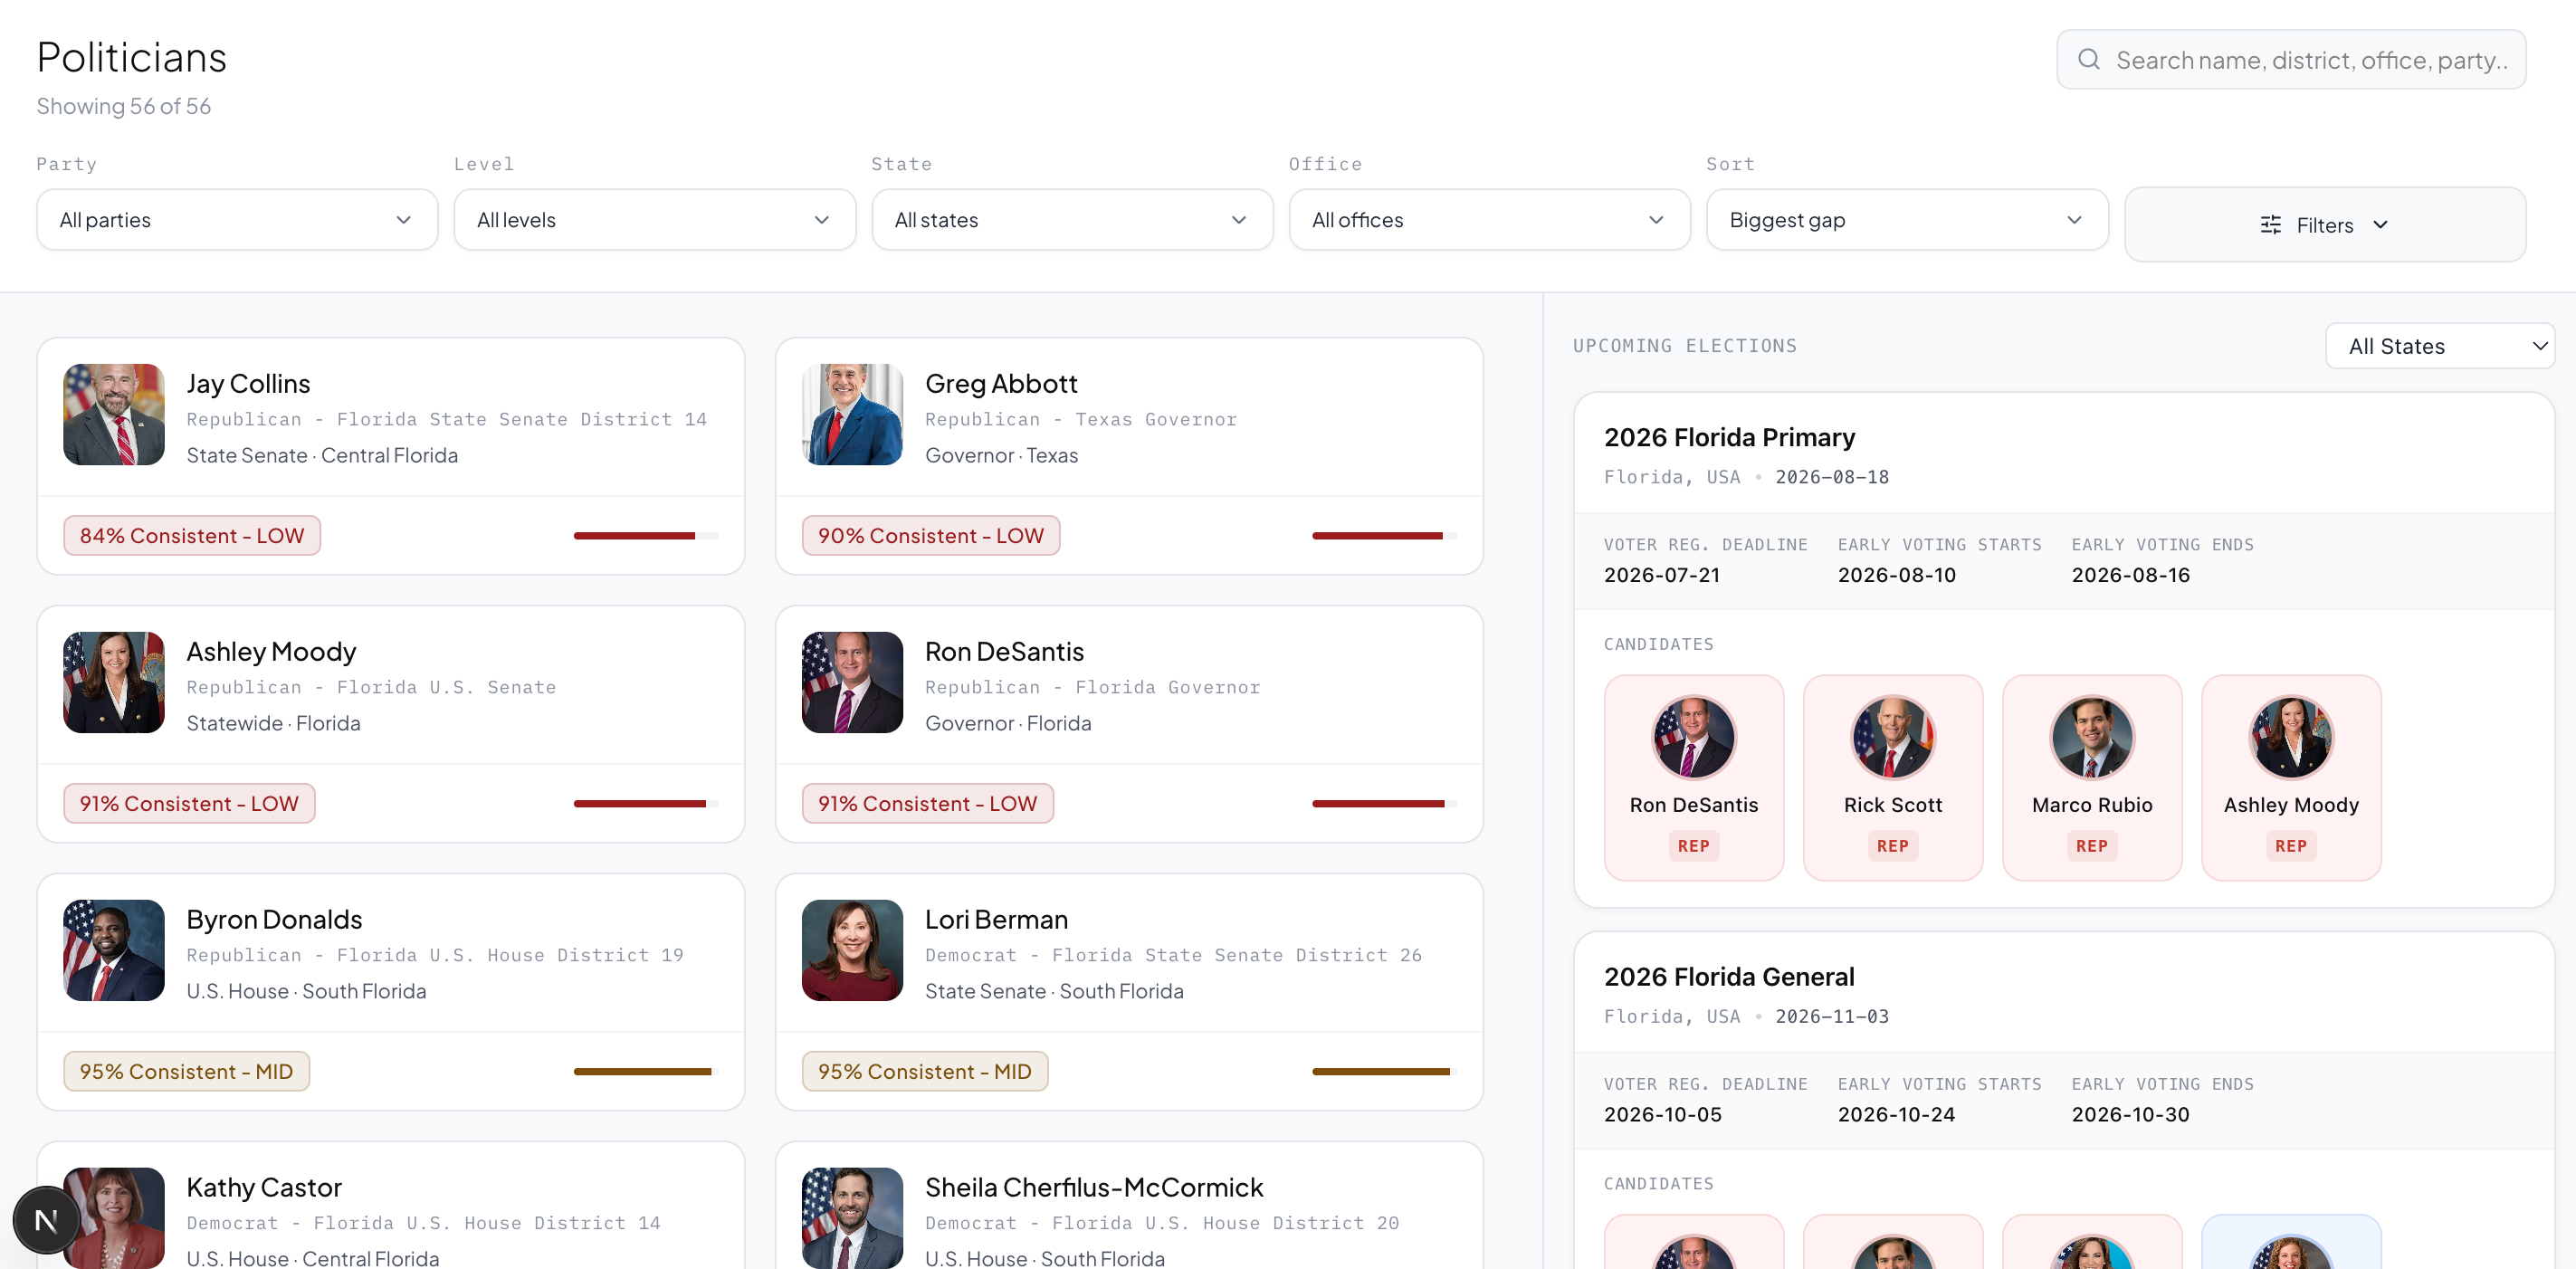
Landing page
-
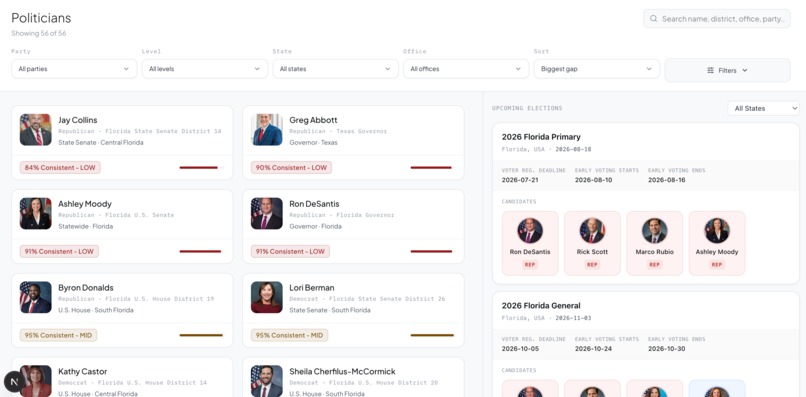
Dashboard view
-
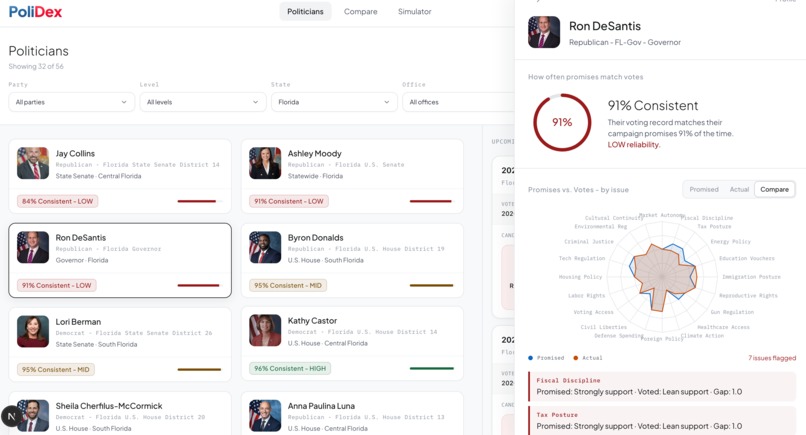
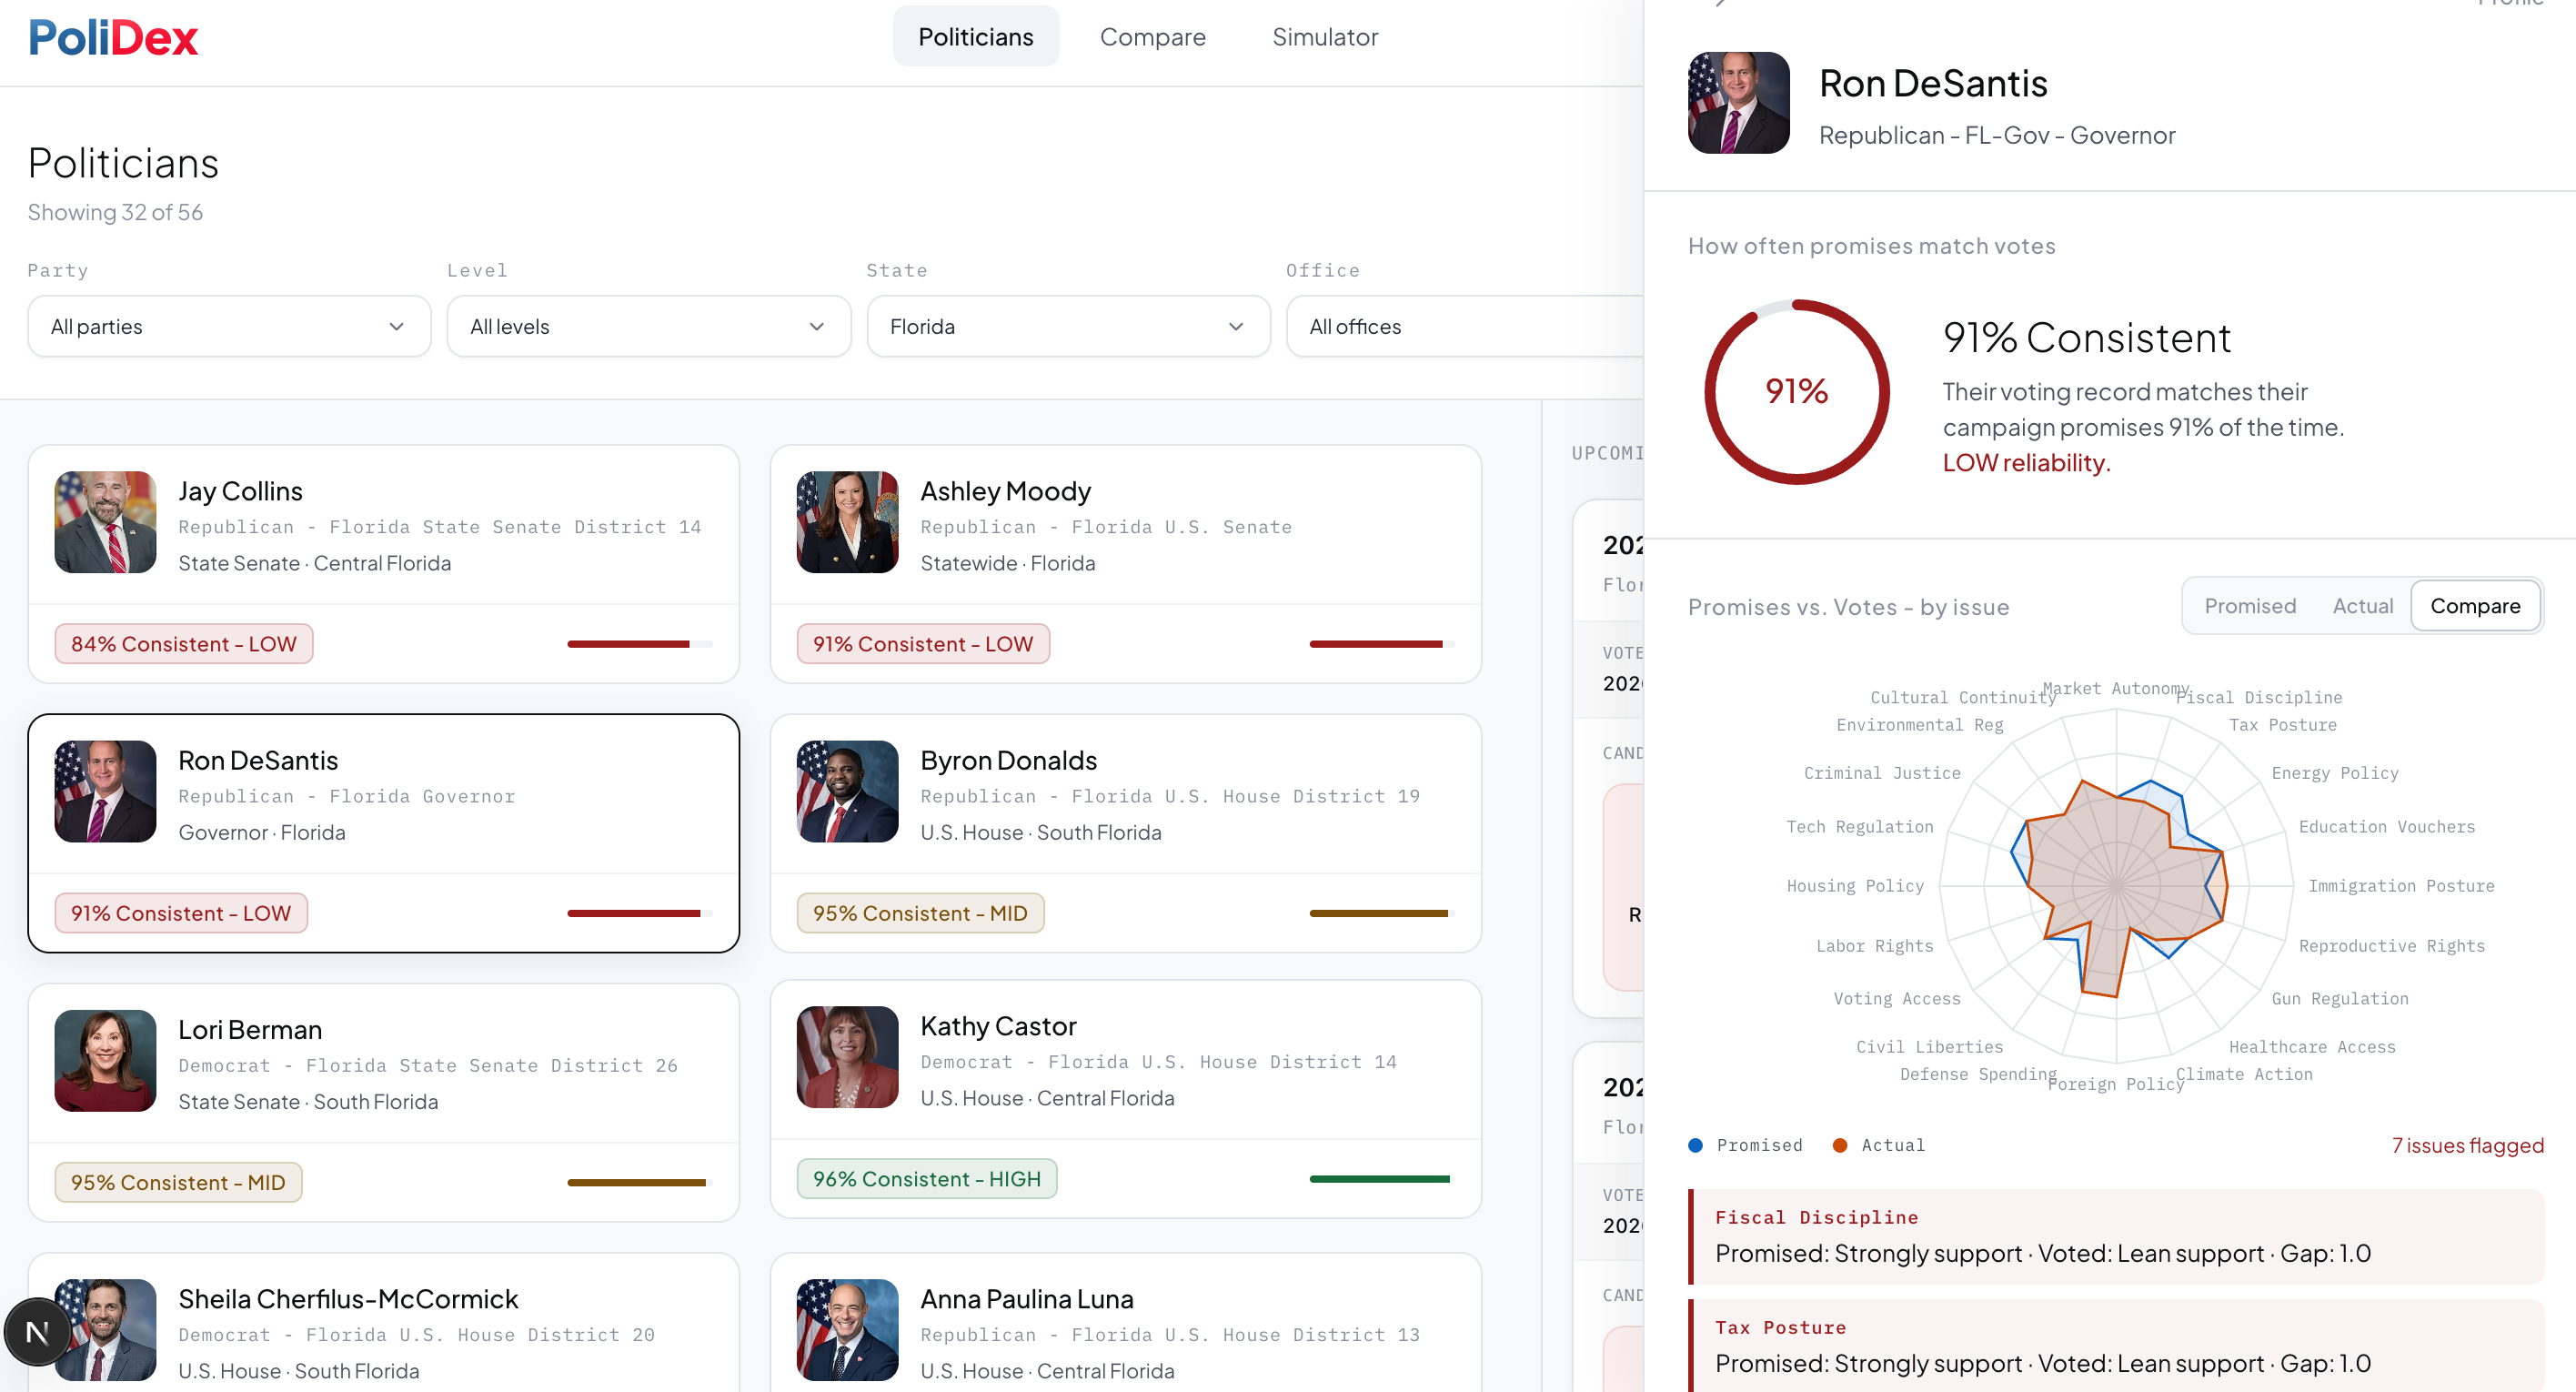
Politician analysis part 1
-
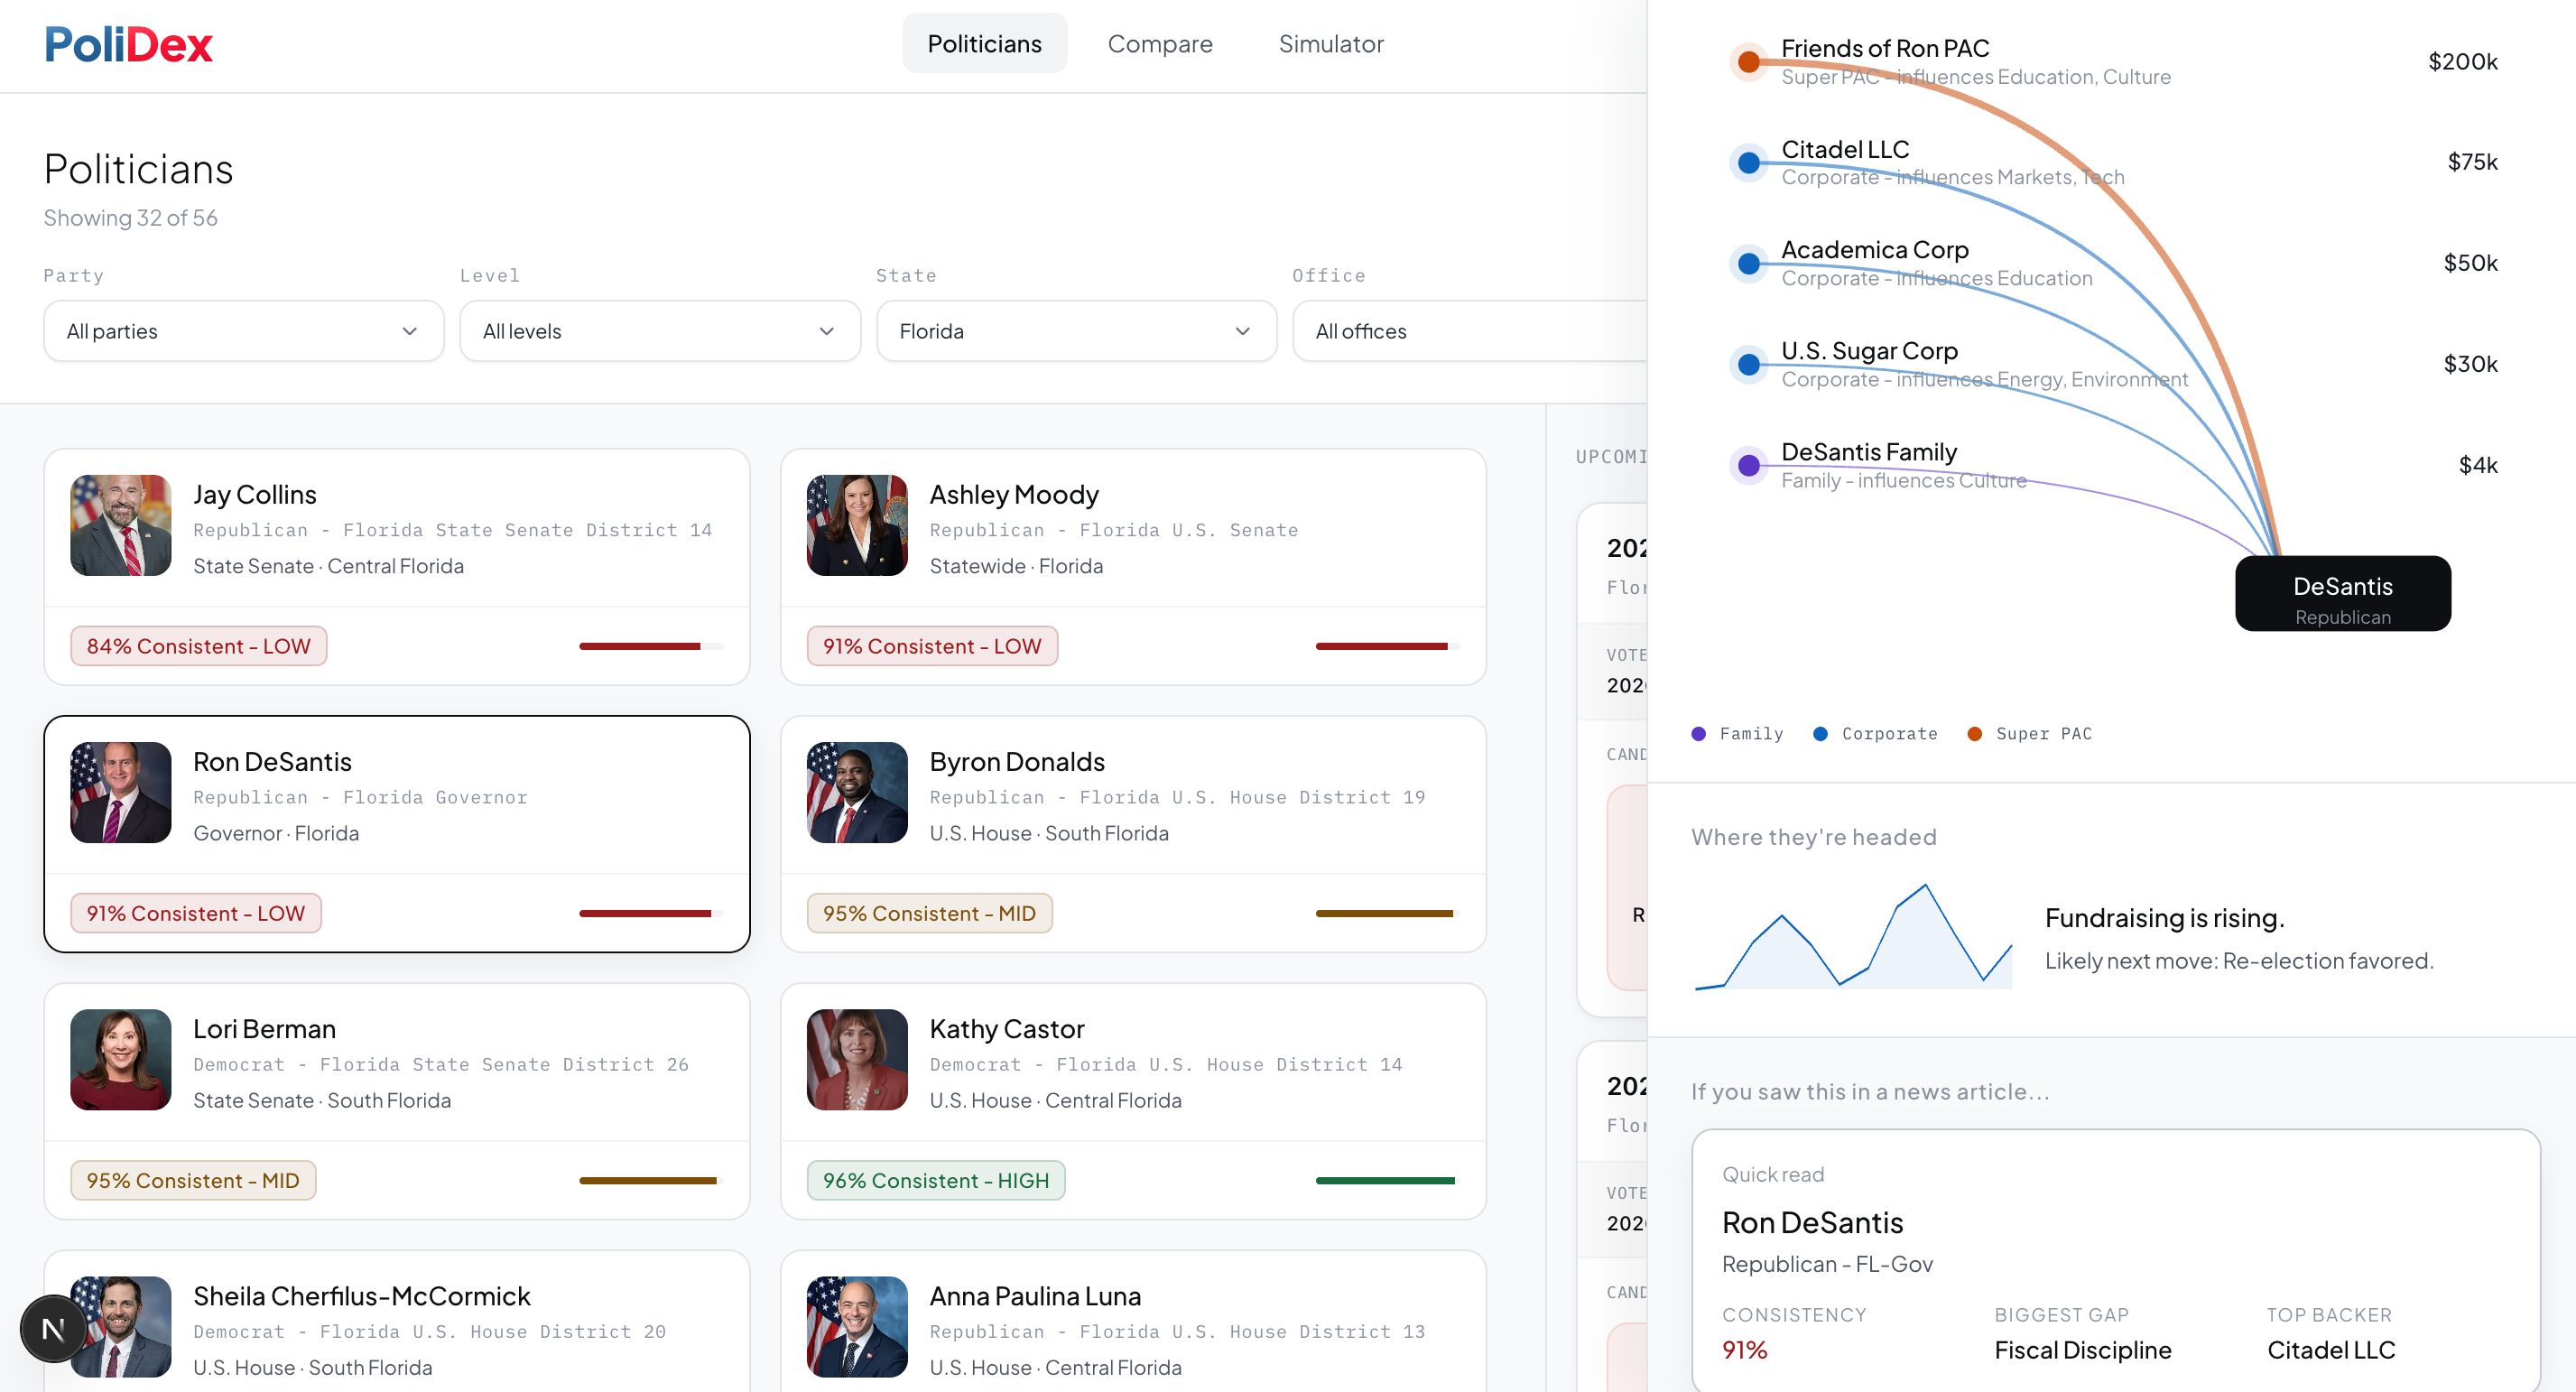
Politician analysis part 2
-

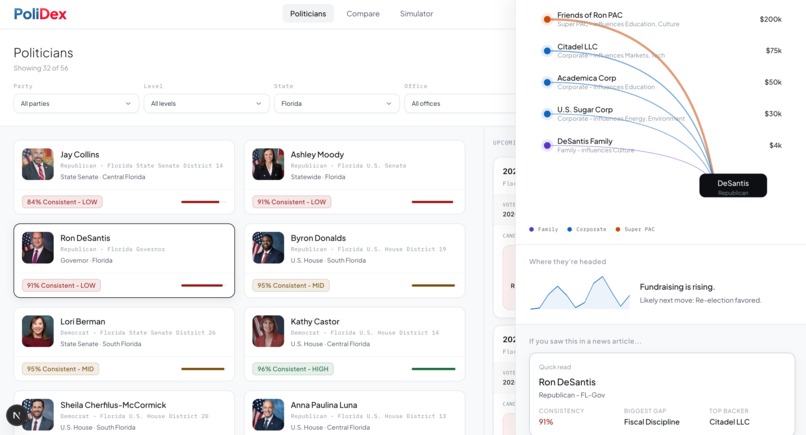
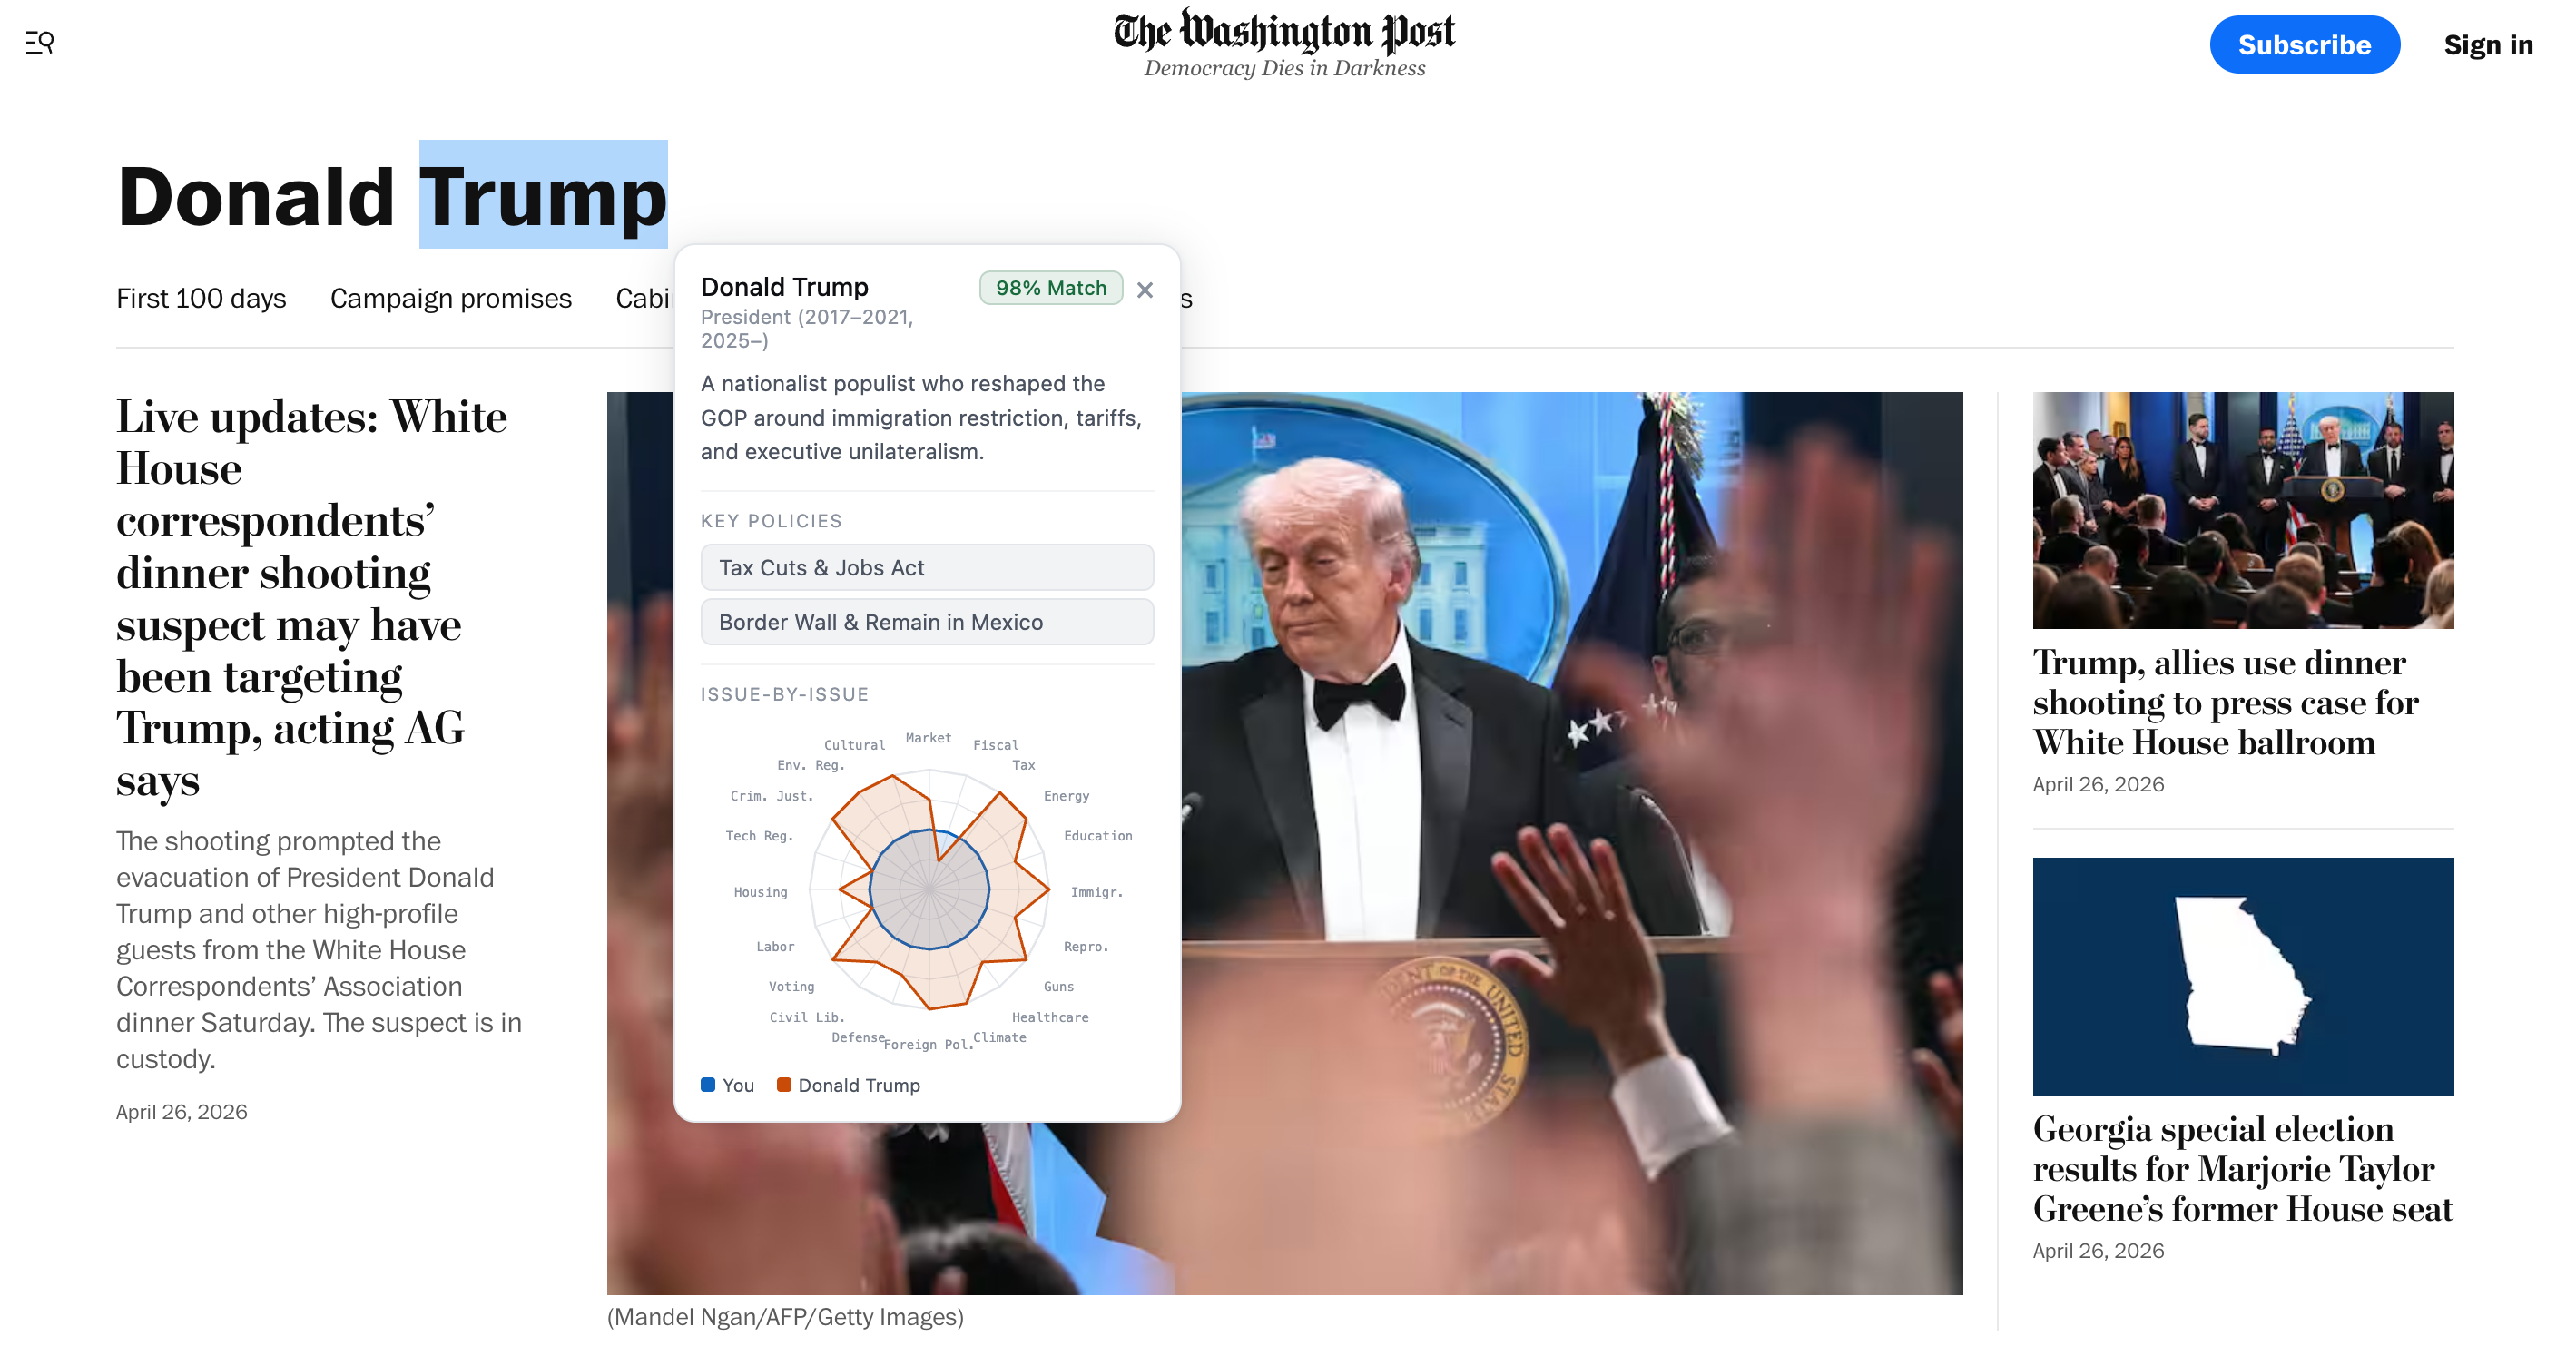
Chrome extension
-
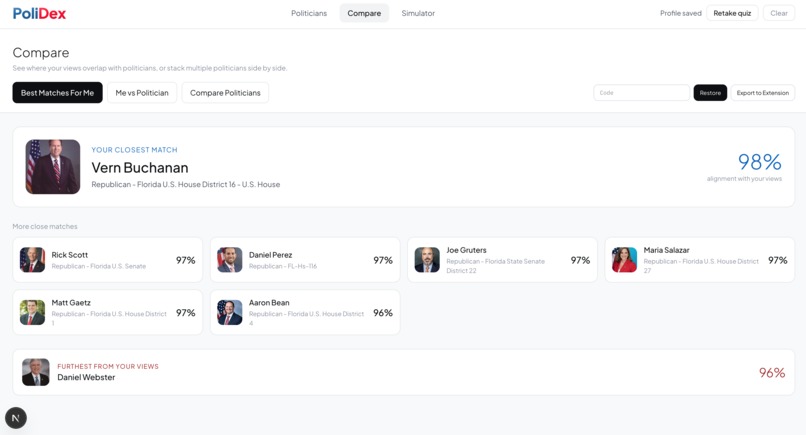
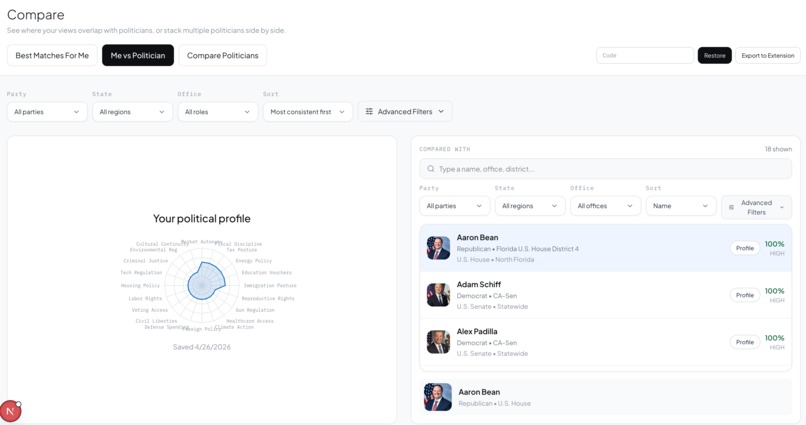
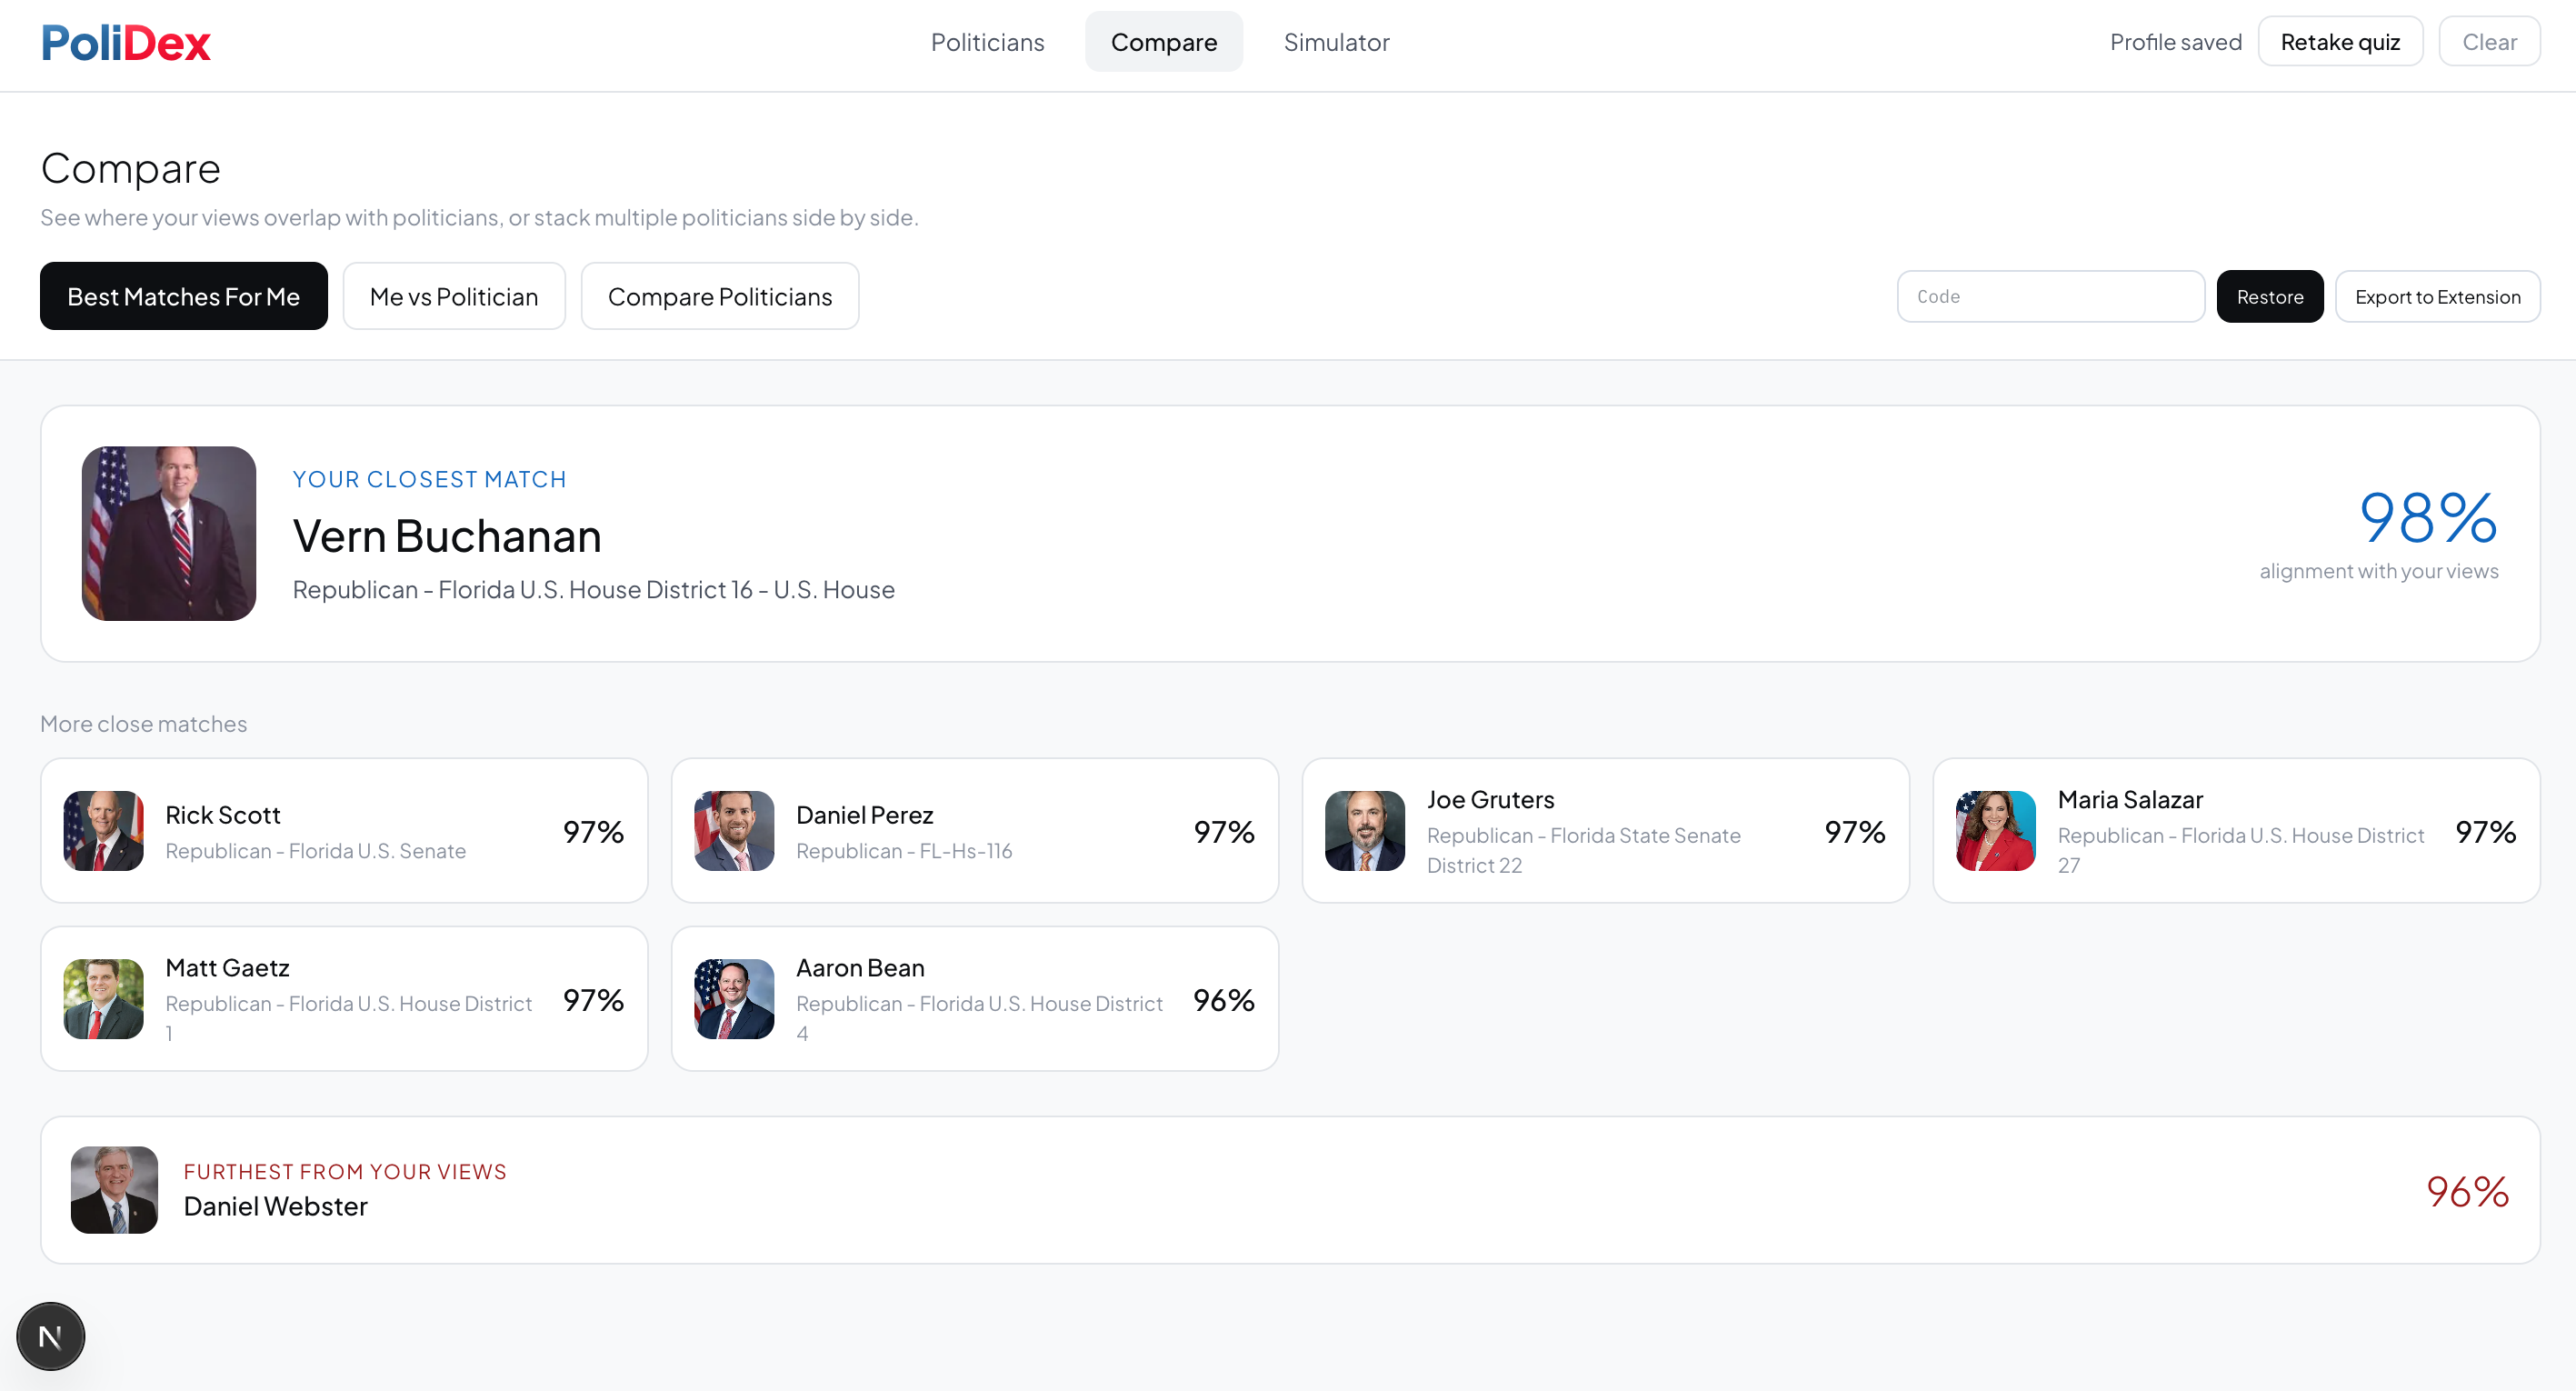
Politician Match
-
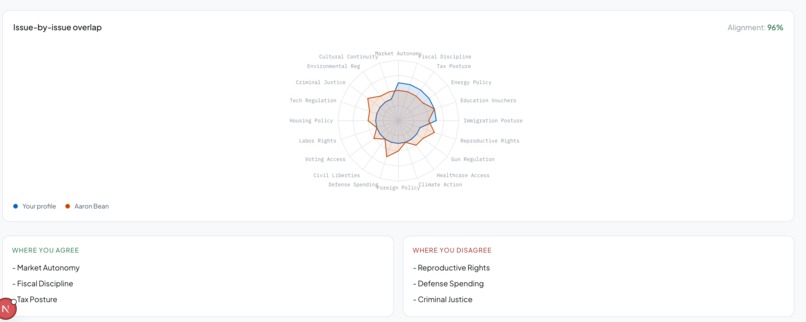
Comparison 1
-
Comparison 2
-
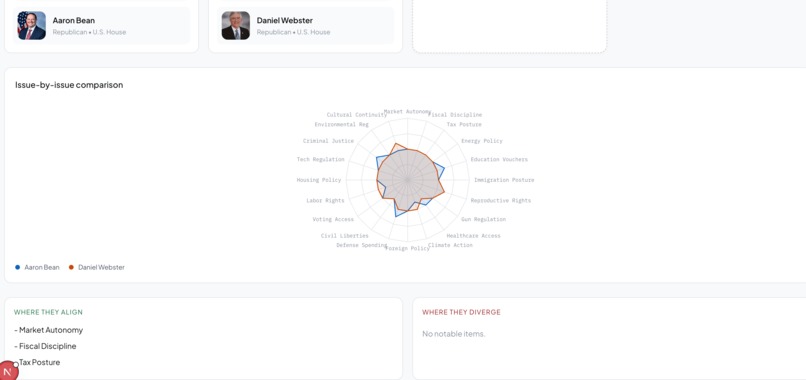
Comparison between politicians
Inspiration
As college students, we have just entered the voting world. Many people don't know who to vote for, and many don't even think their vote matters. With all the noise of social media it's really hard to believe that us as individuals can have an impact and advocate for what we value. In addition, we don't even know which politicians really support us.
Trust in mass media has hit an all-time low — only 28% of Americans trust it to report accurately (Gallup, 2025), down from 68% in 1972. At the same time, voter turnout in 2024 dropped to 65.3%, with less than half of eligible 18–24 year olds casting a ballot (U.S. Census Bureau). And 51% of Americans say misinformation is a "very big problem" (Pew Research Center).
The common thread: people don't trust their information sources, so they disengage. We wanted to replace opinion and spin with something that can't be biased - math. Politicians say one thing and vote another. PoliDex shows you who actually represents you, using their real voting record.
What it does
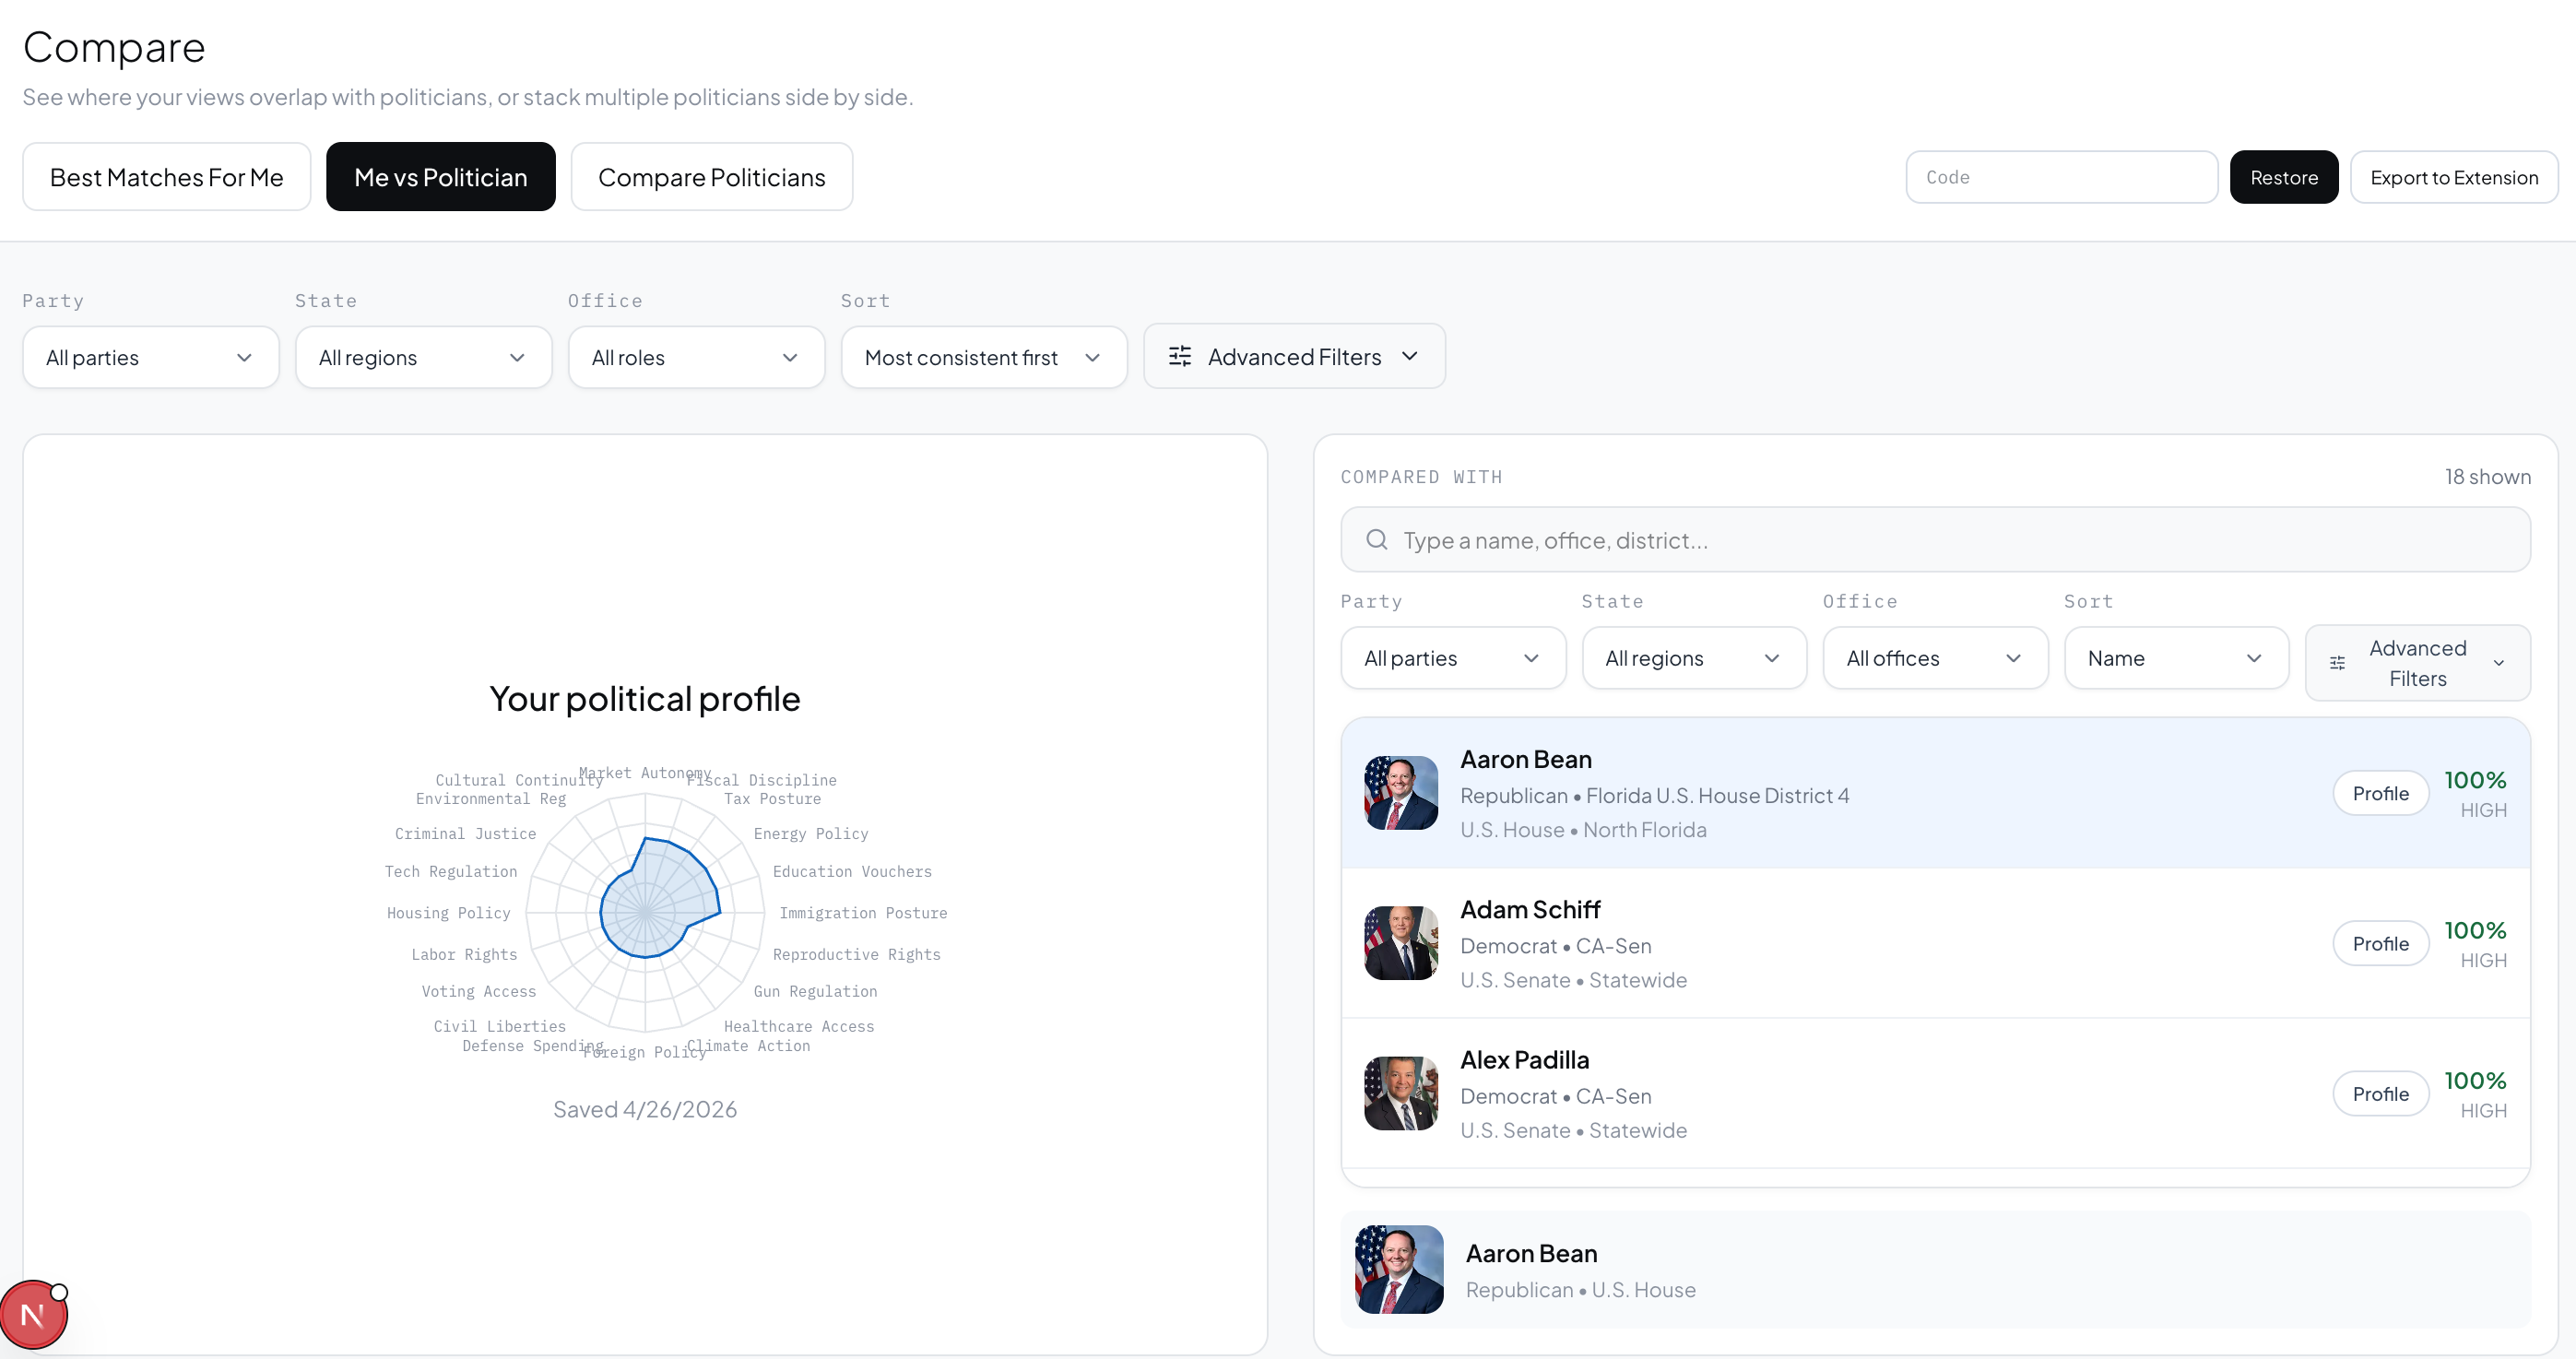
PoliDex is a political alignment engine built around a 20-dimensional policy vector space. Every politician gets a coordinate across 20 policy planks - Fiscal Policy, Civil Liberties, Energy, Healthcare, Foreign Policy, and more - scored from 1–5 based on their actual legislative record and stated positions.
Take a quiz. Answer 20 questions about your own positions. We generate your personal policy vector and rank every politician by alignment score.
Flip the Adherence Toggle. By default, scores reflect stated positions ("who says they agree with you"). Toggle it on and the engine re-weights each dimension by $w_i = 1/\sigma_i$ across a politician's voting history - consistent dimensions count more. Now you see who actually follows through.
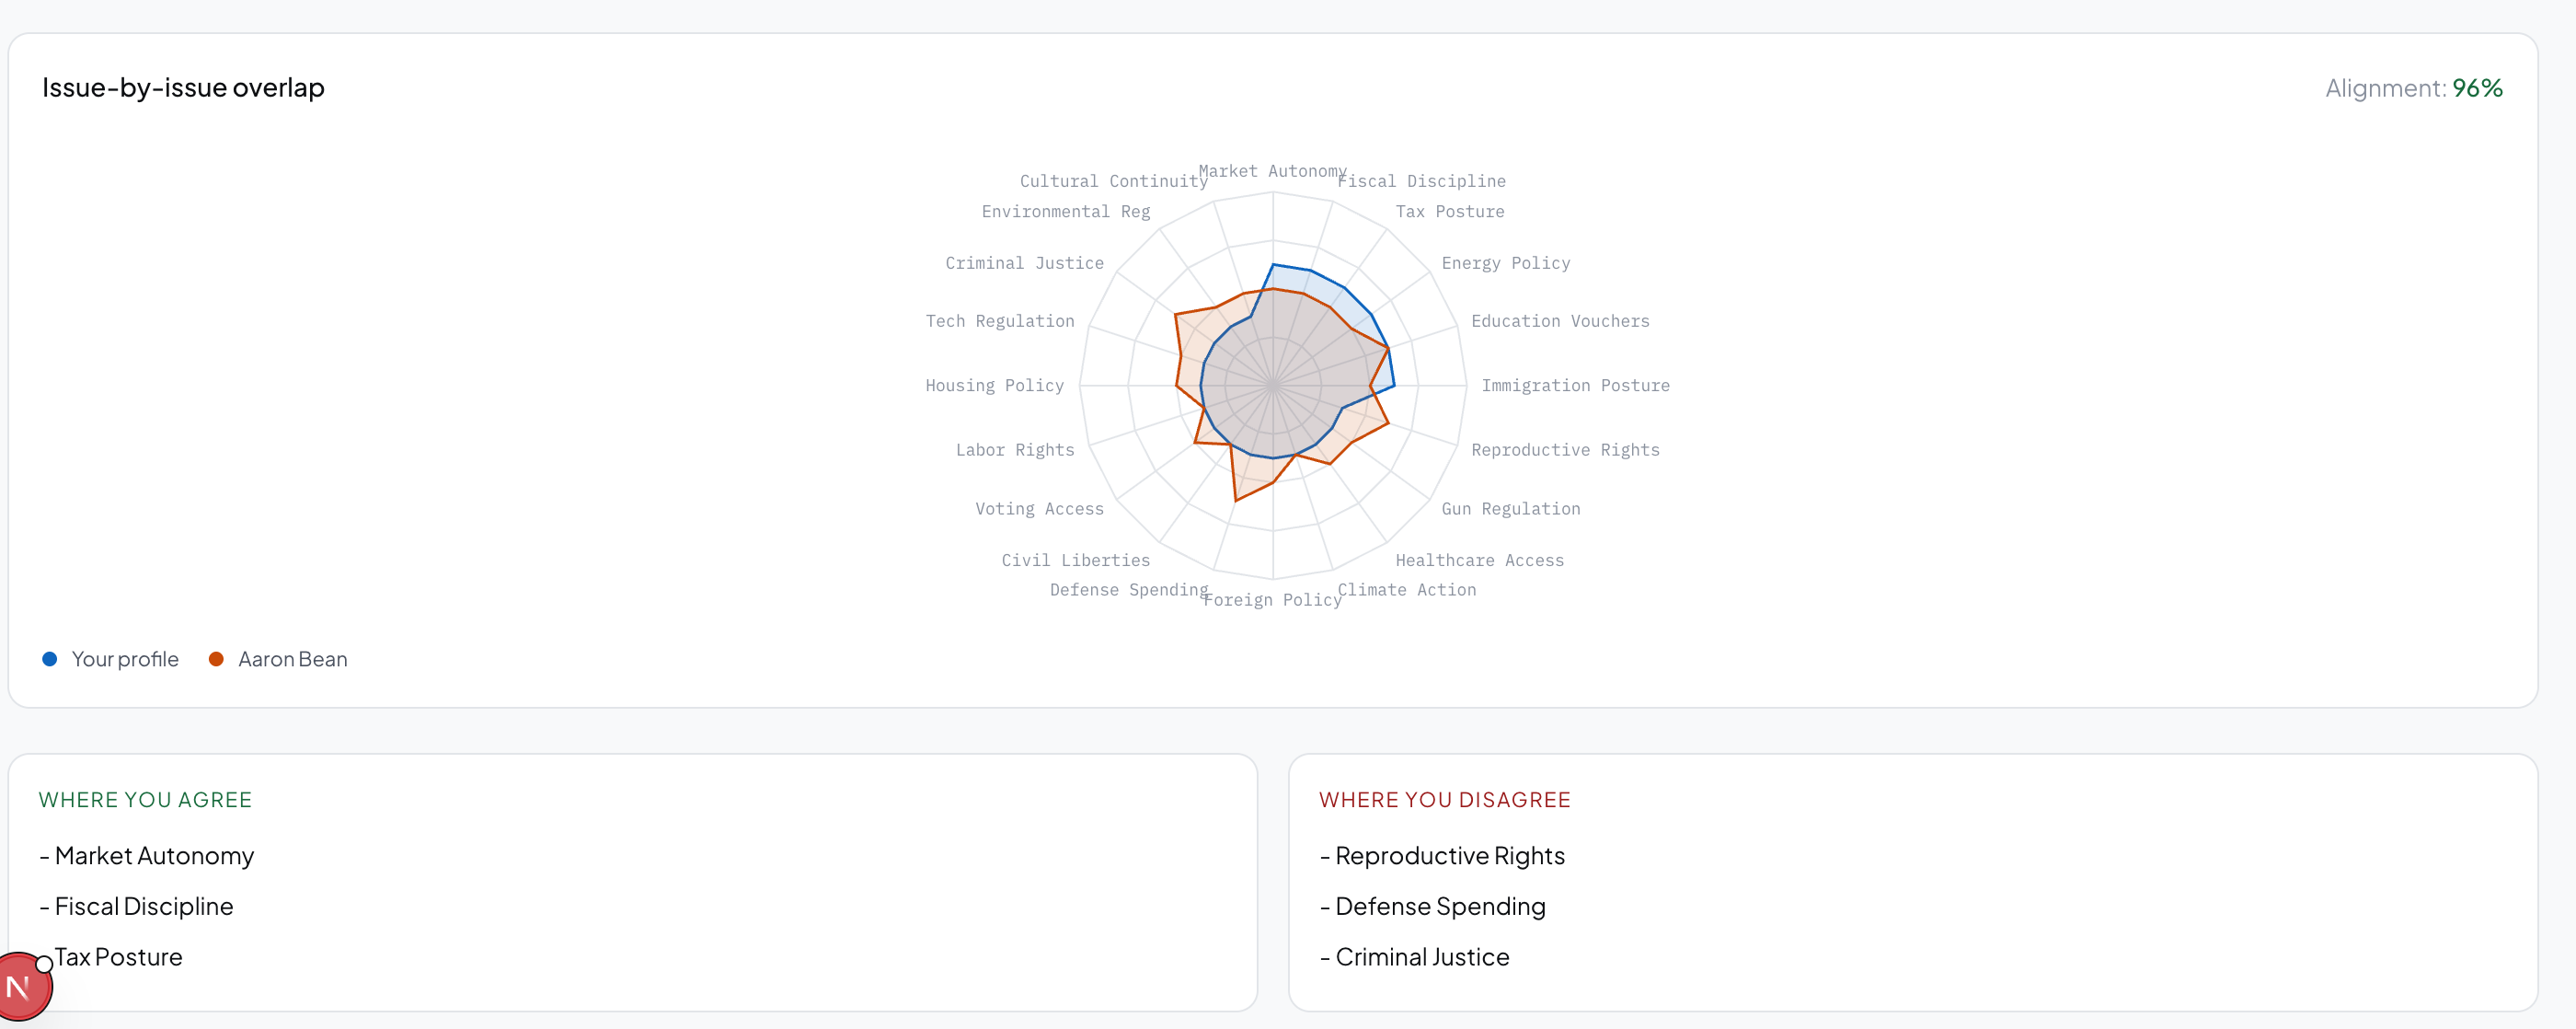
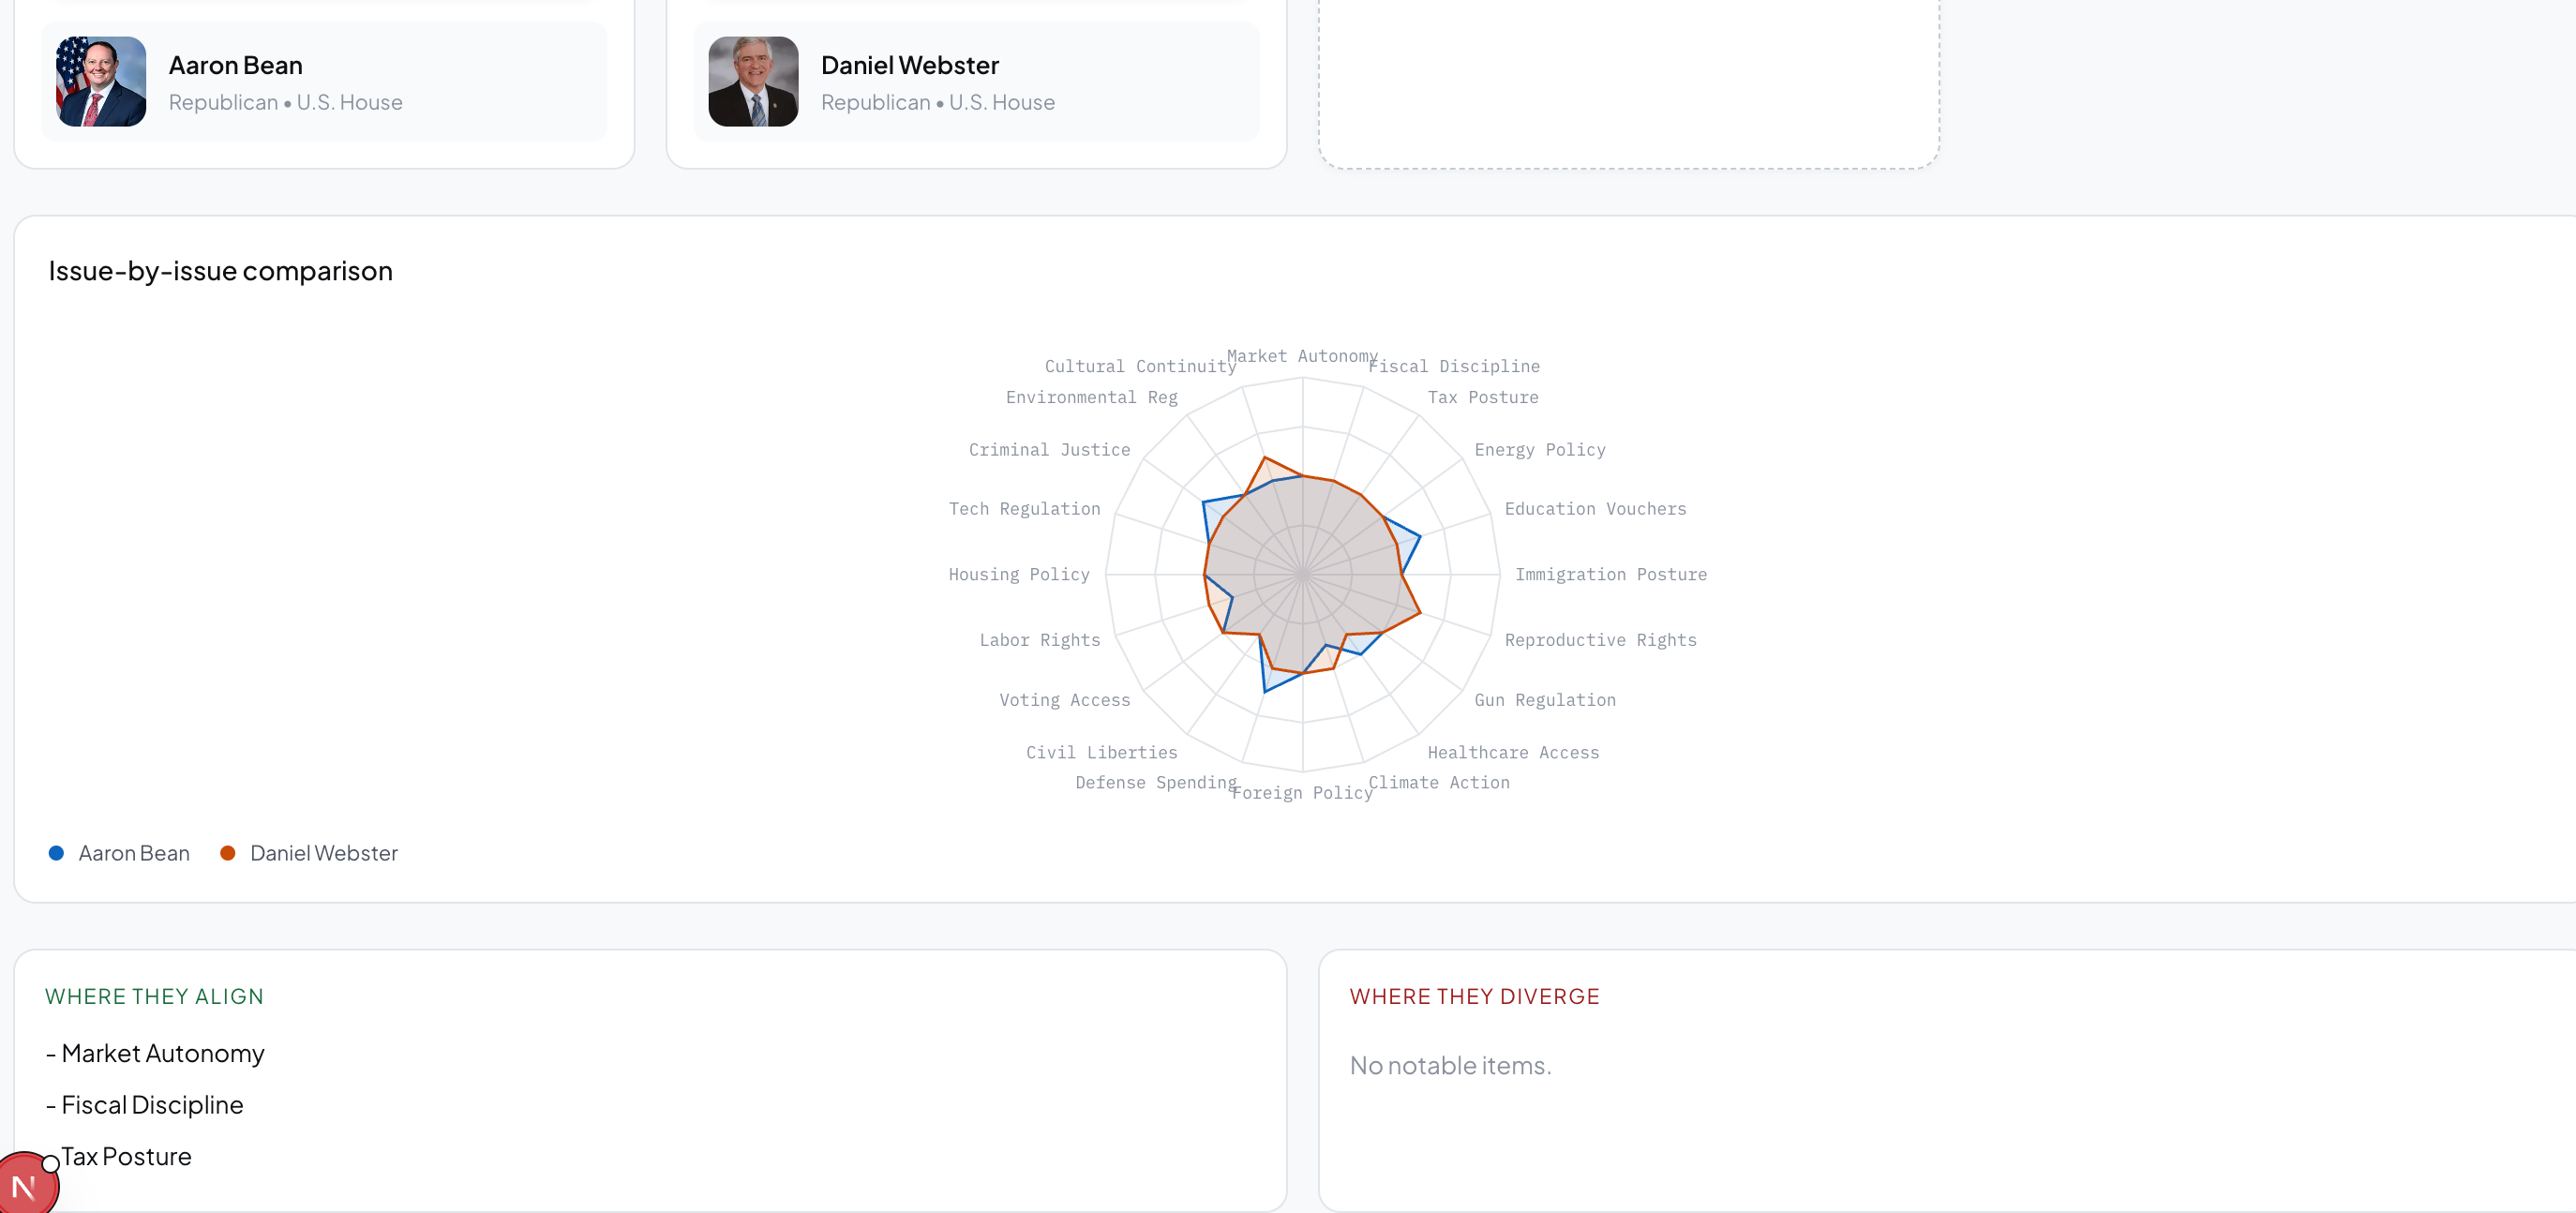
Head-to-head comparison. Radar charts and an issue-by-issue overlap graph show where any two politicians align and diverge across all 20 dimensions simultaneously.
Influence Edge Map. A weighted graph of financial and organizational ties - Politicians → Super PACs → Corporate Donors — sourced from OpenFEC. Edges are verifiable-only (money, employment, family). No speculation.
Chrome Extension HUD. Double-click any politician name on any webpage. An alignment card pops up with your % match, top aligned and misaligned policy dimensions, and their top implemented policies — all derived from their voting record, not their campaign website.
Political Simulation: An asynchronous orchestration layer that synthesizes 20D PoliVectors and legislative RAG data via Gemini to generate persona-consistent debate transcripts. Audio is rendered using ElevenLabs TTS voice-cloning, with all simulation states cached in IndexedDB to maintain a local-first architecture.
How we built it
The system has three cleanly separated layers communicating through strict data contracts.
Java chassis handles all orchestration: HTTP routing (RequestHandler.java), MongoDB persistence, a k-d tree spatial index (LibraryIndexer.java) for sublinear nearest-neighbor search in 20D space, and a PythonRunner.java IPC bridge that pipes JSON payloads to Python workers via stdin/stdout.
Python inference engine contains all stateless math in isolated modules. The core is a weighted cosine similarity function we derived ourselves:
$$\text{Similarity} = \frac{\sum (w_i \cdot v_{\text{input},i} \cdot v_{\text{poli},i})}{\sqrt{\sum w_i \cdot v_{\text{input},i}^2} \cdot \sqrt{\sum w_i \cdot v_{\text{poli},i}^2}}$$
weight_calculator.py computes adherence weights via $1/\sigma$ across voting history. constraint_discoverer.py derives exclusion bounds from disliked politicians' vectors. llm_analyst.py calls Gemini 3.0-flash to tag raw OpenStates legislative data into validated 20D PoliVectors.
Next.js frontend (React 19, TypeScript, Tailwind CSS v4) surfaces the full dashboard - quiz, comparisons, simulator, edge map - as a local-first desktop app. The Chrome Extension runs Manifest V3 with a service worker, content script, and popup, with a JS port of the cosine engine (cosine_bridge.js) running client-side.
Data flows in from six external APIs: OpenStates, Congress.gov, Google Civic Info, OpenFEC, Legiscan, and Wikimedia.
Challenges we ran into
Designing the math. Standard cosine similarity gives equal weight to every dimension. We needed a formula that could shift the notion of "closeness" based on a politician's consistency without changing the underlying calculation. Getting the per-dimension adherence weighting right required working through the math before writing any code.
Java ↔ Python IPC. Subprocess pipes work, but working directory, path resolution, and the serialization contract all have to be exactly right. A single wrong assumption returns empty results silently - and debugging that under a deadline is butt.
Making 20 dimensions feel human. A 20D vector comparison is not intuitive. Deciding how to surface that as something a non-technical user instantly understands - radar charts, the toggle animation, the overlap graph - was harder than any individual engineering problem.
The frontend/backend pipeline. Wiring the Next.js client to the Java backend with a clean fallback for offline mode required more coordination than expected, especially when refactoring at 3 AM :(
Accomplishments that we're proud of
An original math equation. The weighted cosine similarity formula is ours. We didn't find it in a paper — we derived it to fit the specific constraint that policy dimensions have independent variance and should be re-weighted by consistency.
The Adherence Toggle. The mechanic of animating a politician's dot from their stated position to their actual legislative position is one of those ideas that only works if the entire data pipeline is built correctly end-to-end. We made it work.
A full multi-language inference pipeline — Java orchestration, Python math workers, MongoDB vector store, LLM tagging, and a live Chrome extension - all integrated and functional within 24 hours.
Strict modularity under pressure. Every file has a single responsibility. We were refactoring at 3 AM and the architecture held.
What we learned
Pre-planning is a force multiplier. Defining taxonomy.json and vector.schema before writing any implementation meant the whole team worked in parallel without conflicts. Every hour spent on contracts saved three hours of integration debugging.
Vector databases require a different mental model. Moving from row-based lookups to spatial nearest-neighbor search in 20D space - and building a k-d tree to support it - reshaped how we think about retrieval entirely.
Custom math requires first-principles thinking. You can't just reach for a formula when the problem doesn't fit standard assumptions. We had to understand why weighted cosine similarity does what it does before we could extend it.
UI is a design problem, not a data problem. Having the scores was easy. Making them legible and meaningful to a non-technical voter required as much thought as the engineering.
Chrome extensions are their own world. Manifest V3's service worker model, content script isolation, and inter-context communication rules are completely different from standard web development — and the documentation assumes you already know most of it.
What's next for PoliDex
Richer edge map - deeper donor network visualization with timeline filtering by election cycle
Personalized alerts - notify users when a politician they're tracking votes against their stated position on a tracked issue
Relational maps - users can see who politicians are in contact with and are allied / on good terms with, including other countries for international affairs
Politician history and path - users can see the career path of a politician and predict the ladder they are trying to climb
Built With
- css
- electron
- elevenlabs
- gemini
- java
- javascript
- mongodb
- next.js
- python
- typescript


Log in or sign up for Devpost to join the conversation.