Inspiration
When a city debates rent control, a minimum wage, or an upzoning plan, nobody actually knows who it will help and who it will hurt until years later — after it's law, and the damage or benefit is already done. Policy gets made on ideology and vibes, and the people hurt most are usually the ones with the least voice in the room. Even when someone does care, they have no easy way to turn that concern into action.
We wanted to flip the order of operations: see the distributional consequences of a policy before anyone votes — on a model of your own community — and then act on it.
What it does
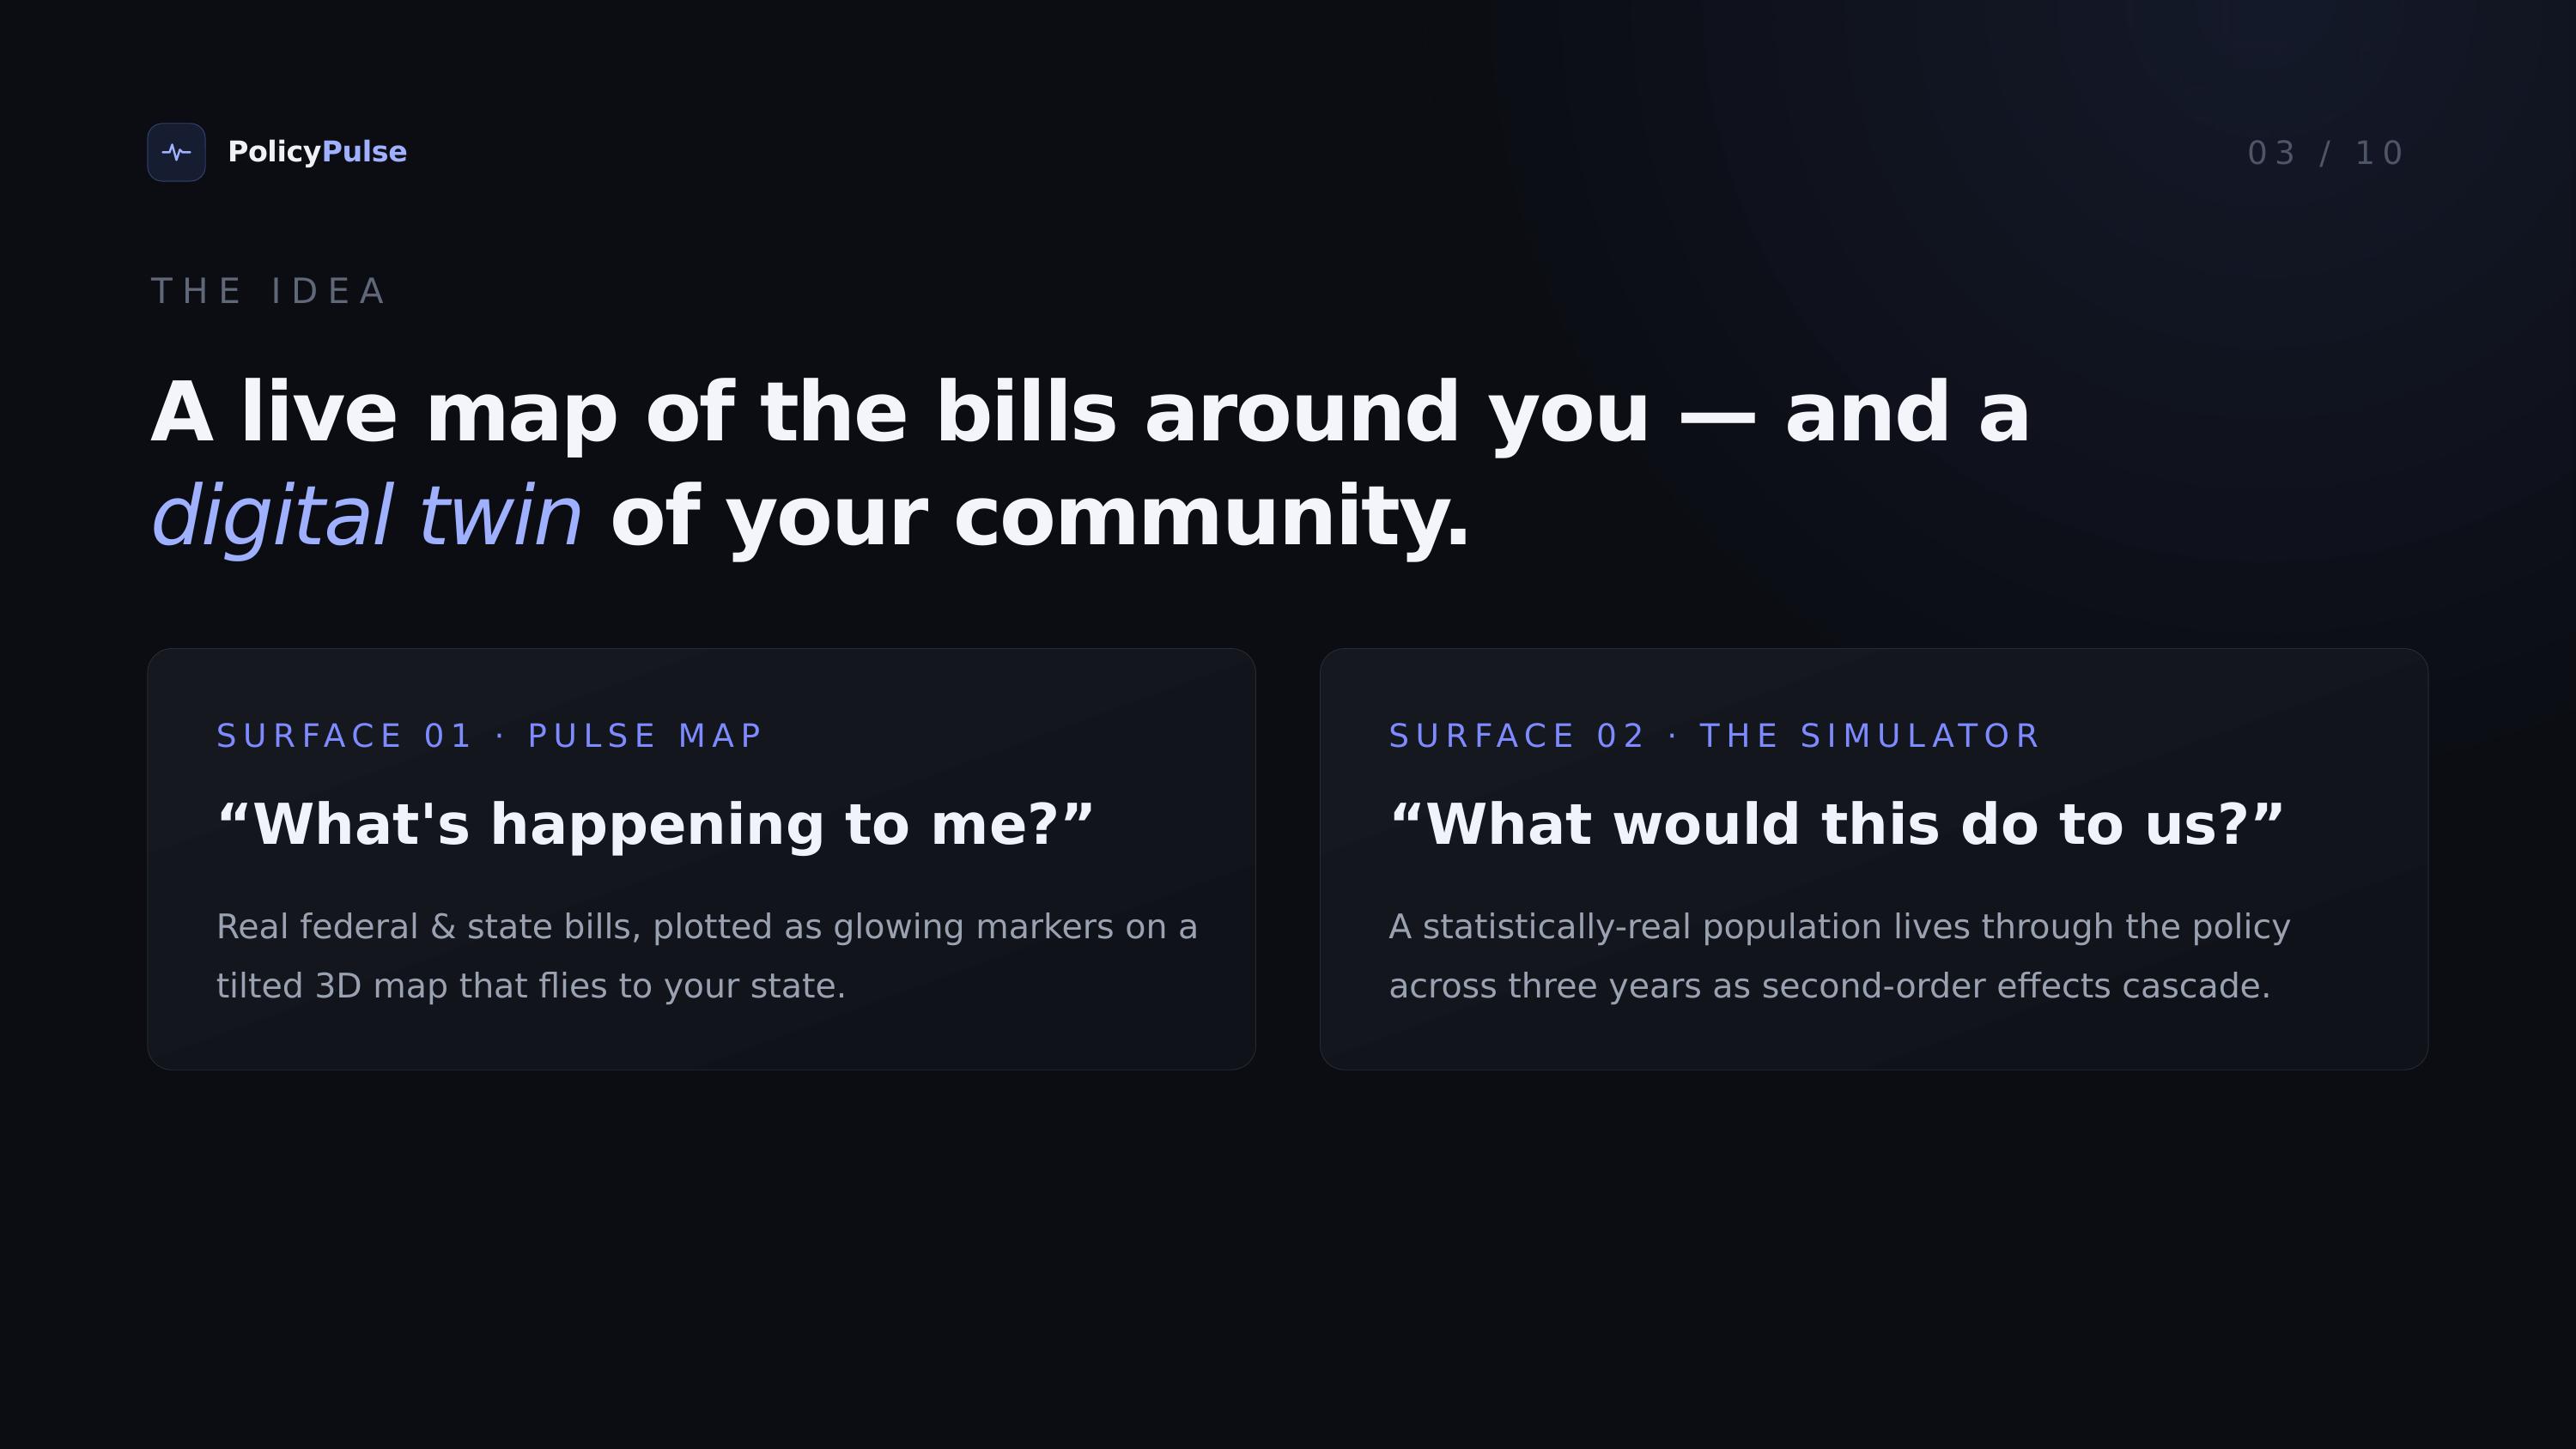
PolicyPulse has two halves that flow into each other.
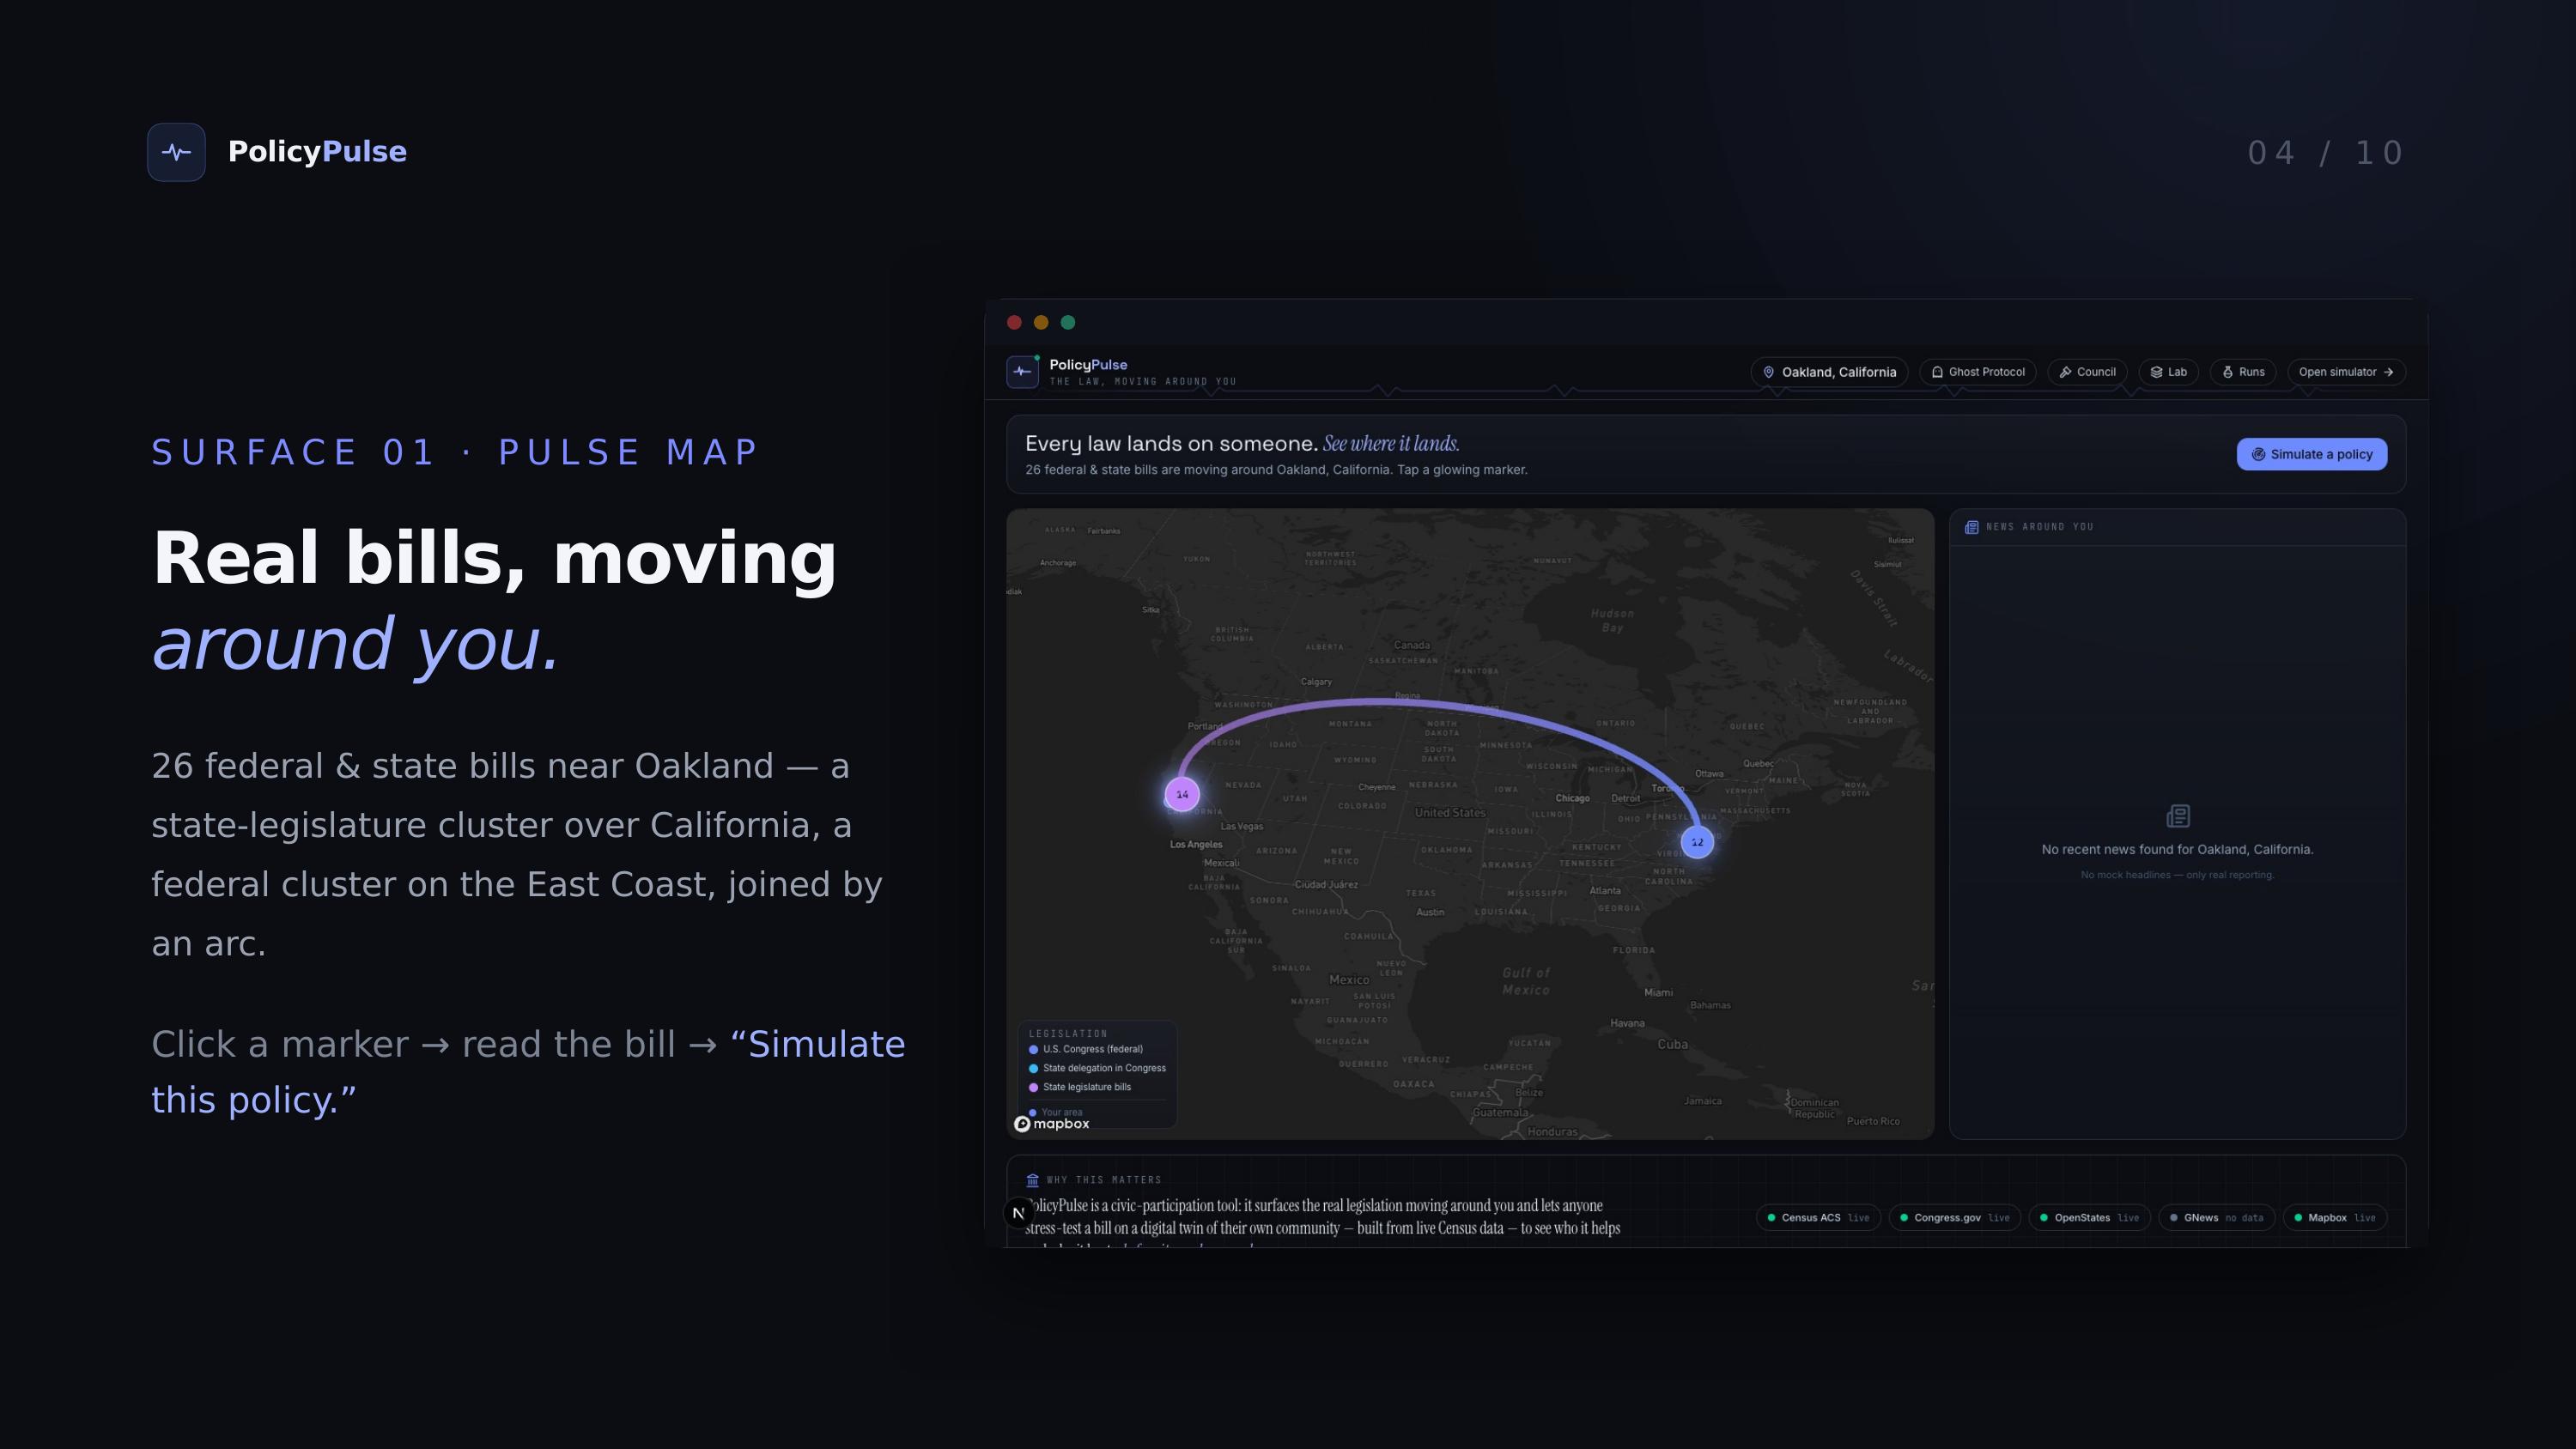
The Pulse Map finds your area and surfaces the real bills moving around you right now — live federal legislation from Congress.gov and state bills from OpenStates — plotted as markers on a 3D map, alongside a rail of real local policy news. Every marker is a real bill; nothing is mock data.
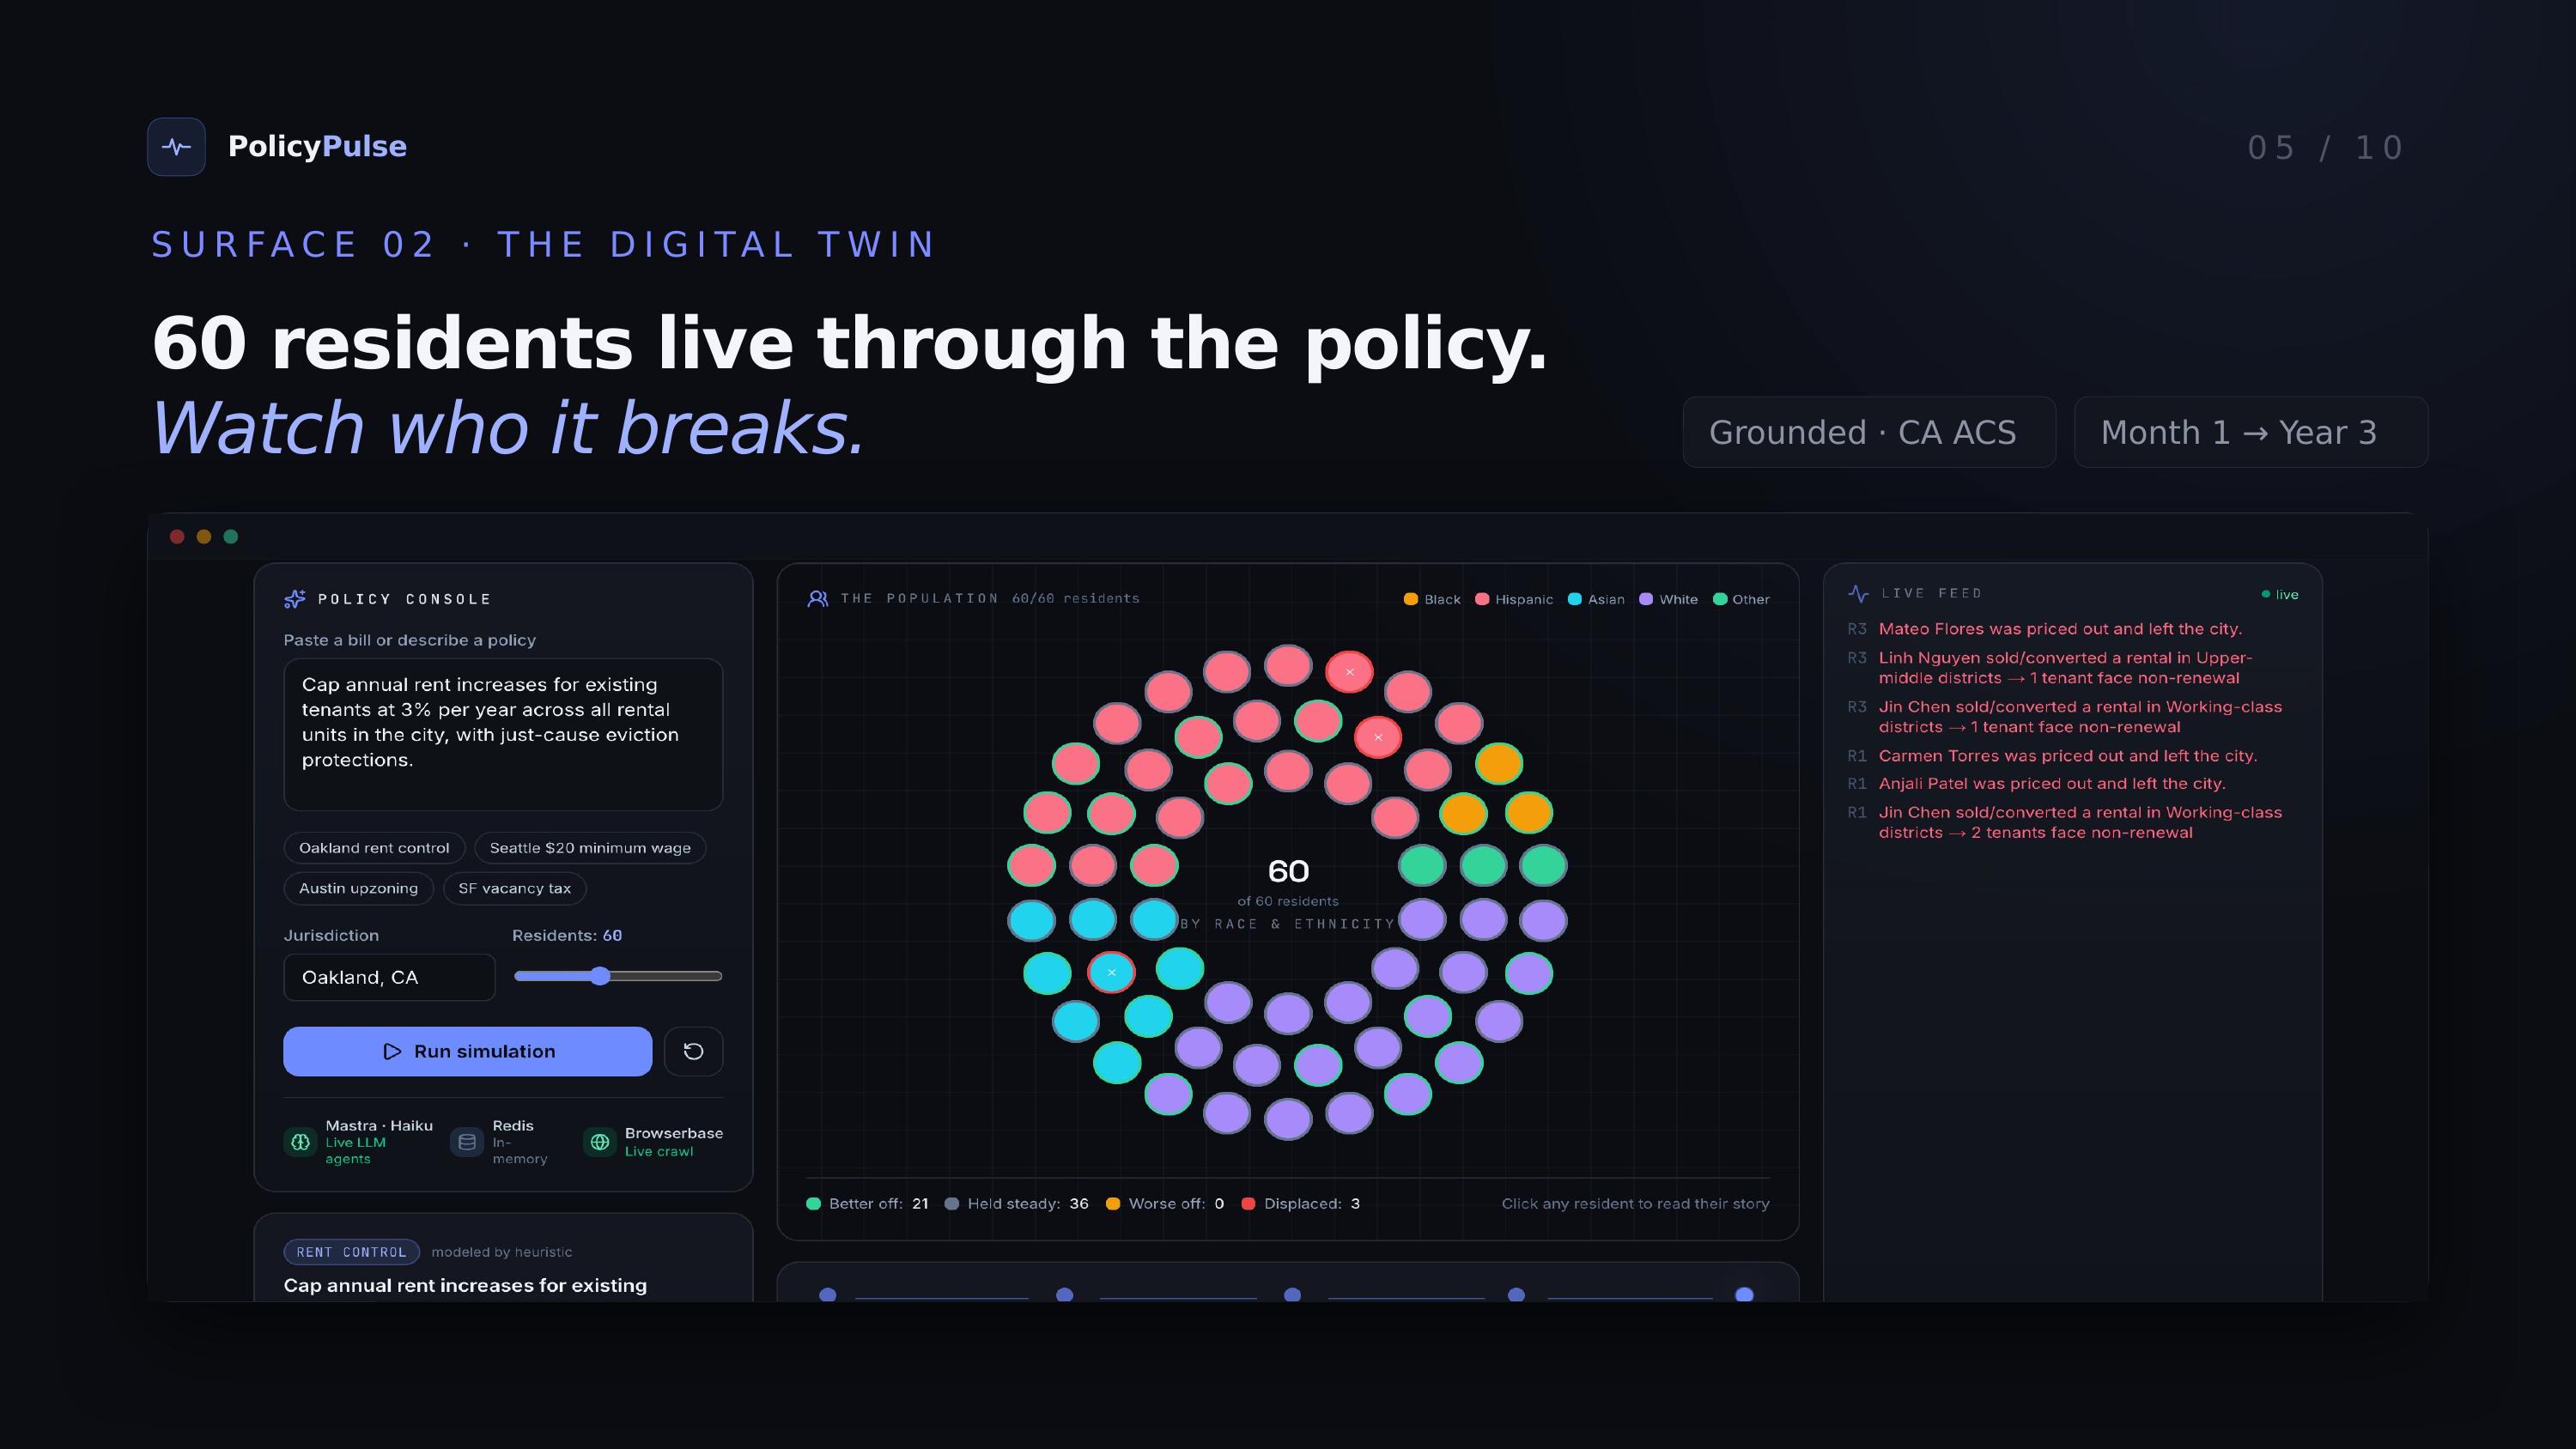
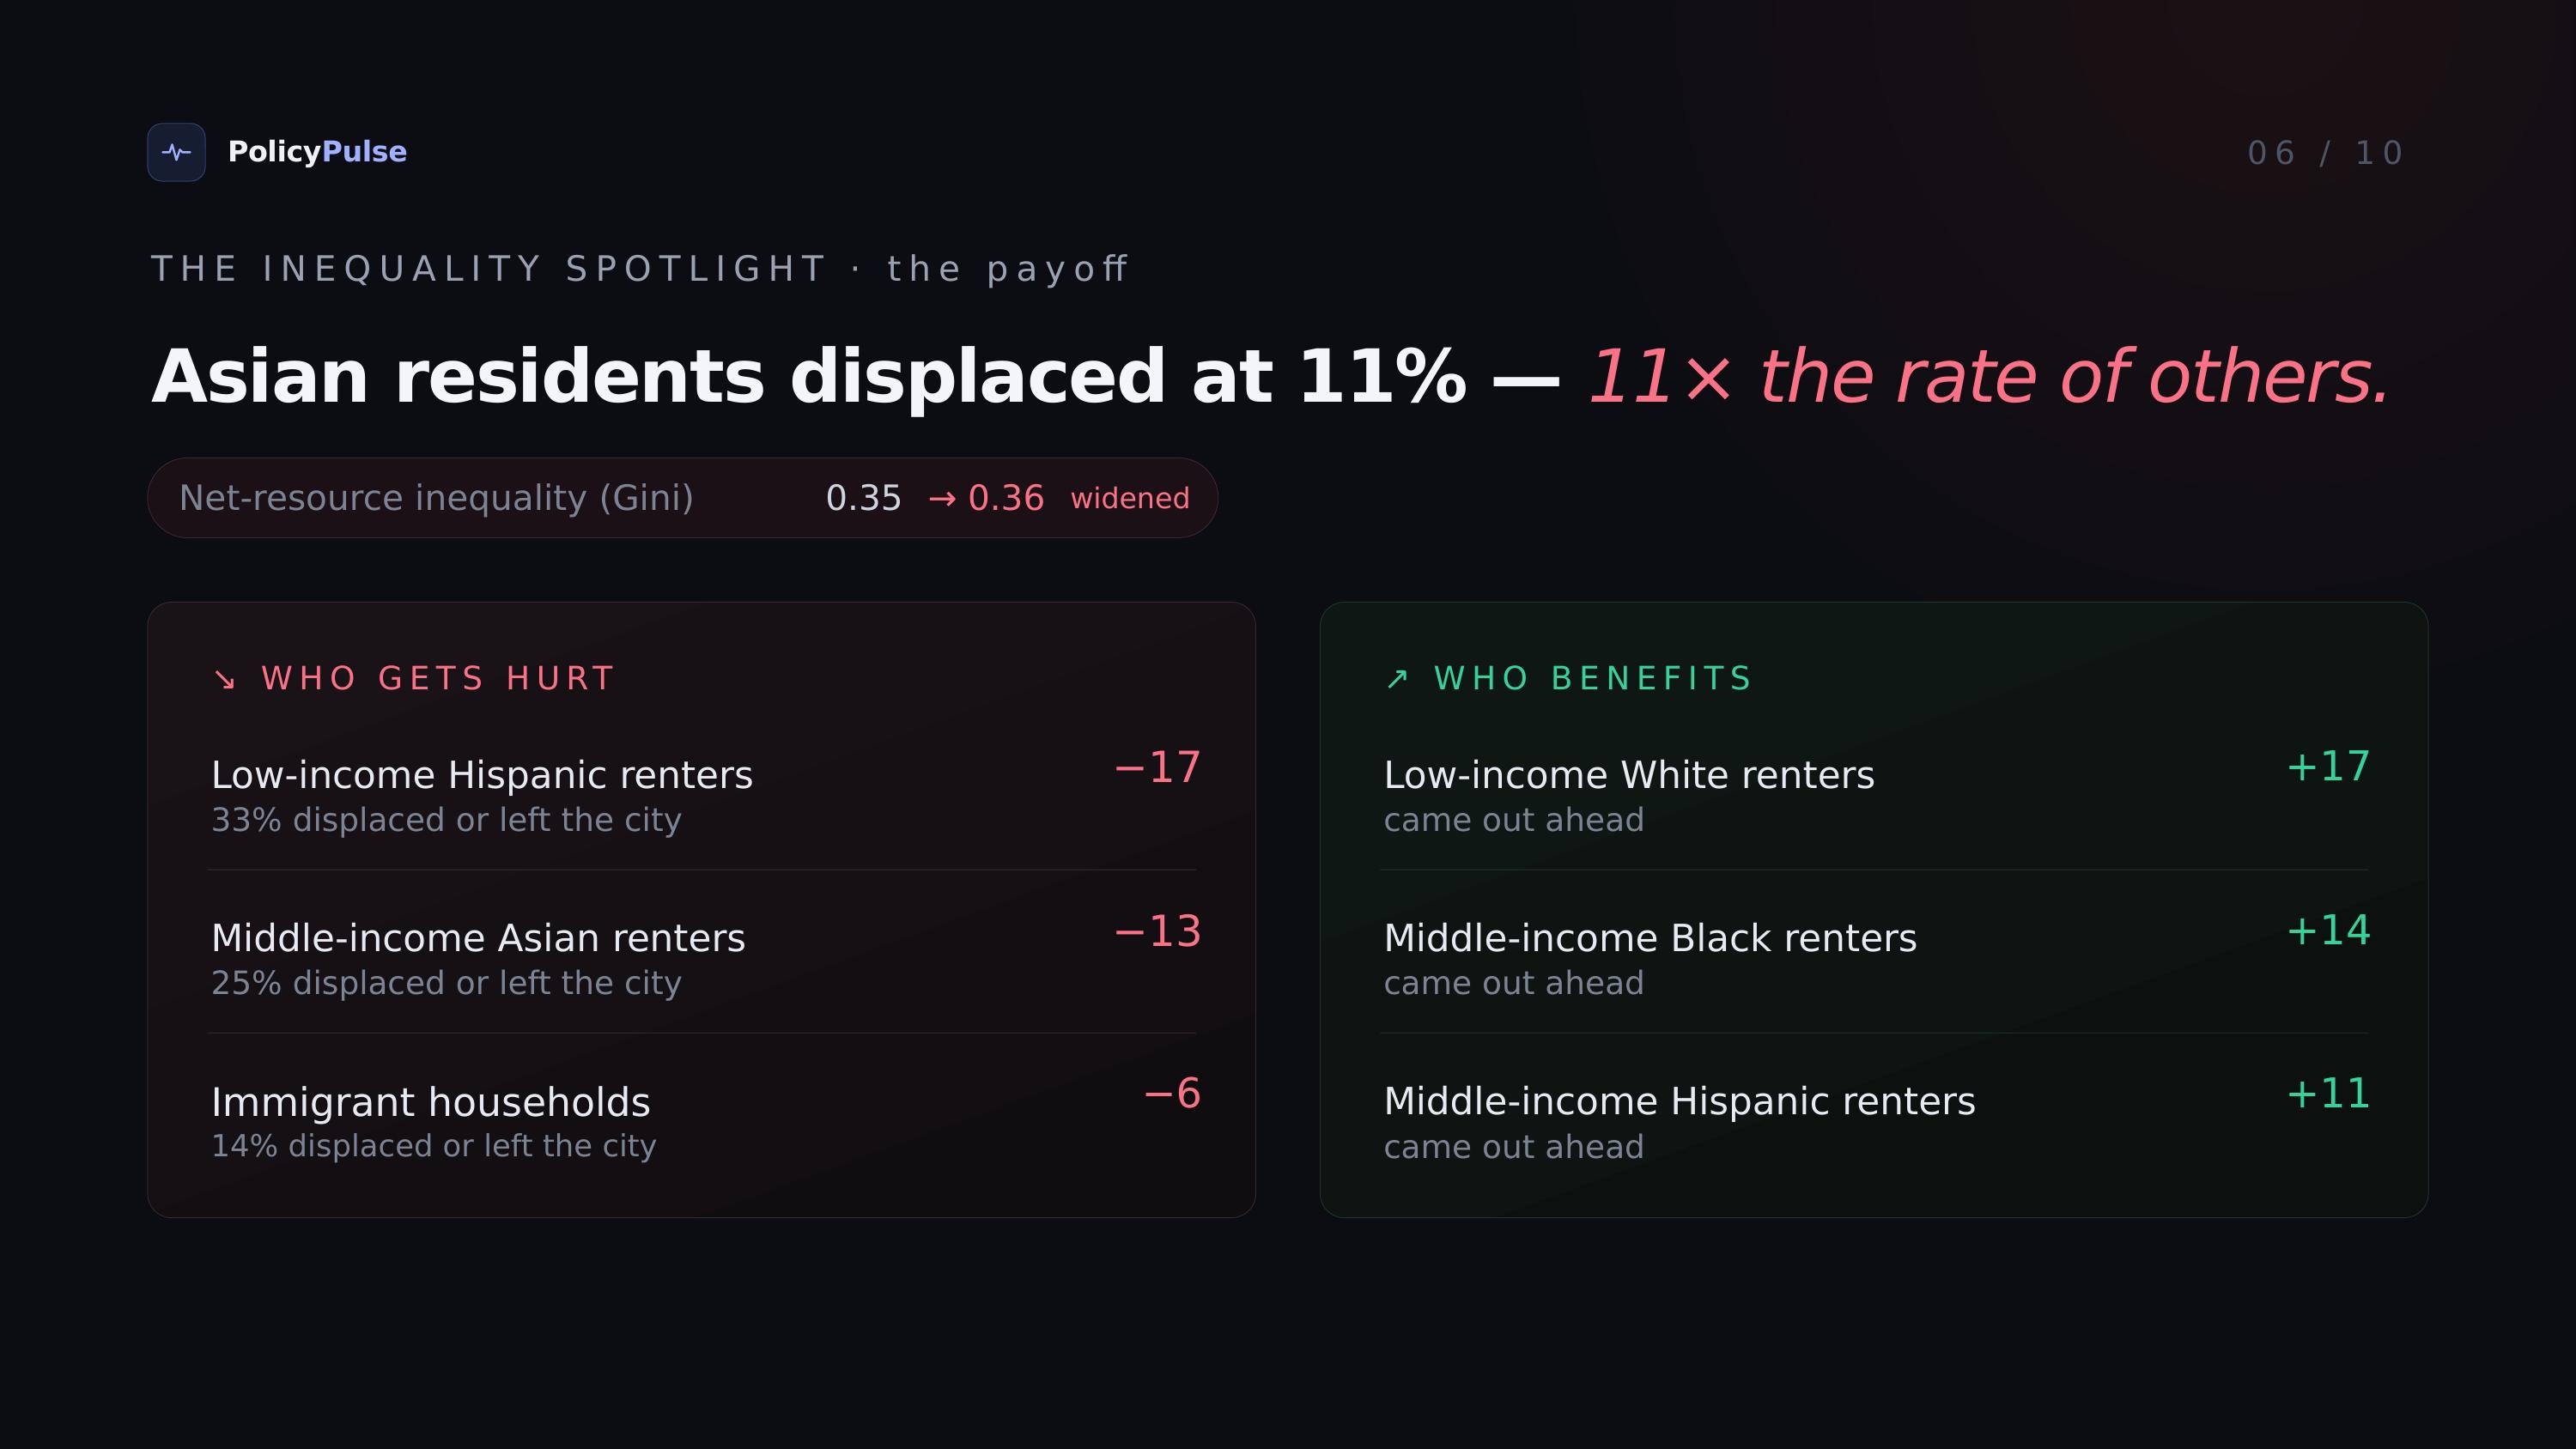
The Simulator lets you click any bill (or paste your own) and watch it play out across a statistically representative population of synthetic residents built from live U.S. Census (ACS) data for that state — real population, income, rent, racial composition, and housing tenure. The residents live through three years. Second-order effects cascade: a landlord facing rent control sells the building, so tenants get displaced; a wage floor rises, so a small business cuts hours. An inequality spotlight then reveals exactly who gets hurt and who benefits — broken down by race, income, and housing status — with the Gini coefficient before and after.
Then we close the civic loop three ways. First, hear the people: click any resident to read — and now hear — their AI-generated, first-person story, voiced aloud with a voice matched to that resident. Second, find your fit: a personalized mode simulates whether a specific location is a good fit for you in particular, based on your own situation, rather than the community in aggregate. Third, act on it: "Email your representative" looks up your real federal and state legislators, then drafts a respectful constituent email citing the exact bill and the simulation's findings about who it affects — opening a prefilled email for state legislators, or the official contact form with the draft copied for members of Congress.
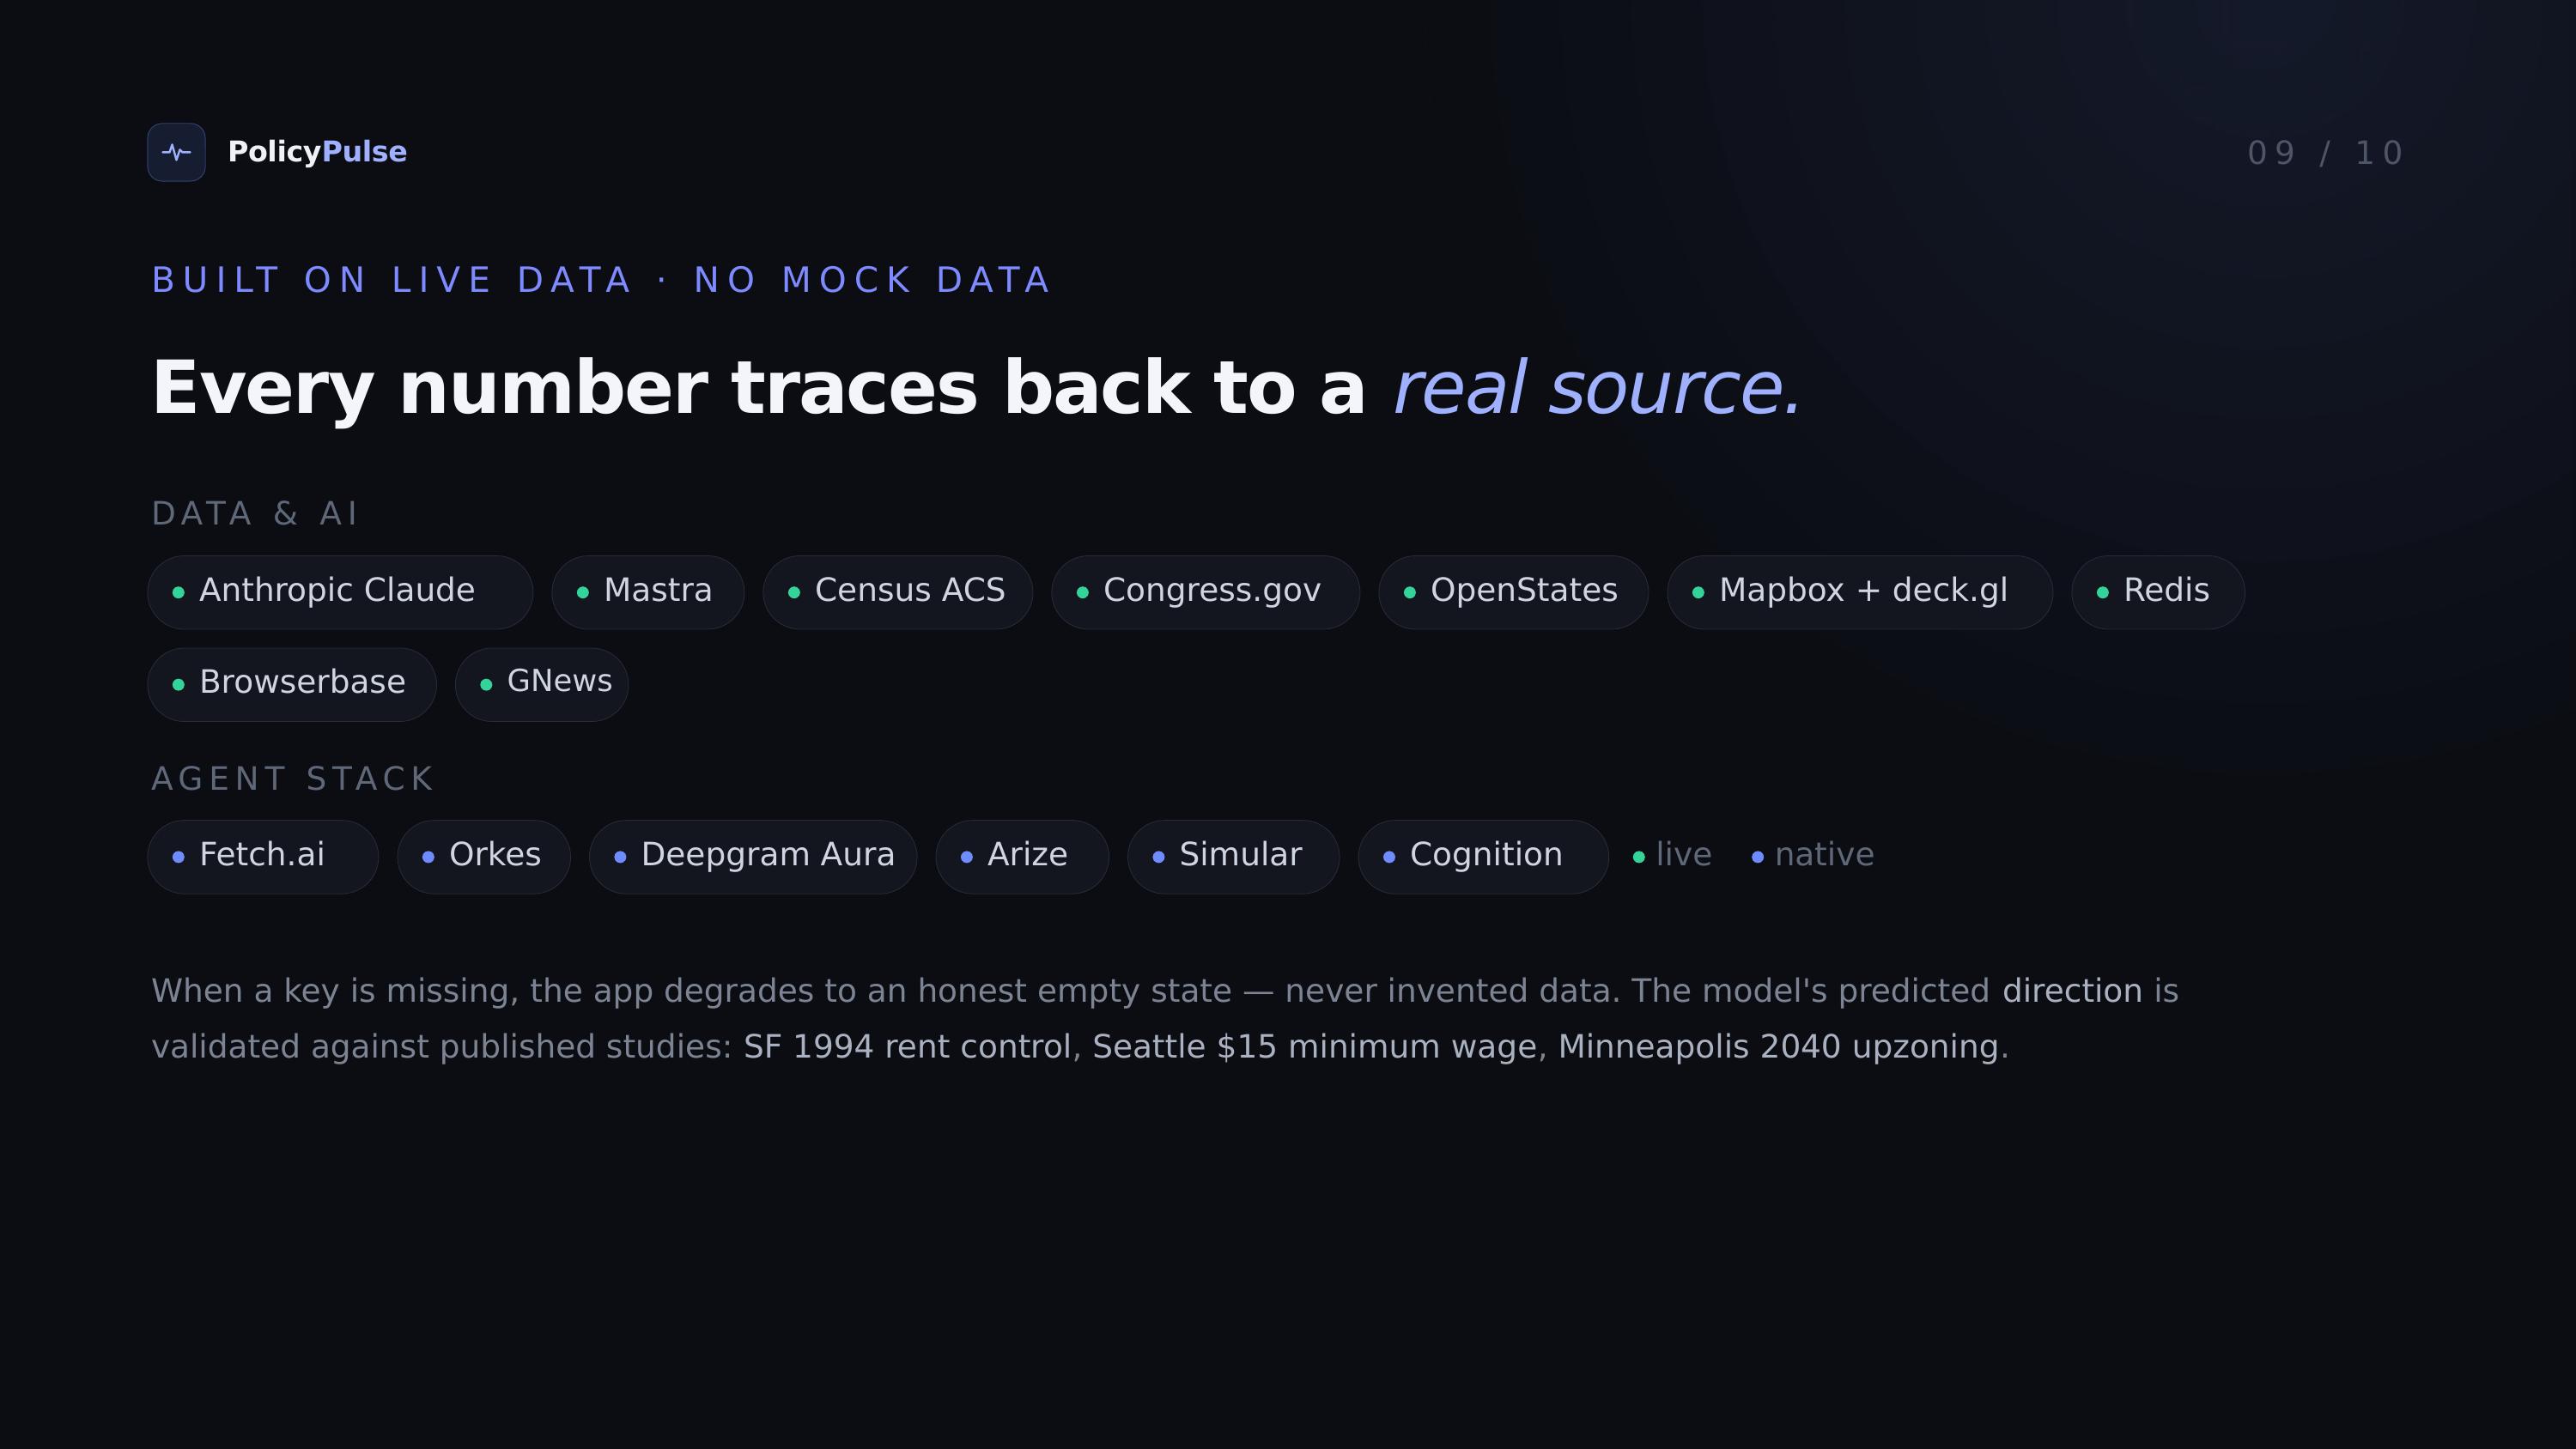
Two more surfaces back up the credibility. A /validate page runs real, studied policies (like San Francisco's 1994 rent-control expansion) through the same engine and checks the predicted direction of effects against published research. And a /lab runs Monte Carlo uncertainty bands and sensitivity analysis, so you see the range of outcomes rather than a single cherry-picked run.
How we built it
Our stack is Next.js (App Router, React Server Components, server-sent-event streaming), React, TypeScript, and Tailwind on the front end. Agent orchestration runs on Mastra with multiple Anthropic Claude agents. Deepgram Aura powers the resident voices. Mapbox GL + deck.gl render the 3D map and geocoding. Live civic data comes from U.S. Census ACS, Congress.gov, OpenStates, and GNews, with optional Redis mirroring every run.
The engine is the technical core. We ground a population in live Census ACS data, then spawn individual residents whose joint distribution of race × income × housing tenure × neighborhood matches the real community — so a low-income renter of a given background appears at the real-world rate, not by independent chance, and spatial segregation emerges naturally. A Claude PolicyAnalyst agent parses a free-text bill into a structured impact model: mechanism, intensity, who benefits, who pays, and likely unintended consequences. The simulation then runs in two passes per round. In the first pass, actor agents — small landlords and business owners — make probabilistic decisions that generate shocks. In the second, those shocks ripple out to every other resident across Month 1 → Month 6 → Year 1 → Year 3, tracking rent burden, displacement, wellbeing, and whether each person had to leave.
The entire run streams to the dashboard in real time over SSE, backed by a durable event log so a shared link can replay the whole run from scratch.
Graceful degradation is built in: with zero API keys the app still runs end to end on heuristic parsing, template stories, and clearly-labeled fallback datasets. Every live surface degrades to an honest empty state rather than ever inventing data.
Challenges we ran into
The first challenge was making synthetic residents representative, not just random. Matching each demographic on its own is easy; matching the joint distribution — so income–tenure correlation and segregation emerge naturally — is what makes the inequality analysis meaningful rather than decorative. That took real care in the spawning logic.
The second was a subtle, invisible metric bug. Per-group impact was being read before each run finalized, so the headline "net impact by demographic" panel silently showed zero for every group, on every policy. We caught it by testing deterministically across policy types, confirmed the real differentiated numbers existed, and fixed where they were surfaced rather than touching the numbers themselves.
The third was keeping the model honest. It would have been easy to make every bill "show displacement" for drama. We made the engine principled instead: displacement only appears where a real housing mechanism exists, so a privacy law correctly shows ~0% while rent control and upzoning move the needle.
The fourth was voice without overreach. We match Deepgram voices to resident gender (inferred from our name pools) and a slight age lean — deliberately not race, to avoid stereotyping — and keep it deterministic so a resident always sounds the same.
Accomplishments that we're proud of
We built a simulation grounded in real U.S. Census data that produces genuinely differentiated, defensible distributional outcomes rather than random noise dressed up as analysis. We wired seven real external data and AI integrations — Census, Congress.gov, OpenStates, GNews, Mapbox, Anthropic, and Deepgram — into one coherent product, each with an honest fallback. We landed an emotional payload that actually works: hearing a displaced resident tell their own story in a human voice turns an abstract statistic into something you feel. We treated intellectual honesty as a design principle, with directional validation against published studies, visible uncertainty bands, and honest empty states instead of fabricated data. And we closed the loop from awareness to action: you don't just learn who a bill hurts, you can email the person who votes on it in two clicks.
What we learned
The hard part of "AI for policy" isn't the AI — it's earning trust. Real Census grounding, directional validation, transparent assumptions, and honest empty states matter more than any single model output. PolicyPulse is a tool for building intuition about who's affected, not a forecast, and stating that clearly makes it more credible, not less. We also learned how much rigor it takes to make a simulation defensible: the difference between "the numbers look plausible" and "we can show you why each number is what it is" is most of the work.
What's next for PolicyPulse
We want deeper validation against more published studies, additional policy mechanisms beyond housing and labor, and finer-grained Census grounding at the county and city level. We also want to grow the personalized "find your fit" mode into a full planner that answers a bigger question: where should I live, and how would these policies actually treat someone like me?
Built With
- anthropic
- census-api
- claude
- congress.gov-api
- deck.gl
- deepgram
- gnews-api
- mapbox
- mastra
- nextjs
- node.js
- openstates-api
- react
- server-sent-events
- tailwindcss
- typescript

Log in or sign up for Devpost to join the conversation.