-
-

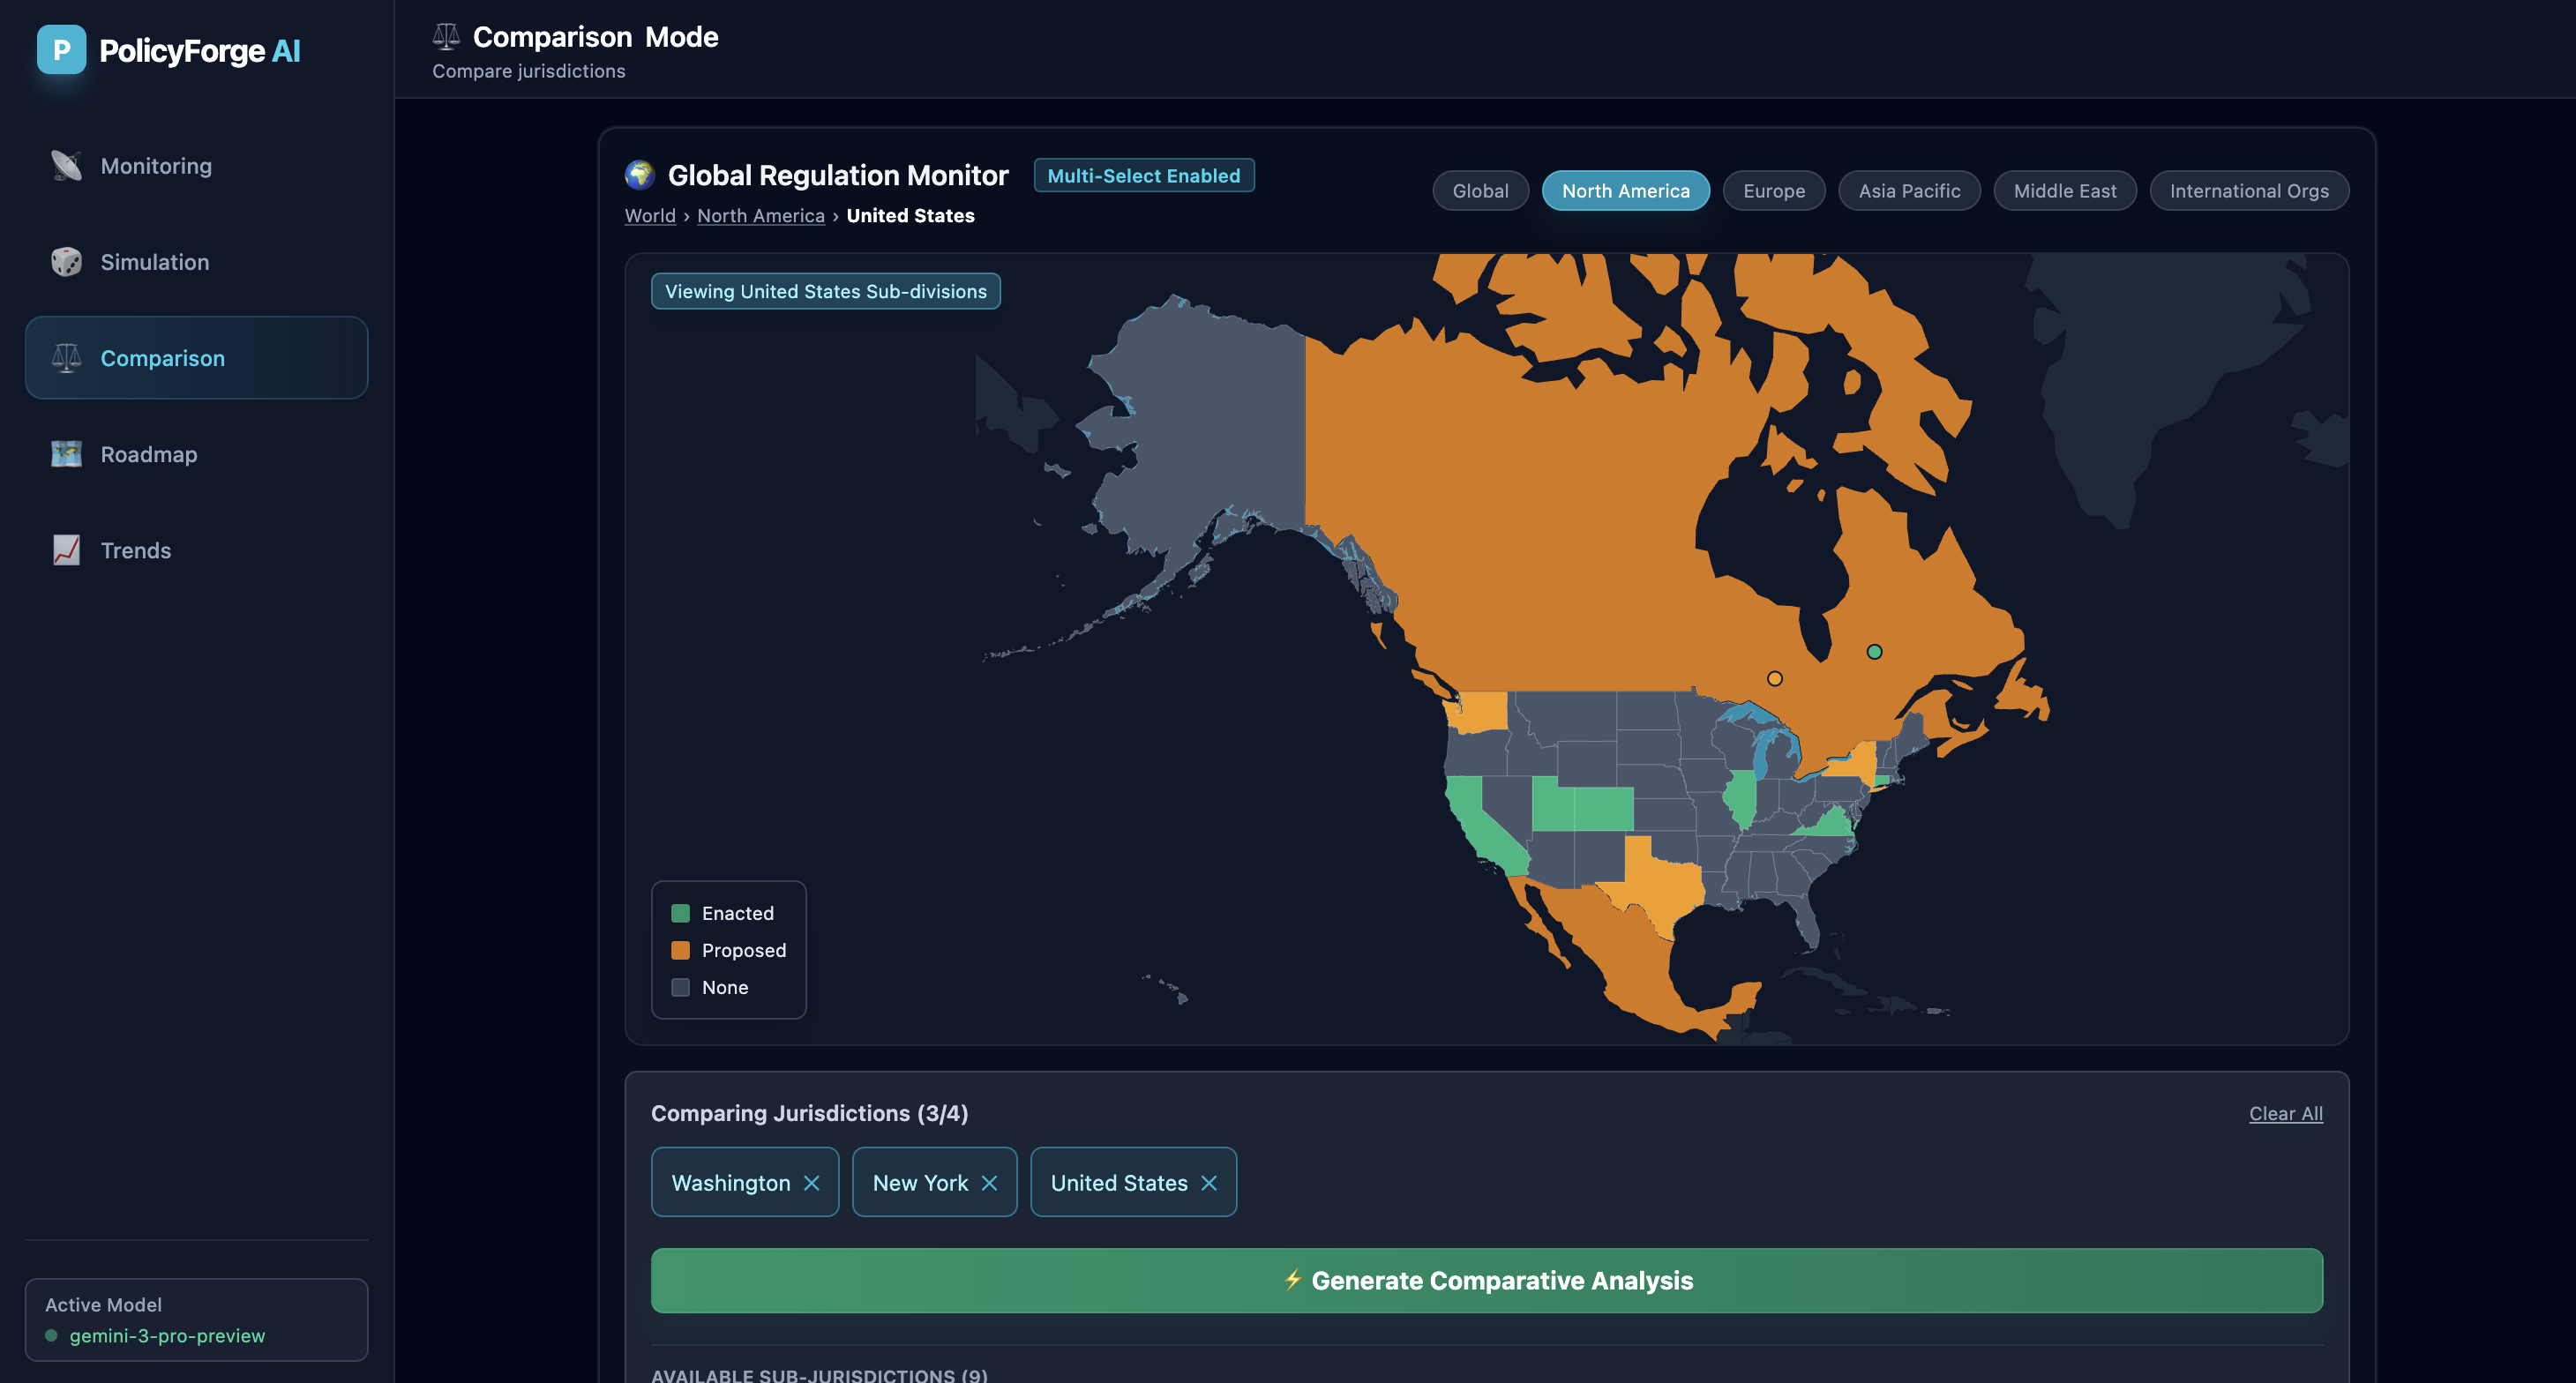
Compare AI regulation across US states - see how Washington, New York and federal rules stack up side by side.
-

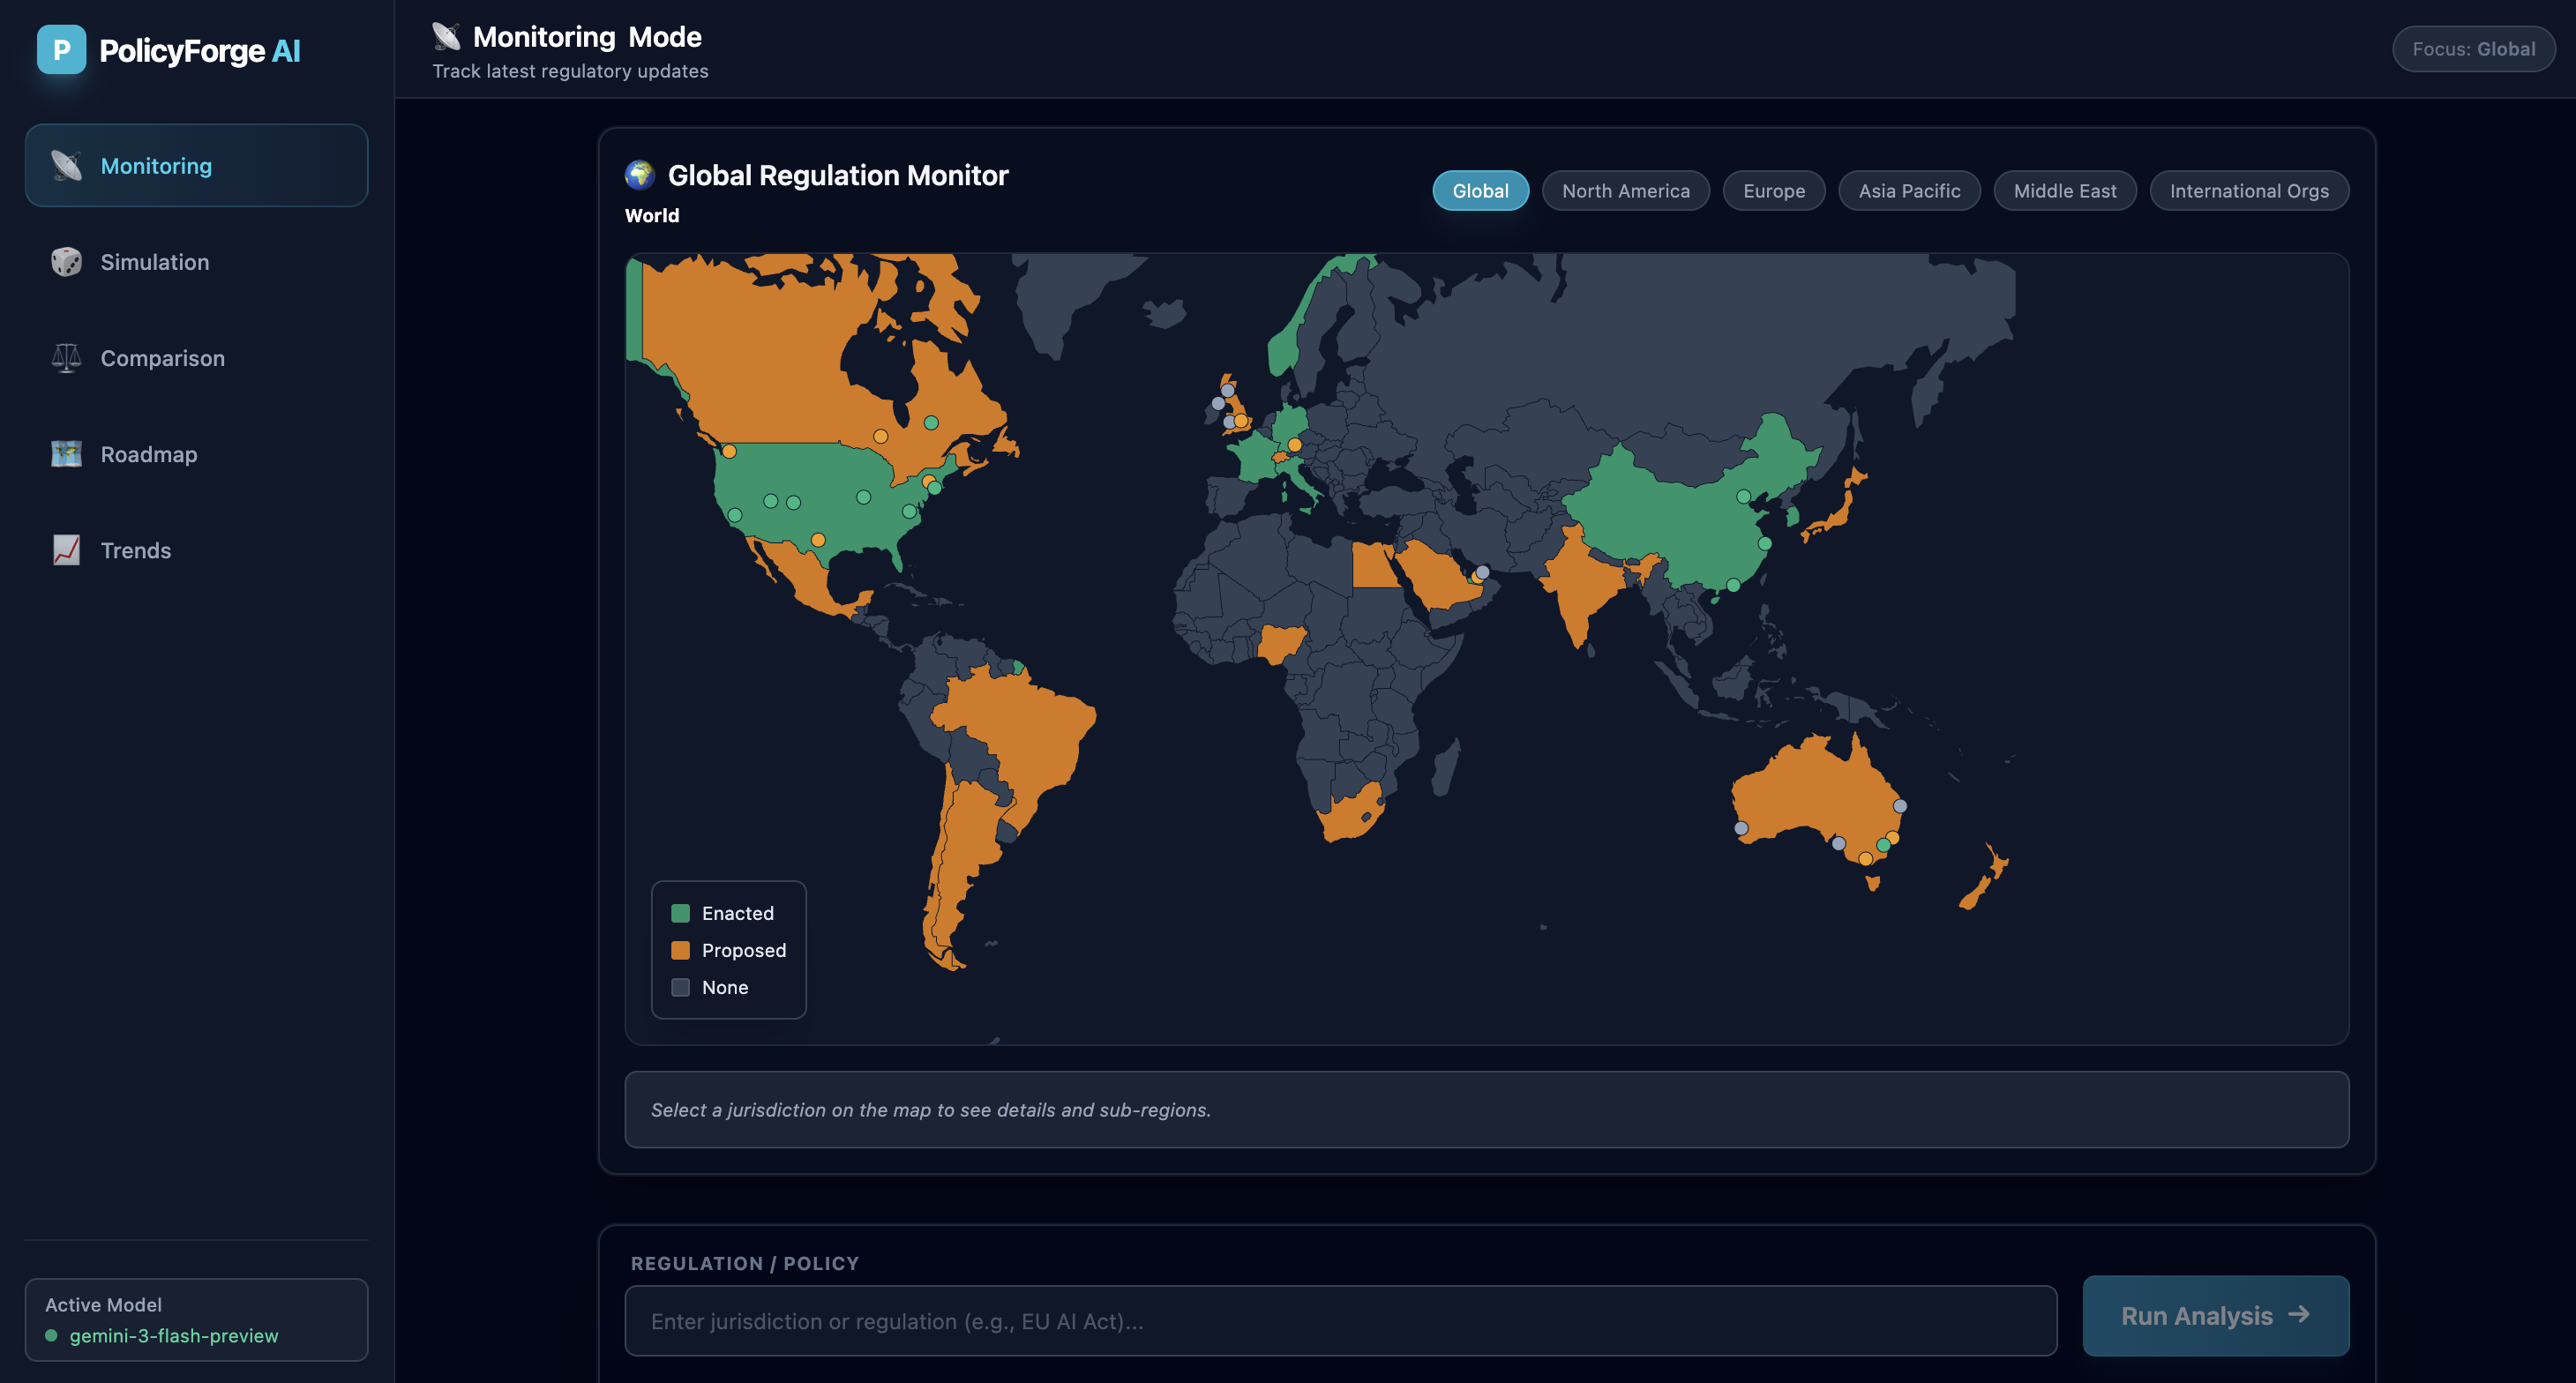
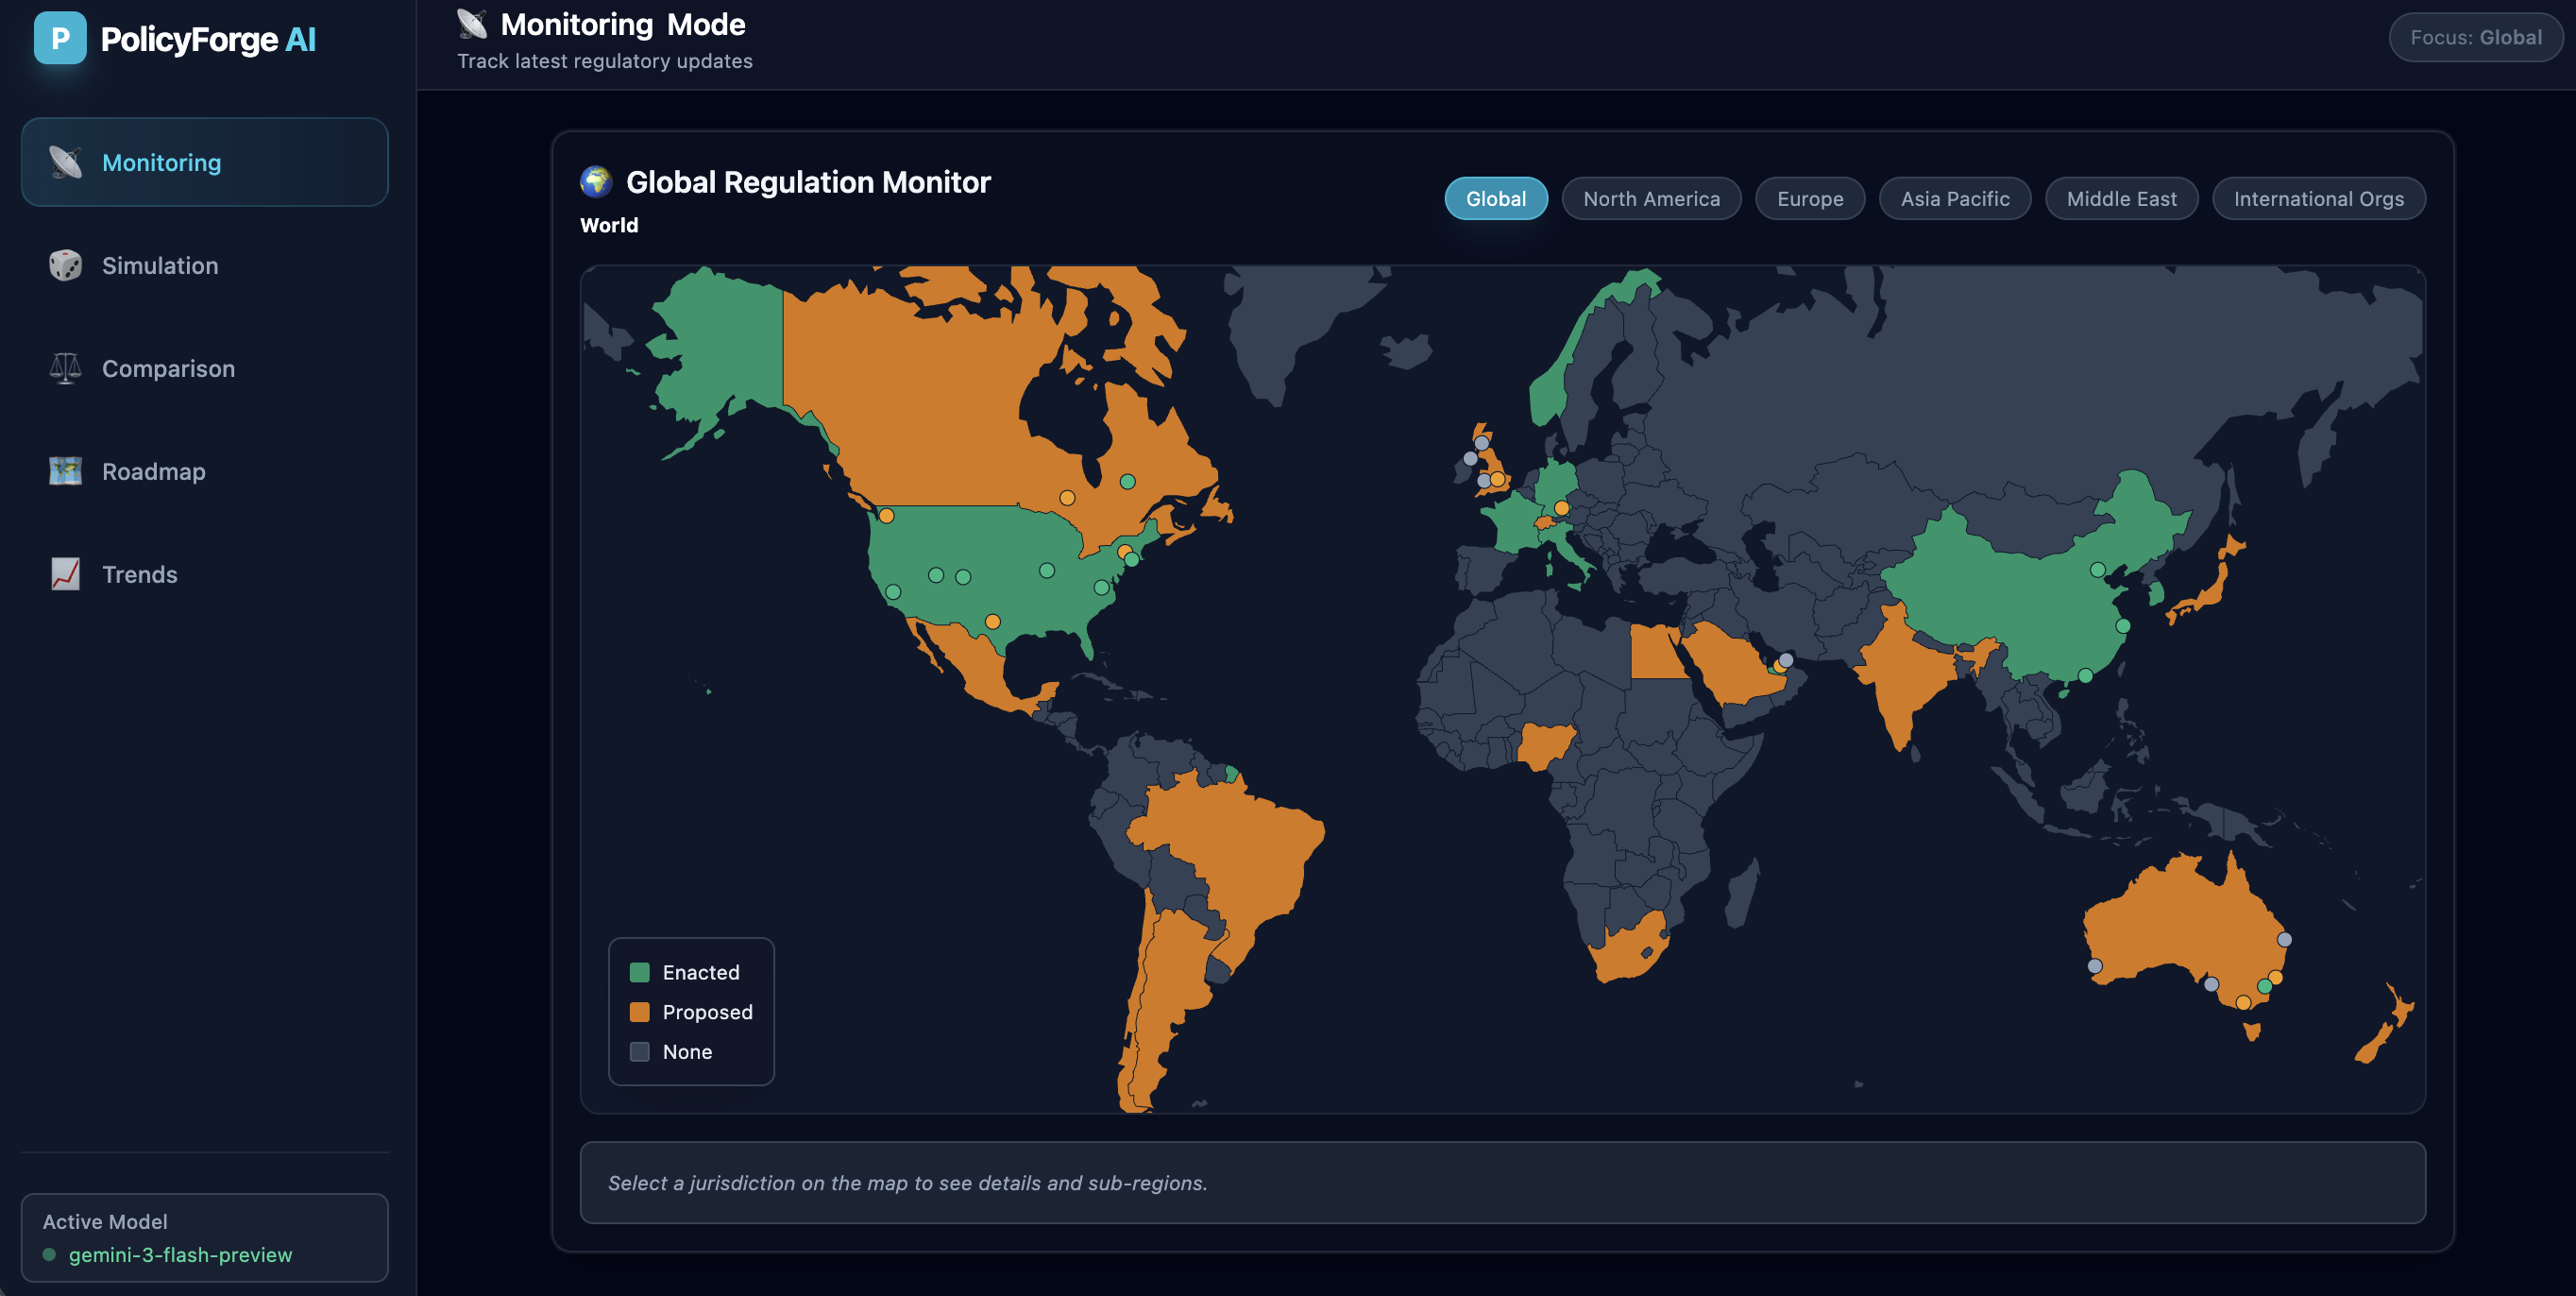
Global AI regulation at a glance - track enacted laws vs proposals across jurisdictions with PolicyForge AI's monitoring dashboard
-
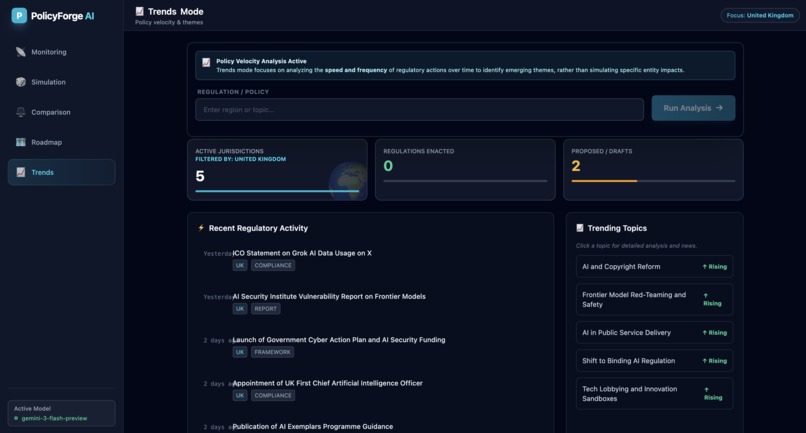
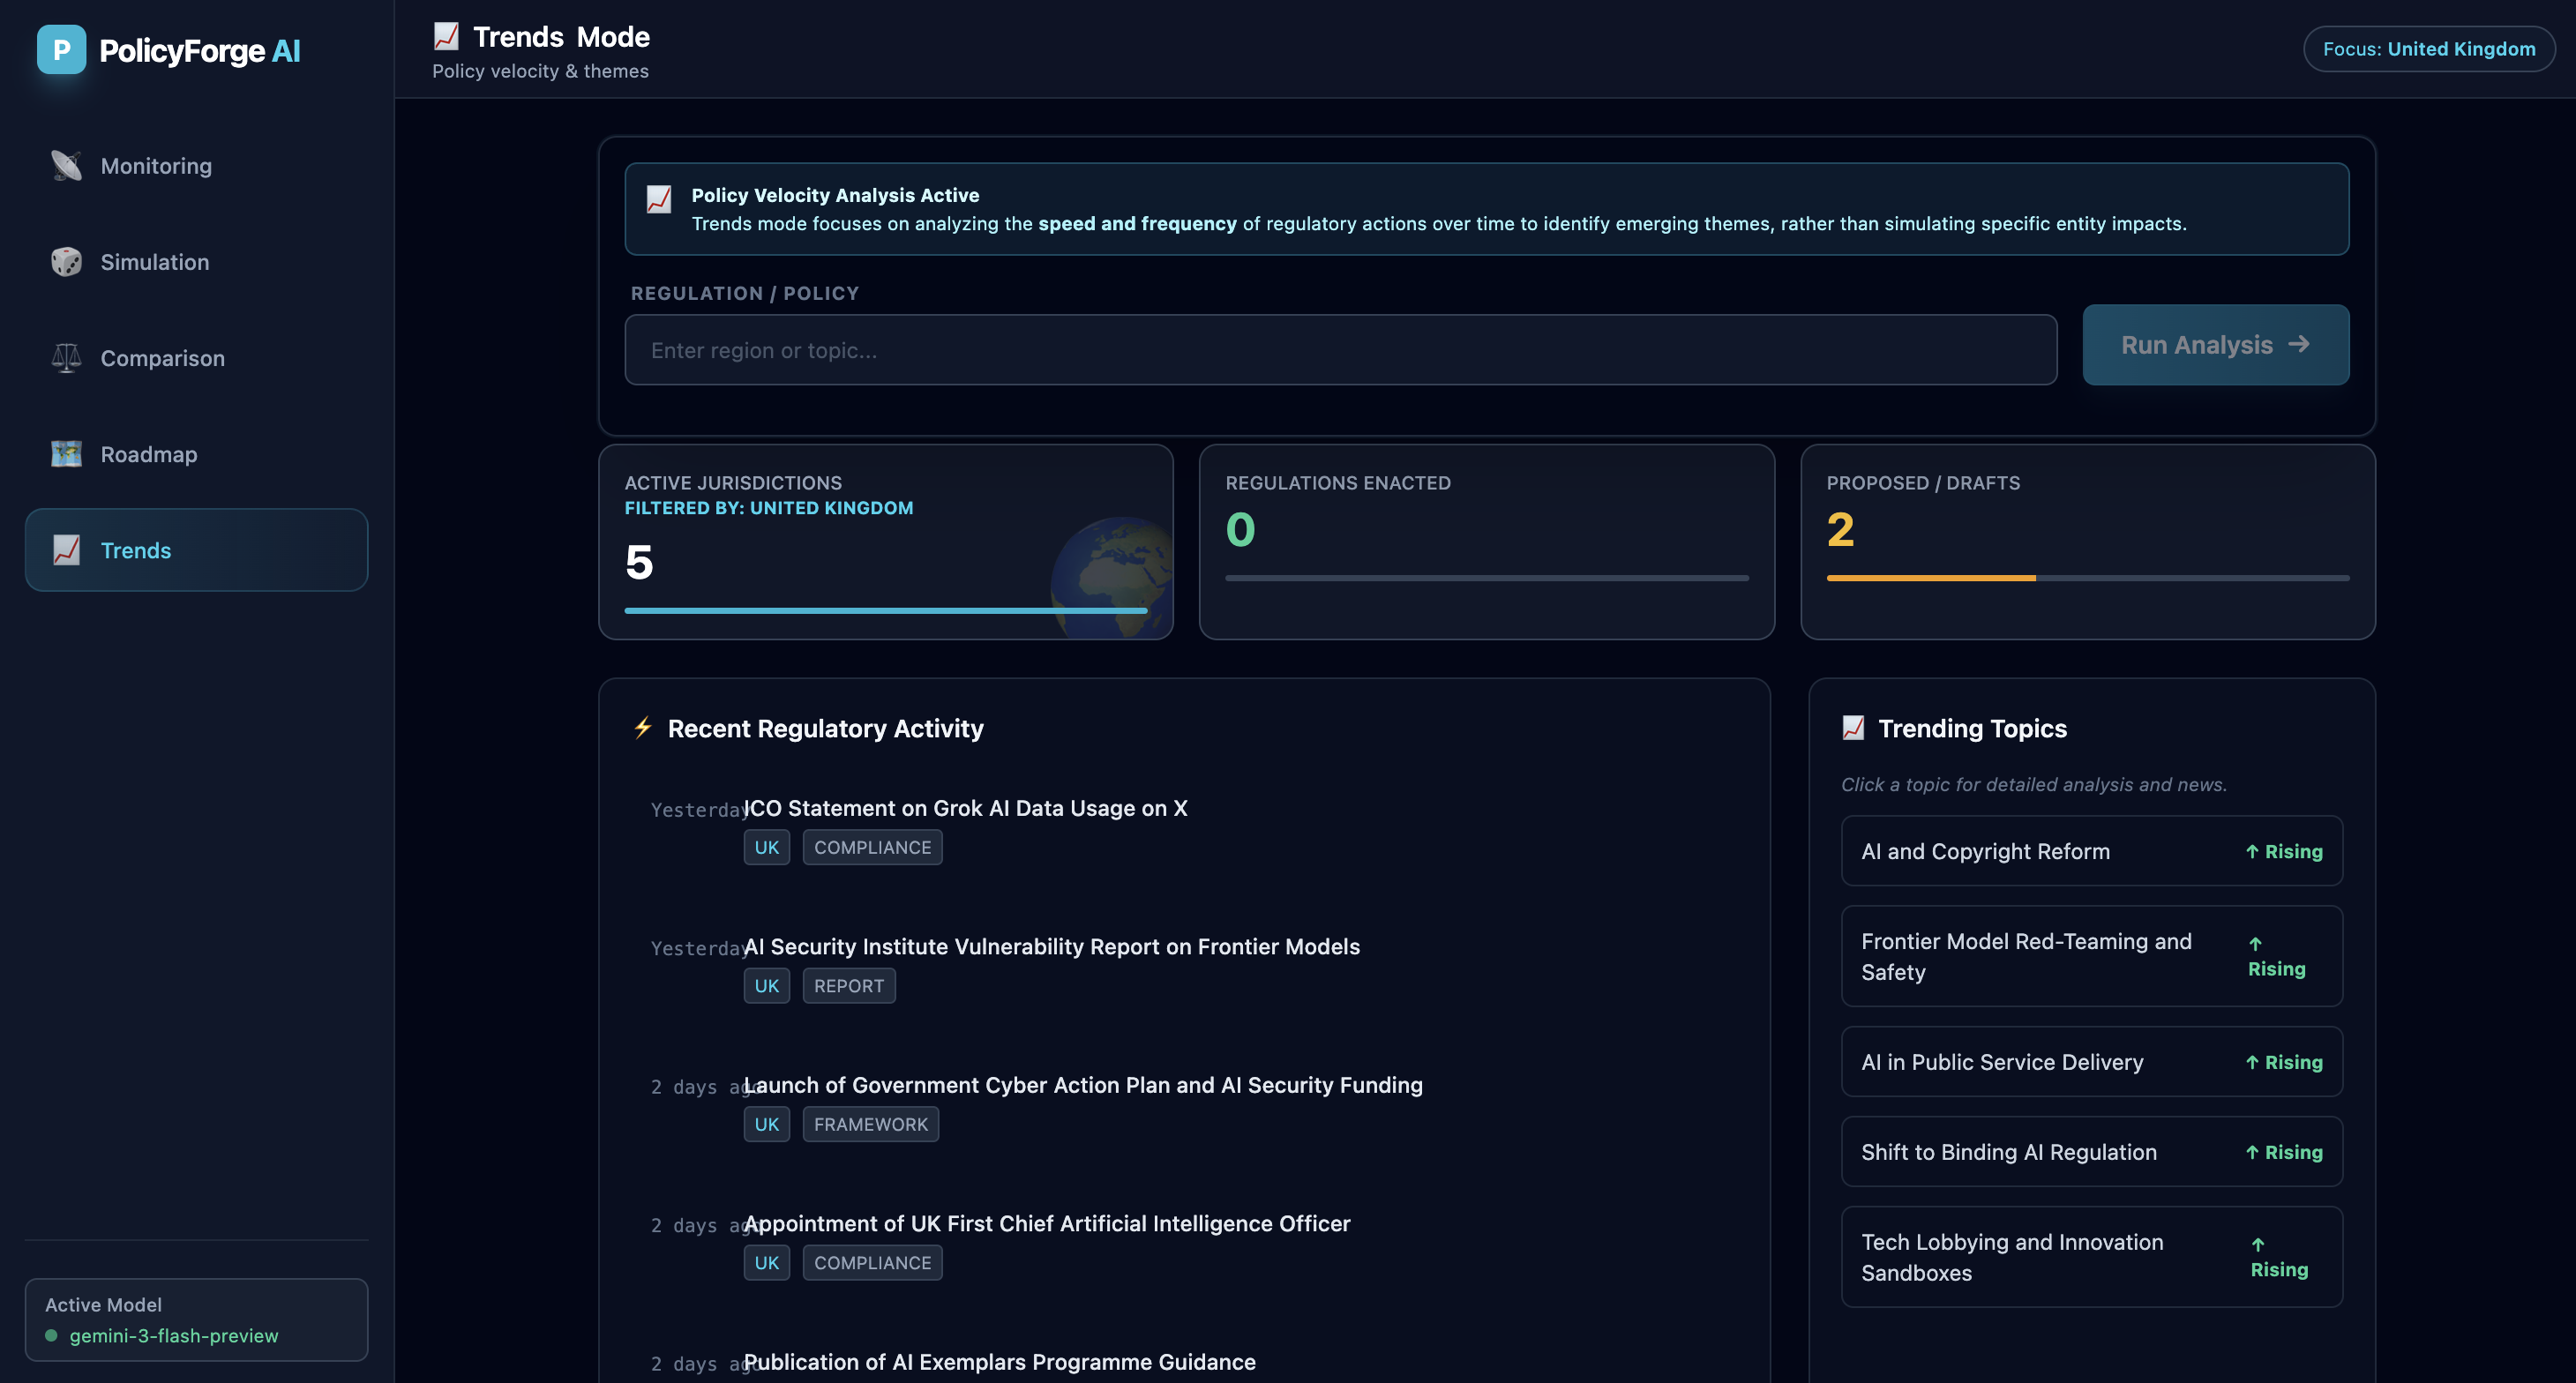
UK AI policy velocity: 5 active jurisdictions, 2 proposals in flight. Track trending topics from copyright reform to binding regulation.
-

One map. Every AI regulation. Green = enacted. Orange = proposed. Grey = opportunity.
PolicyForge AI
A visual regulatory intelligence platform that transforms how organisations navigate the global AI compliance landscape.
💡 Inspiration
Governments worldwide are racing to regulate AI, creating a fragmented patchwork of conflicting rules. The EU AI Act, US Executive Orders, and emerging policies across Asia all operate in silos - leaving organisations struggling to understand their compliance obligations.
I wanted to move beyond simple "chat with PDF" interfaces. PolicyForge was born from the idea that an AI analyst should be visual, structured, and context-aware. It leverages Gemini 3's "Thinking" capabilities to reason through regulatory complexity and presents results not as walls of text, but as interactive maps, Gantt charts, and comparative tables.
🎯 What It Does
PolicyForge is a comprehensive regulatory intelligence dashboard with five distinct analysis modes:
| Mode | Description |
|---|---|
| Monitoring | A live feed of regulatory changes, filtered by region, using Google Search grounding for up-to-the-minute accuracy |
| Simulation | Models specific regulation impacts on different entity types (e.g., "How does the EU AI Act affect a HealthTech startup?") with sector-specific risk assessments |
| Comparison | Generates side-by-side matrices of jurisdictions (e.g., US vs. EU), highlighting key divergences in liability and enforcement |
| Roadmap | Automatically generates implementation timelines with phases, resource requirements, and dependencies - visualised as interactive Gantt charts |
| Trends | Analyses policy velocity (speed of legislation) and identifies emerging themes with detailed explanations and news citations |
The app features an interactive global map allowing users to drill down from global views to specific states (like California or Bavaria) to set the context for the AI's analysis.
🛠️ How I Built It
PolicyForge is a React application powered entirely by the Google GenAI SDK.
Architecture & AI Strategy
Hybrid Model Approach
| Model | Use Case |
|---|---|
| Gemini 3 Pro Preview | Heavy-duty reasoning tasks (Simulation, Comparison) - utilises Thinking Config (Chain of Thought) to plan analysis steps before outputting JSON |
| Gemini 3 Flash Preview | Low-latency tasks - Dashboard updates, Trend analysis, and Autosuggest features |
Key Technical Decisions
- Strict Structured Output - The application relies on complex JSON Schemas. The AI returns strictly typed data structures for charts, timelines, and comparison tables, rendered using Recharts and custom components
- Real-Time Grounding - The
googleSearchtool is integrated into the analysis pipeline, forcing the model to cite real-world sources and URLs for every claim - Interactive Mapping - Built with D3.js and TopoJSON, handling dynamic zooming and state-level selection, feeding geographical context directly into system prompts
🧗 Challenges I Faced
Taming the JSON Schema
Getting an LLM to consistently output deeply nested JSON arrays - specifically for Comparative Analysis tables and Roadmap Gantt charts - was difficult. I had to refine schema definitions rigorously to ensure the UI never crashed due to malformed data.
Visualising "Thinking"
Gemini 3 Pro with a high thinking budget provides excellent results but takes time to process. To improve UX, I built a custom Thinking Indicator that simulates the agent's internal monologue (e.g., "Scanning legal frameworks...", "Calculating economic impact...") so users understand the agent is actively working, not just loading.
Map Data Granularity
Mapping global jurisdictions down to state/province level (like specific German states or UAE Emirates) required handling complex TopoJSON overlays and coordinate systems to ensure smooth zooming transitions.
📚 What I Learned
Chain of Thought is a UI feature - The "Thinking" process isn't just an internal backend mechanic. Exposing the Reasoning Trace to users builds trust. Users love seeing how the AI reached a conclusion.
Context is King - Passing specific map selections (e.g., "Selected: California") into the prompt dramatically improves output quality compared to generic queries.
Structured UI > Chat - For complex domains like law, a dashboard with charts and tables is infinitely more valuable than a linear chat interface.
🚀 What's Next for PolicyForge
| Feature | Description |
|---|---|
| Multi-Modal Inputs | Allow users to upload specific PDF drafts of bills to simulate impacts before they're even passed |
| Export Capabilities | Generate PDF reports of Roadmaps and Comparison tables for policymakers to download |
| User Personalisation | Save simulation profiles (e.g., "My SaaS Company") so the agent remembers user constraints across sessions |
🔧 Built With
- React
- Google GenAI SDK
- Gemini 3 Pro Preview
- Gemini 3 Flash Preview
- D3.js
- TopoJSON
- Recharts
Built With
- bun
- gemini3
- gemini3-pro
- google-ai-studio
- typescript


Log in or sign up for Devpost to join the conversation.