-
-
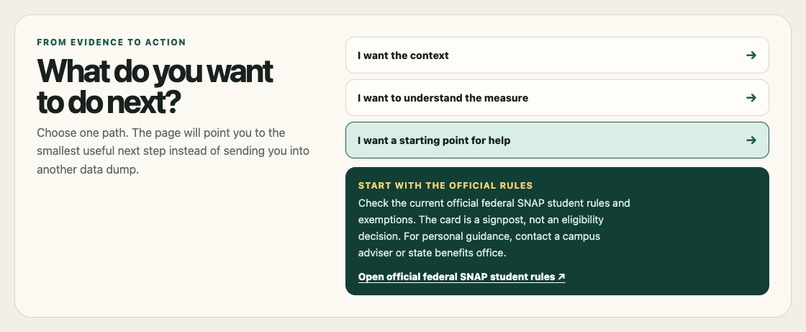
Source-to-action path: readers choose context, definitions, or official SNAP rules.
-

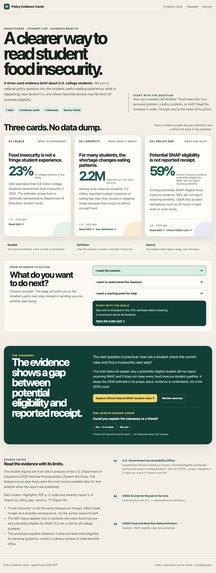
Mobile layout showing scale, severity, policy gap, and source-linked next steps.
-
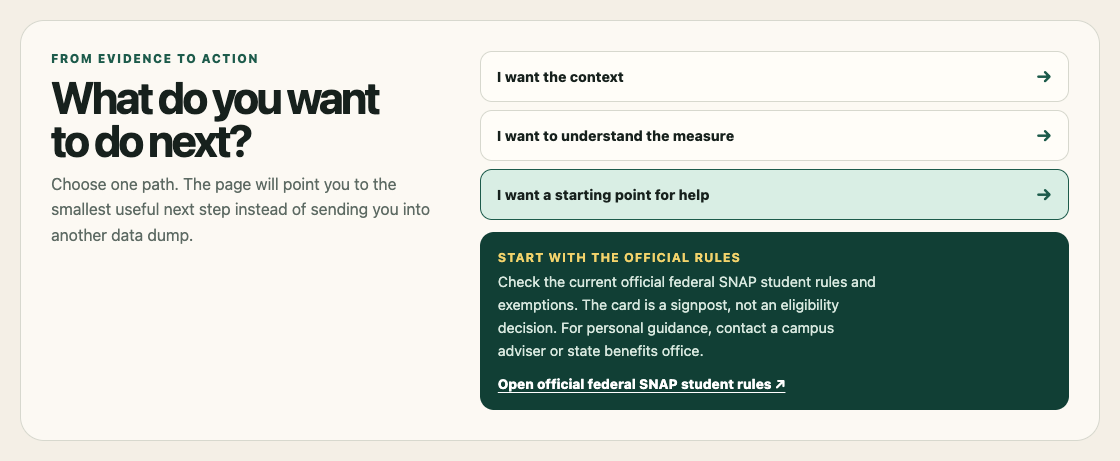
Responsive desktop MVP: three source-linked evidence cards on student food insecurity.

Inspiration
Public policy data is often technically public but practically difficult to read. A student may encounter a statistic about food insecurity and still not know what it measures, how severe the situation is, or how a policy program relates to it. I built Policy Evidence Cards as a small, source-linked reading layer for that moment. The first brief focuses on food insecurity among U.S. college students and turns one complex topic into a readable sequence.
What it does
Policy Evidence Cards organizes the topic into three evidence cards:
- Scale: GAO estimated that 23% of college students, or approximately 3.8 million students, experienced food insecurity in 2020.
- Severity: 2.2 million food-insecure students reported very low food security, including repeated reductions in food intake or skipped meals.
- Policy gap: Among food-insecure students who were potentially eligible for SNAP, 59% did not report receiving benefits. Every card shows its data year, plain-language explanation, limitation, and source link. The final section points readers to the official USDA student SNAP rules without pretending to determine anyone’s eligibility.
How I built it
I built the MVP with semantic HTML, CSS, and vanilla JavaScript. The evidence is stored in a small JSON manifest so that the displayed claims, definitions, and source locations can be checked separately from the interface. The project has no account, backend, build step, or live API dependency. It is a responsive static site that works on desktop and mobile. A source-to-action interaction lets readers choose whether to review context, understand the definition, or check the official policy rules. A private in-browser reader check provides a lightweight clarity prompt without collecting personal data.
Challenges I ran into
The main challenge was simplifying the evidence without overstating it. The figures come from GAO’s analysis of 2020 National Postsecondary Student Aid Study data; they are not a live 2026 count. I also had to keep several concepts separate: food insecurity is not identical to hunger, potential SNAP eligibility is not the same as reported receipt, and a national estimate cannot determine an individual student’s situation. For that reason, I chose not to build an eligibility calculator. The prototype points readers to the official rules and leaves personal guidance to campus advisers and state benefits offices.
Accomplishments I’m proud of
I created a complete, dependency-free MVP with a clear scale-to-severity-to-policy progression. Each major statistic is linked to a public government source, with the relevant report page and figure identified. I am also proud that the same experience works across desktop and mobile, includes visible keyboard focus states, and uses a source-to-action path rather than ending with a data dump. The project is publicly deployed and includes automated acceptance checks and Chromium proof-of-work screenshots.
What I learned
A source link by itself is not enough. A useful evidence interface must preserve the denominator, year, definition, and limits next to the headline number. I also learned that a small, ordered sequence can be more useful than presenting a long report or large data table all at once. Good public-interest UX is often about making the next question easier to ask.
What’s next for Policy Evidence Cards
The format can be reused for housing, mental health, financial aid, and other public issues where people need context before taking action. The next step is to test comprehension with real students and improve the cards based on what they misunderstand. Future versions could also add more topics while keeping the same source-linked, limitation-aware structure.
Sources
Built With
- accessibility
- css3
- github
- html5
- javascript
- pages
- python

Log in or sign up for Devpost to join the conversation.