-

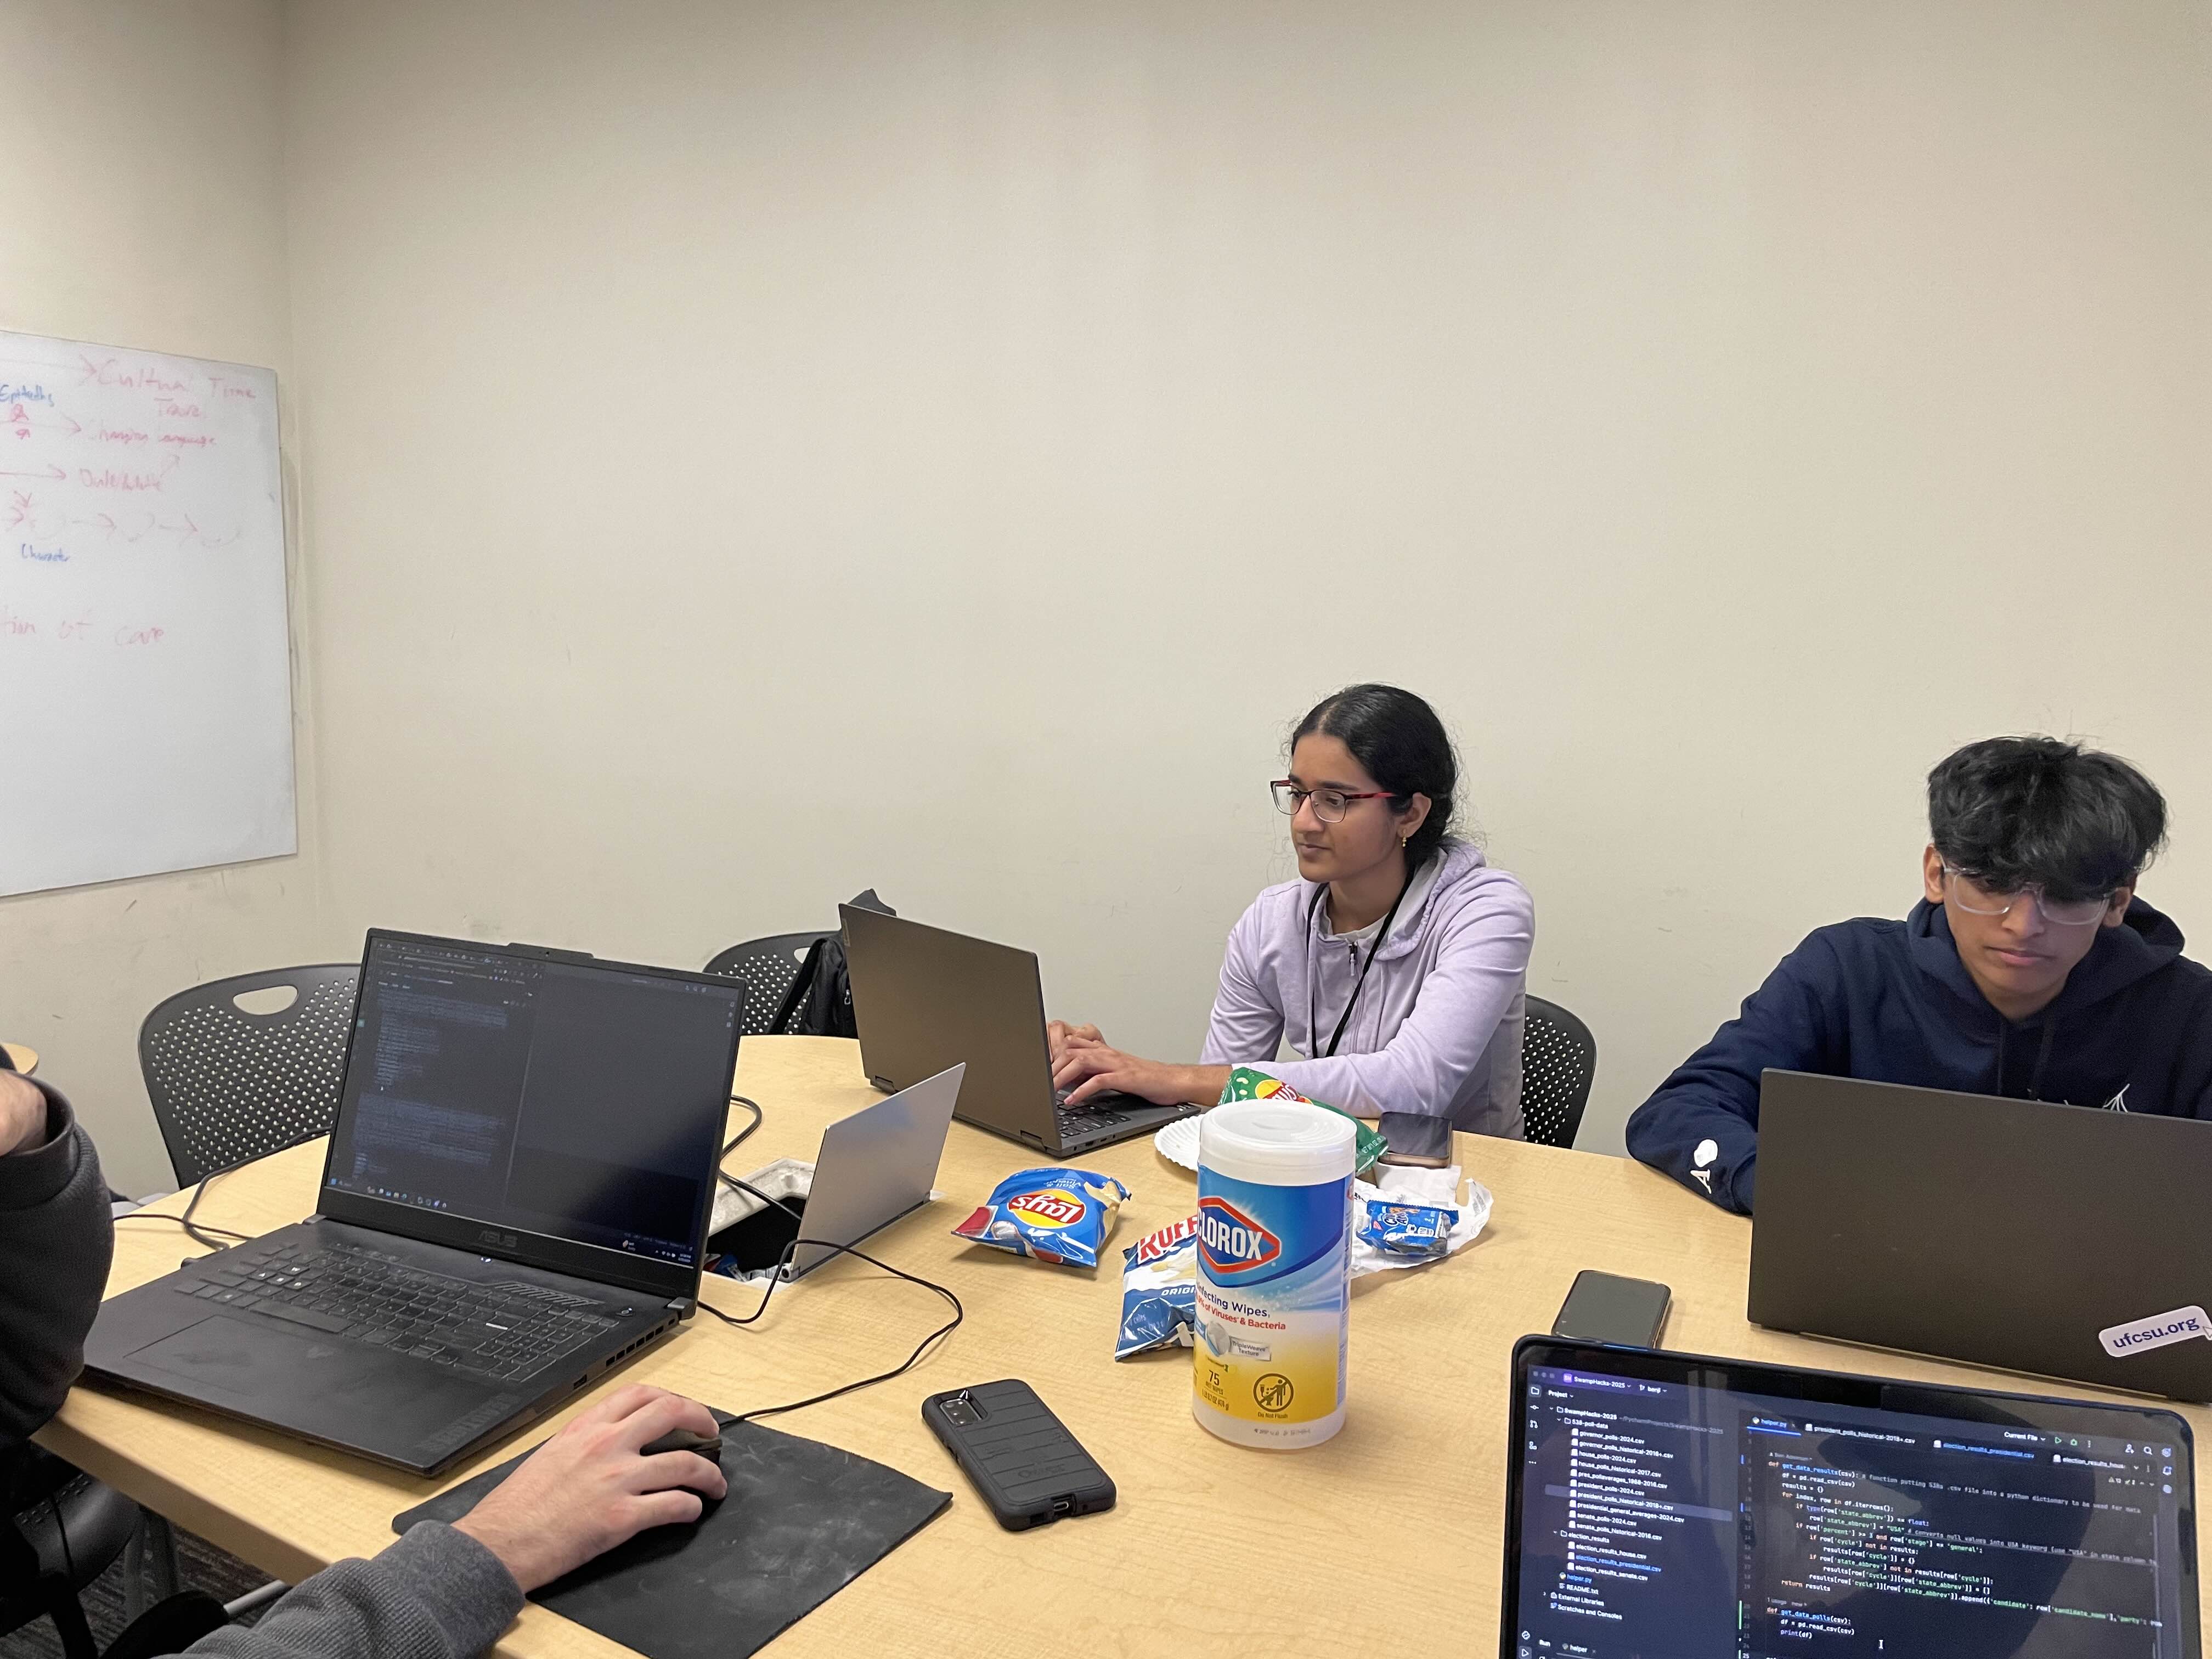
Neha (right) and Kushagra (left) working on Figma for the app.
-
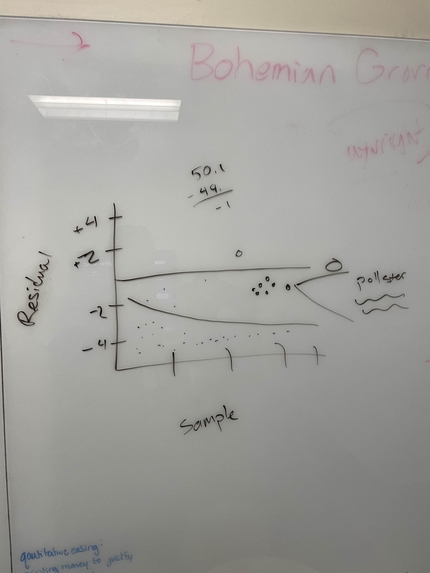
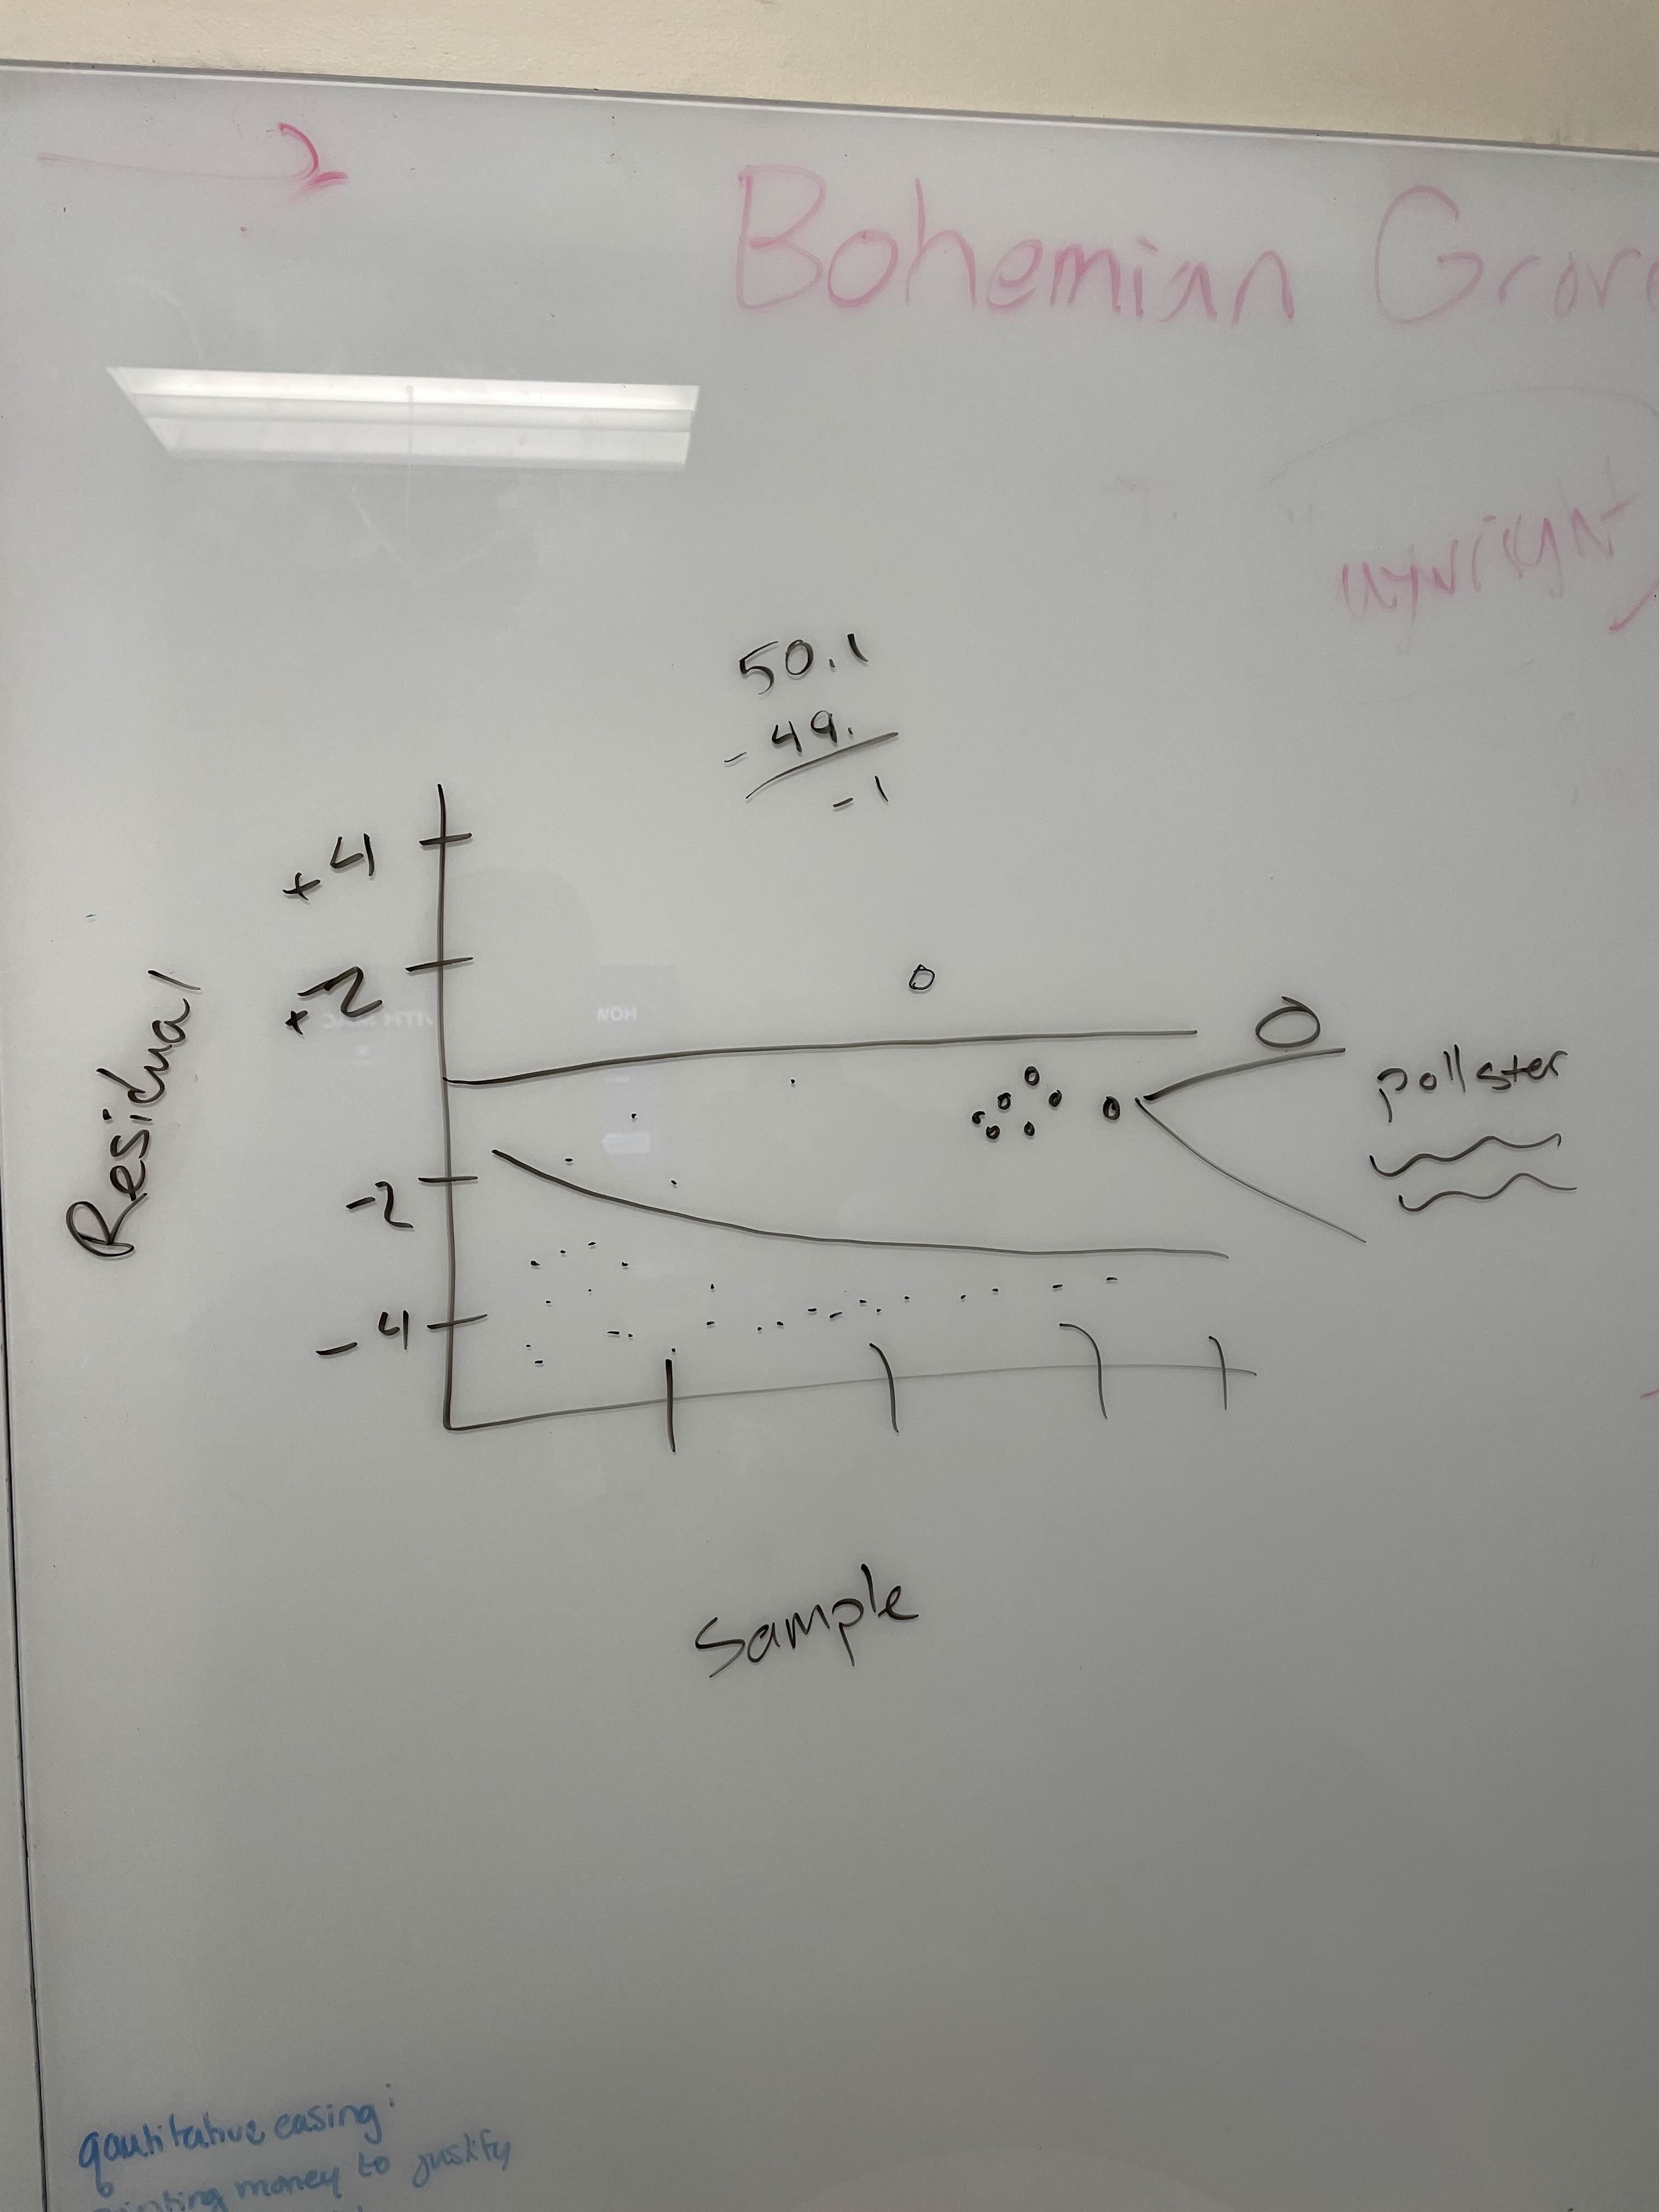
First sketch of our planned "Pollster Plot"
-
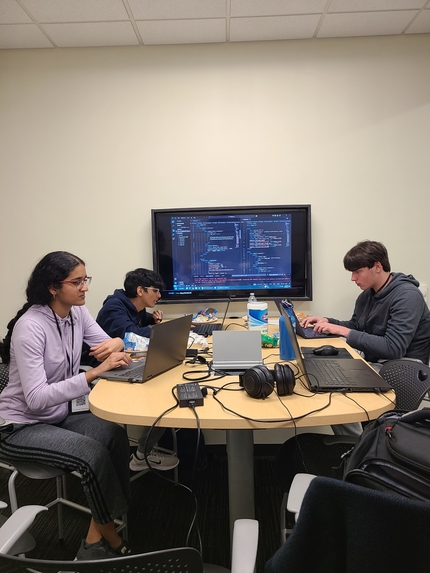
Hard at work creating the first draft of our webapp
-
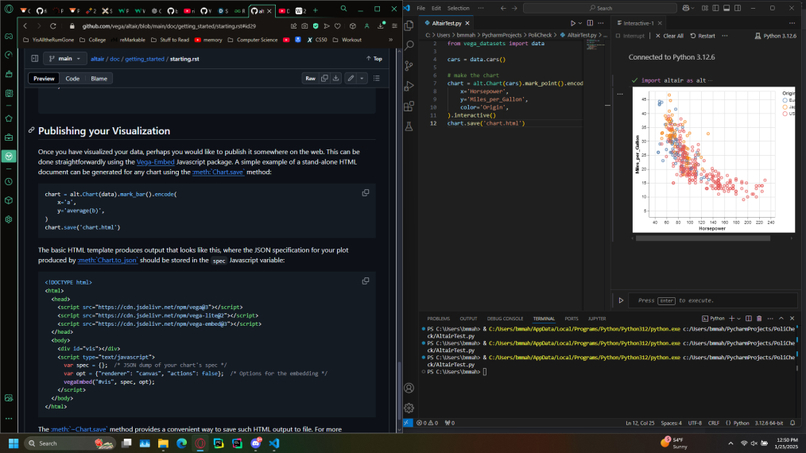
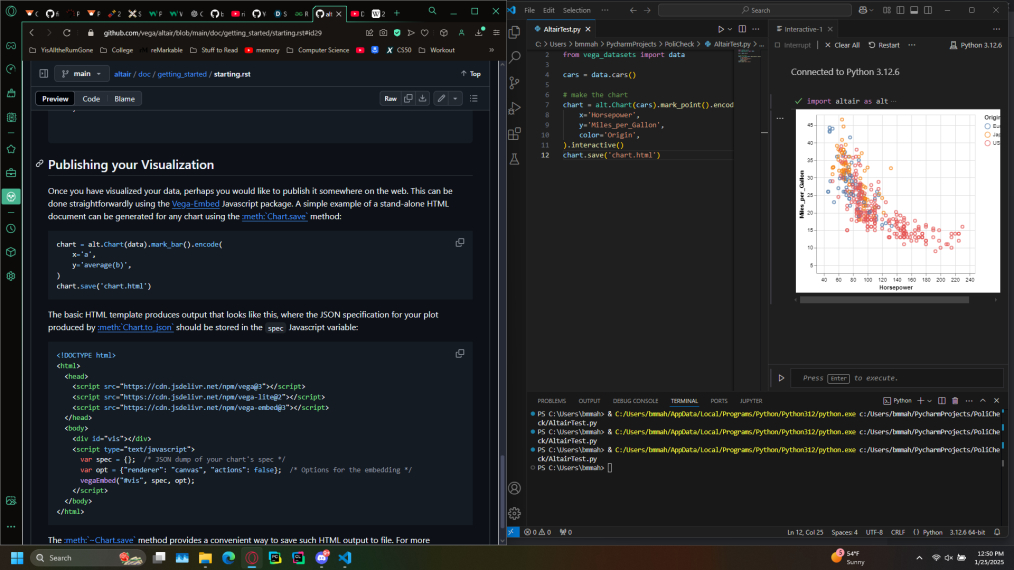
Experimenting with Altair, testing to see if it would serve our needs.
-
Migration to Dinner


Inspiration:
We wanted a digestible way to see the margin of error among pollsters. We value sources like 538 but have found them lacking in clear visualizations that show users just how inaccurate or accurate pollsters generally are. We understand from an intellectual point of view where this error exists but we wanted to create a clear resource so that this reality is more simply apparent. Given recent lapses in pollster accuracy we felt it was necessary for not just own our education but for the education of public for this residual error to be clear.
What it does
Our webapp powered by the 538 to Win API creates a visualization of pollster residual error across the 2020 and 2024 US presidential elections along with giving users a custom made PoliScore ranking taking this residual errors of pollsters primarily into account.
How we built it
Used 538's polling data repository and our learned data science skills in preprocessing to extract the polling information we needed. Then created the graphs using Altair and developed a custom ranking based on our deduced residual error rate of pollsters to create our own ranking table. We then developed the front-end using HTML to format and CSS to style the web app to our theme. Next we created a resource page pulling articles and relevant information from the web about polling in an effort to ensure our users gained an understanding of the underlying political concepts at hand.
Challenges we ran into
1) Lack of data from 538 regarding raw polling forced us to scope in our project and take a narrower view. 2) As none of us had any front-end development experience HTML, JavaScript, and fine-tuned formatting proved to be a very significant hurdle for the team. Additionally as this was our first outing using Figma professionally we had to learn on the fly how to quickly translate mockups into an actual functioning webapp. 3) Having no web-hosting experience we had to seek help from our mentors. 4) Our data-analytics back-end proved very complex and unruly at times. We spent many hours troubleshooting and researching on the spot building are back-end as we went. 5) Being our first full-stack project as a team we had to grapple with issues of version control, front-end back-end integration, and keeping the project on task proved to be a challenging learning experience.
Accomplishments that we're proud of
1) Our custom ranking of pollsters and data suite visualized through our graph. 2) Our interactive graphics powered by Altair. 3) Use of the 98.css library to give our website a more retro aesthetic. 4) We implemented every single planned feature of our project from the very beginning and more.
What we learned
1) Proper use of pandas and Altair. 2) Formatting of HTML, styling of CSS. 3) How to work in parallel across front-end and back-end while maintaining project continuity. 4) Proper version control and project management through GitHub.
What's next for PoliCheck
1) Adding Senate and House races to our website with the same residual error focus. 2) Expanding our presidential race data set to include far more years. 3) Creating a more robust resource repository (articles, lectures, documentaries, etc). 4) Create a live webapp as opposed to a static app as it is now, make the graphs more visually appealing, and improve the textbox fonts.


Log in or sign up for Devpost to join the conversation.