What it does
Help police departments/areas measure their impact by creating effective visualizations of crime statistics and police reports.
How We built it
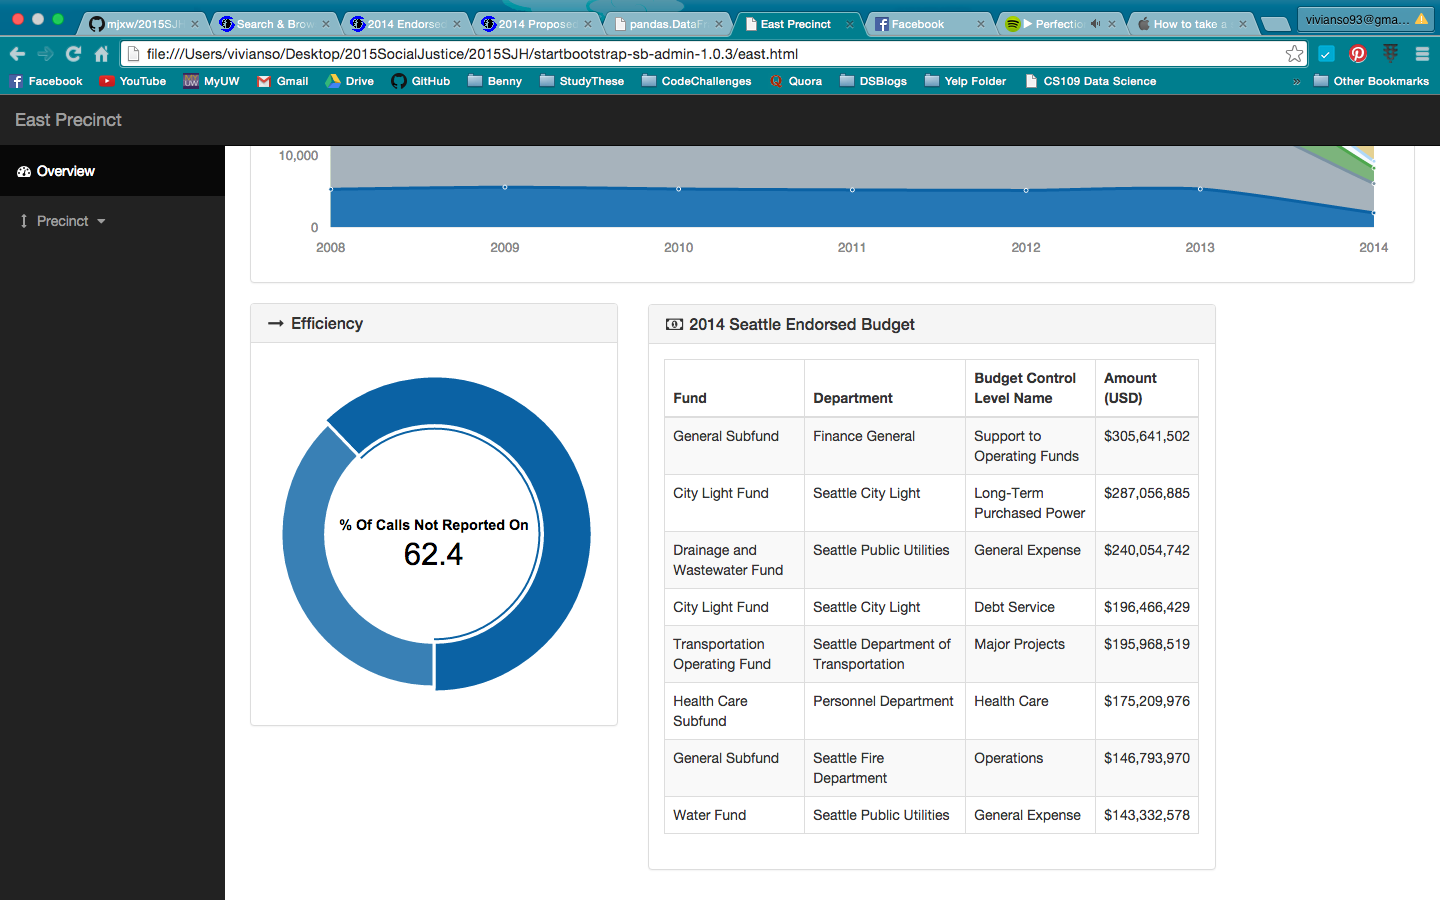
We used Seattle 911 police calls and police report data to create our own metric for determining the effectiveness of police departments. With the datasets, we separated data values corresponding to their respective date and precinct groups; we then compared computed a mean percentage value of phone calls that corresponded to a filed police report. This data can be seen on the donut chart. Additionally, we used overall crime data to plot the total number of reported crimes throughout Seattle from 2008 - 2014, and included data about the 2014 Seattle Endorsed Budget in a table.
What I learned
Throughout this process, we learned to look at data and practice manipulating variables to engineer new metrics for finding new trends and displaying the same information in a more effective way. We also learned new ways to display and design data results that are more communicative to a wide audience.
What's next for Police Assessment Tool
The goals for this project include engineering new features to measure police department performance and creating new data visuals for all features. Using more datasets, we also hope to plot crime rates/statistics and budget spending grouped by different precincts in the Seattle area. Our overall goal for the project is to help users assess how police departments are performing and determine if any areas of funding can receive more attention in order to reduce crime rates all throughout Seattle.
Built With
- bootstrap
- javascript
- morris.js


Log in or sign up for Devpost to join the conversation.