-
Finance
-

Astronomy
Inspiration
My inspiration for PolarisCapital Analytics came from two fields I’ve always been drawn to but rarely get to explore in my courses: astronomy and finance. I used this opportunity (Madhacks) as the perfect opportunity to bring those pieces together and build something that reflects my curiosity, my career goals, and the technical skills I’ve been developing in machine learning, data engineering, pipelines, and interactive dashboards. At the same time, I wanted this project to be something I could continue learning from long after the hackathon ends.
I used tools to accelerate the early prototyping phase so I could focus on the system design. But from there, I focused on designing the full architecture myself, splitting astronomy and finance into two isolated ML pipelines, mapping out all dashboards, organizing the ETL flow, integrating Kafka streaming concepts, and planning the models, charts, and interactions needed to make the system meaningful. My goal was not to “let tools build everything,” but to create a system I can rebuild, study, and grow into a real learning platform for machine learning and analytics.
A big part of my motivation also came from two opportunities I hope to pursue:
Machine Learning Gyrochronology Age Estimator Research Internship (UW-Madison) This project emphasizes open-source tools, scientific modeling, and real data workflows in astronomy. Building the astronomy pipeline helped me prepare for the kind of ML work used in that research project.
Marketing Operations Internship - Summer 2026 This role involves ROI analysis, predictive modeling for marketing assets, and multi-channel analytics...all of which overlap with financial risk, trends, and dashboard design. The finance side of PolarisCapital Analytics became my way to practice those analytical skills in a real system.
Together, these motivations and my personal interests (data engineering, cloud engineering, data analytics, astronomy, finance), my desire to learn, and my professional goals (Grad School & Data Engineering) help pave the way for creating PolarisCapital Analytics.
What it does
PolarisCapital Analytics is a multi-domain analytics platform that combines astronomy and finance with machine learning and interactive dashboards.
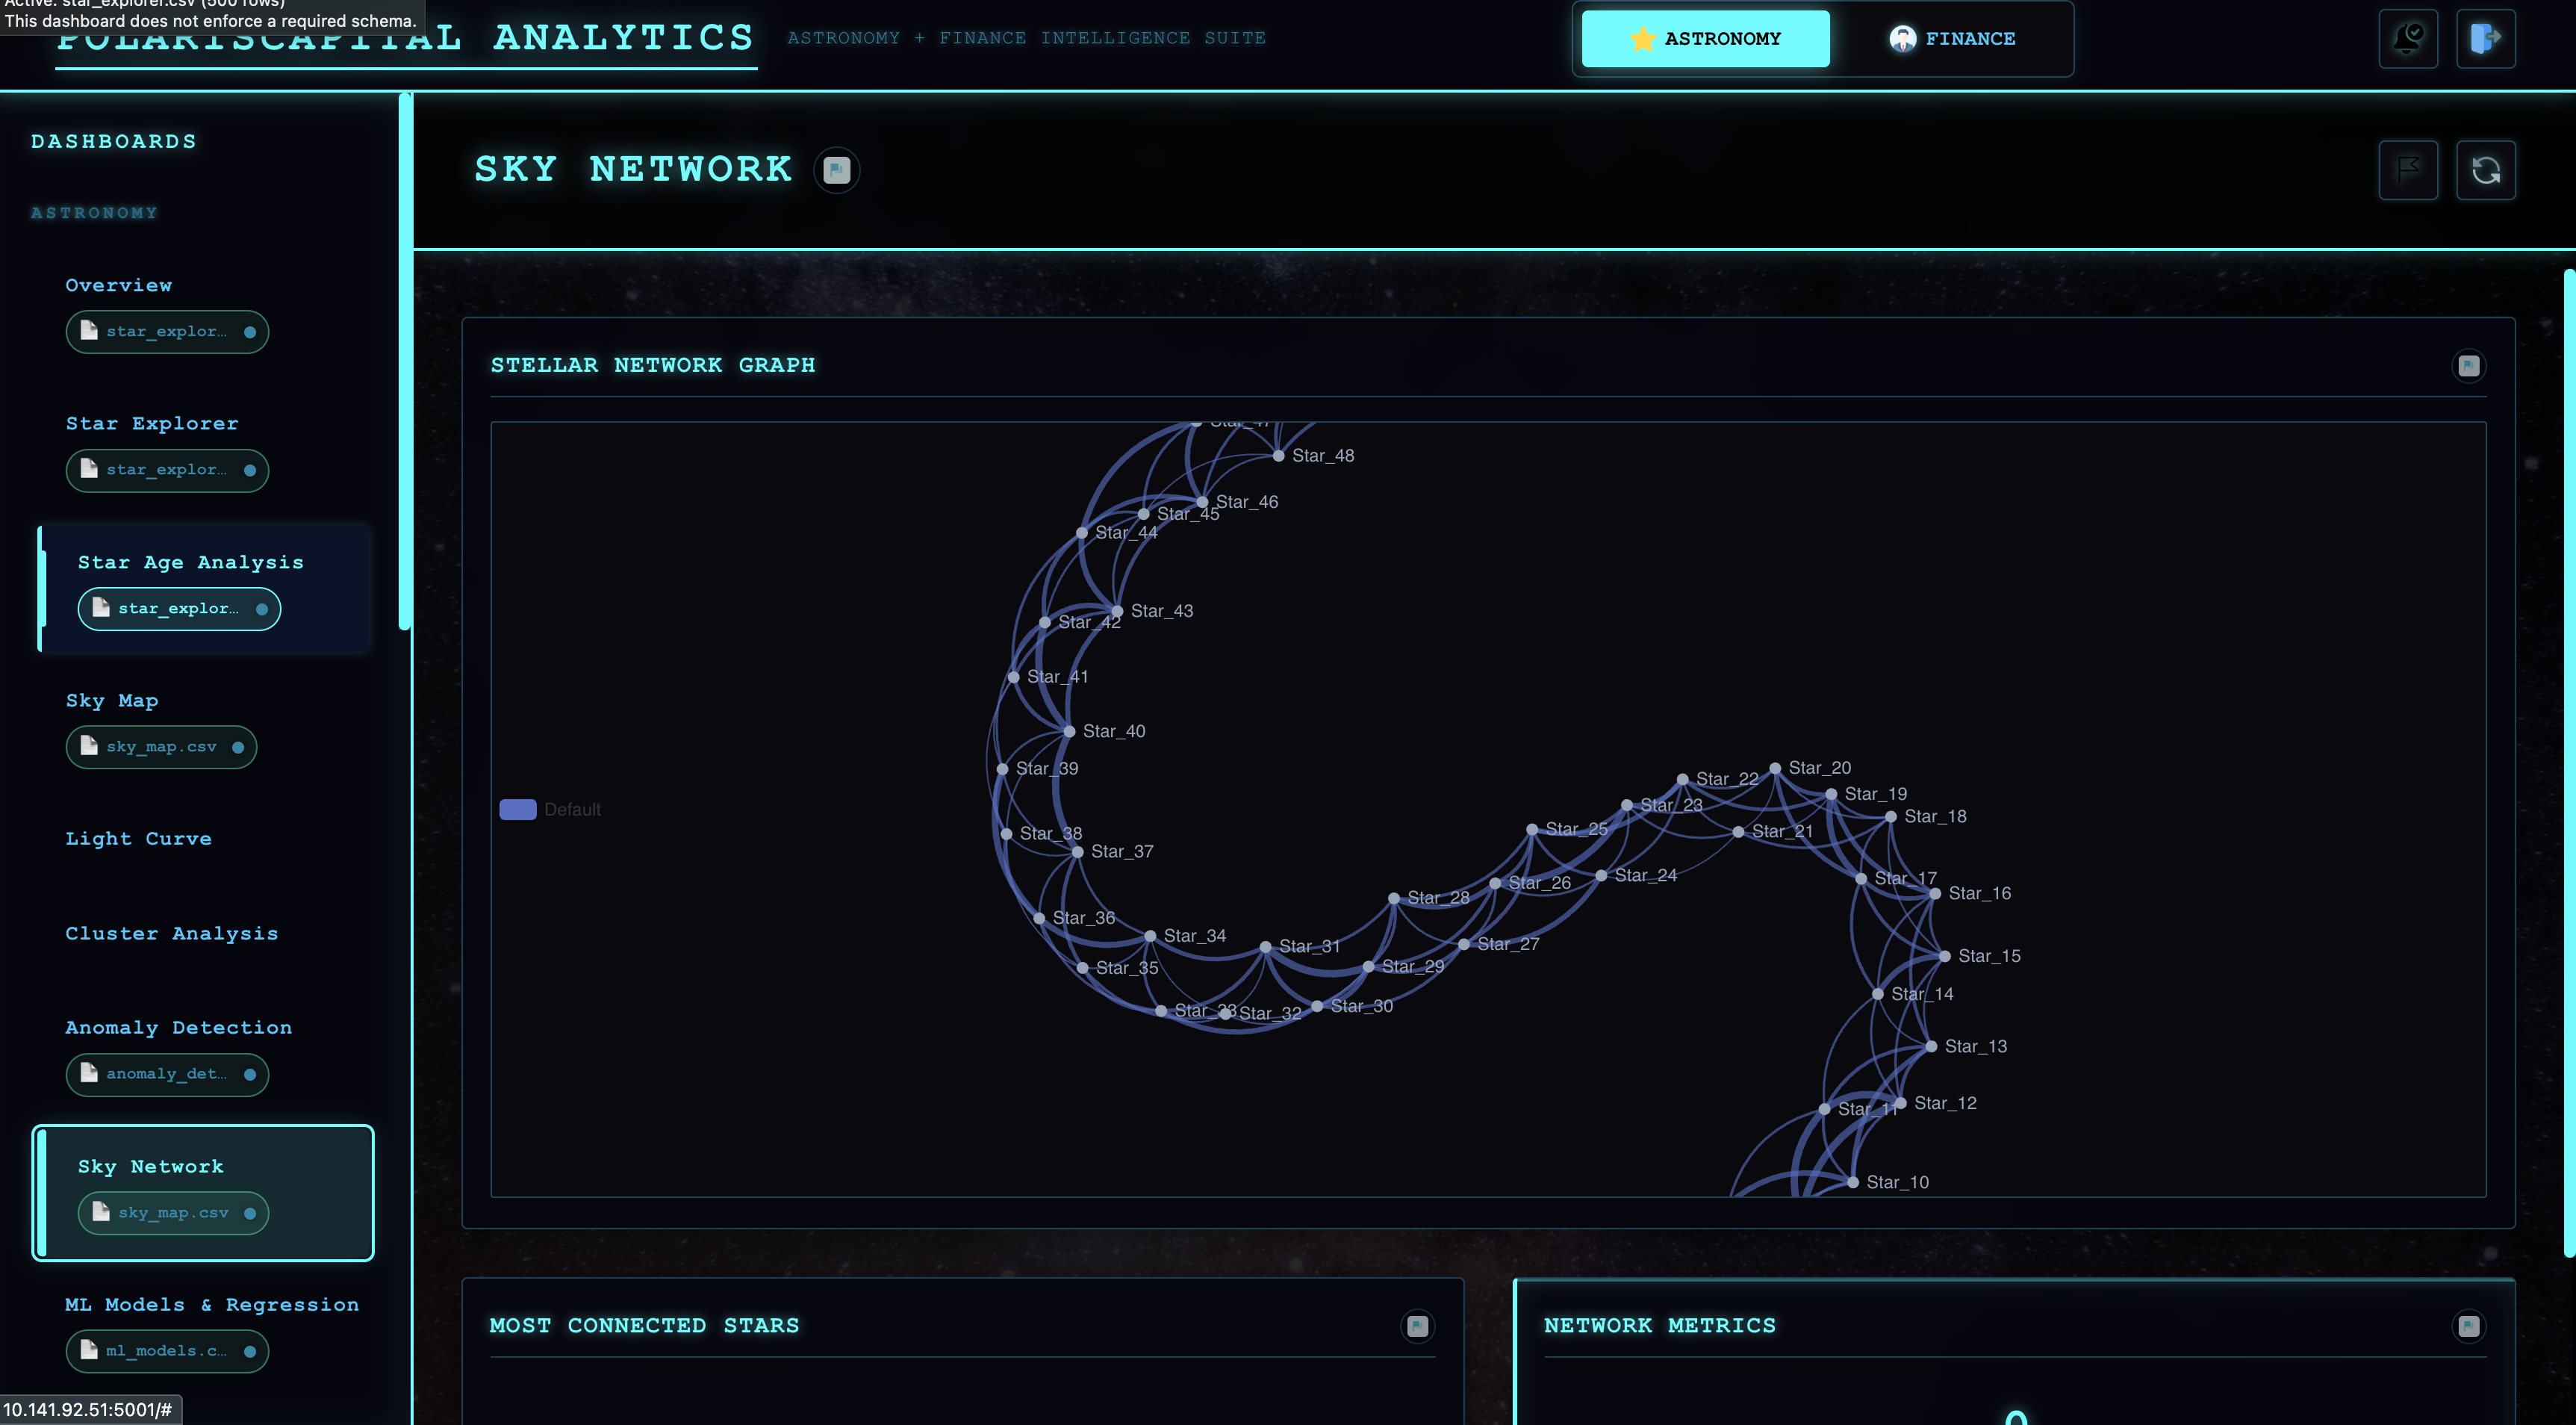
Astronomy Analytics:
- Star age prediction using XGBoost and LightGBM trained on stellar properties (temperature, mass, luminosity, rotation period)
- Anomaly detection with IsolationForest to flag unusual stars
- Color period regression to model relationships between stellar properties
- Sky map visualizations with RA and Dec coordinates
- Real data integration from sources like the NASA Exoplanet Archive and Gaia DR3
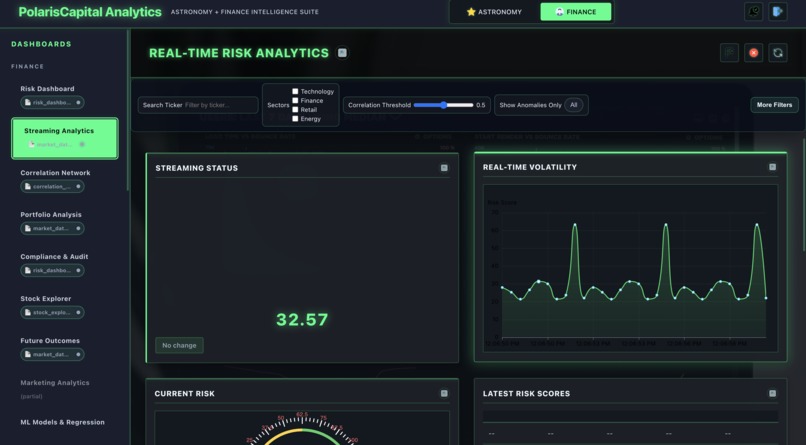
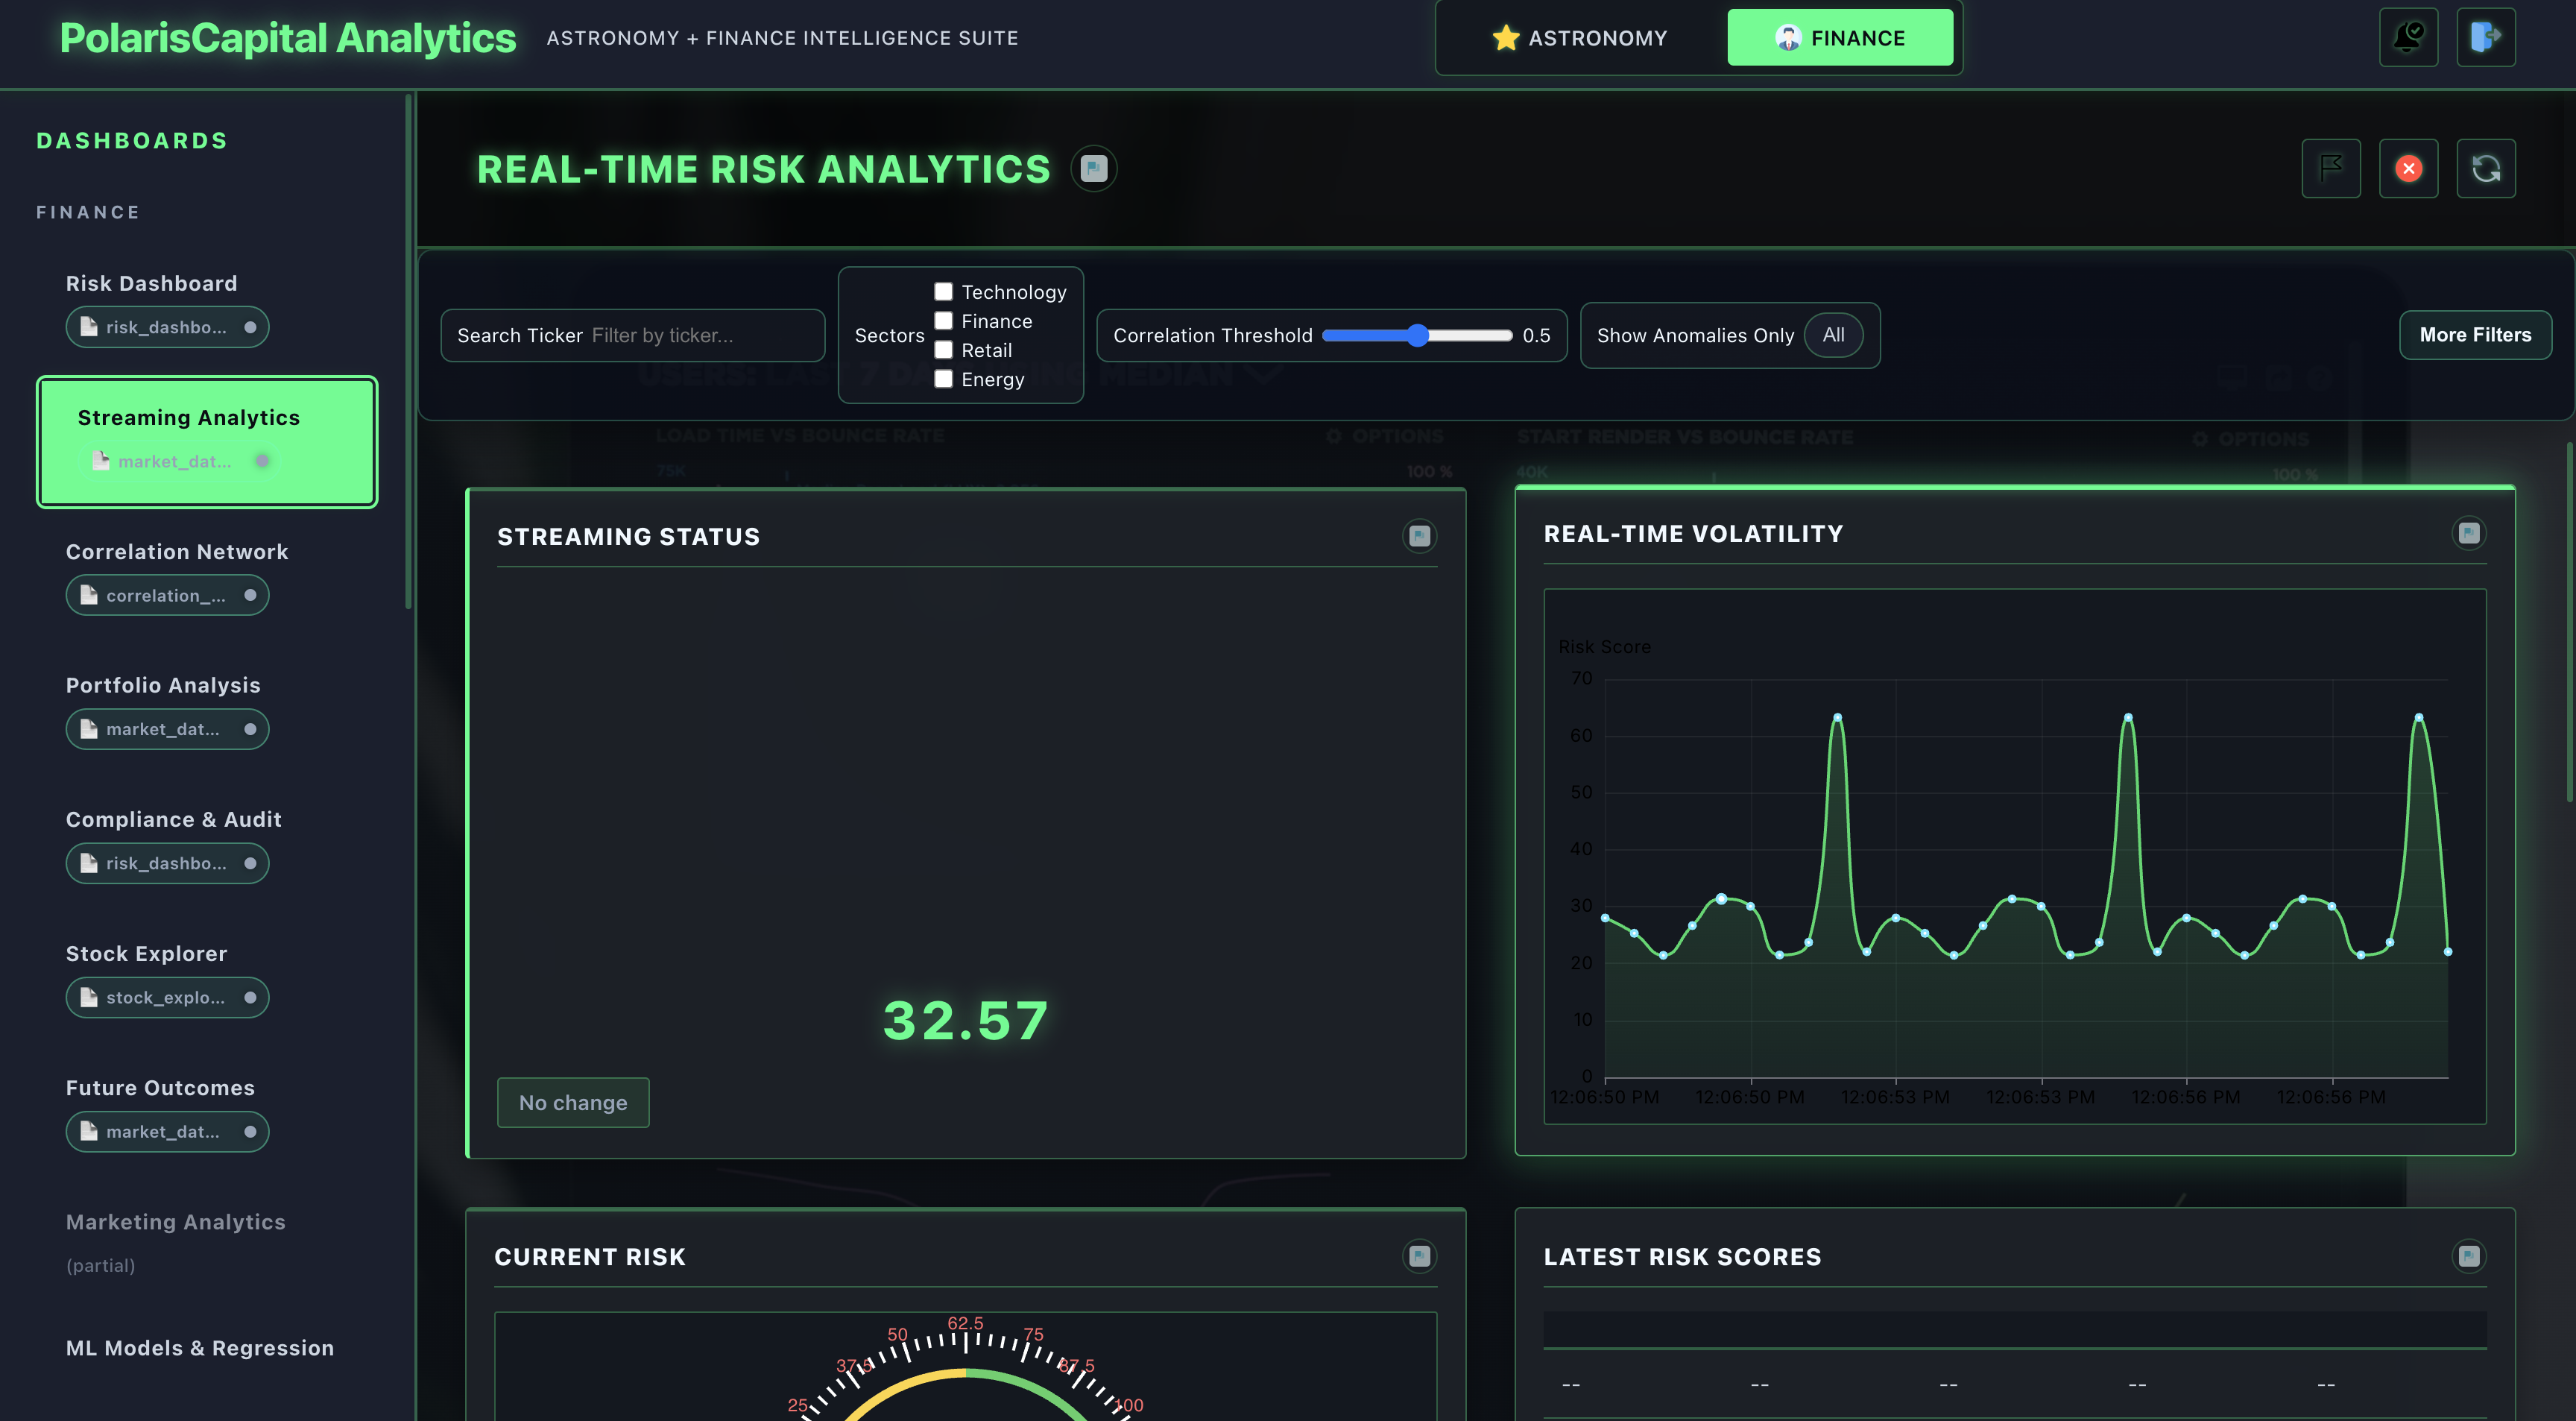
Finance Analytics:
- Risk scoring and volatility metrics for portfolios
- Correlation network analysis showing relationships between assets
- Real time streaming analytics with Kafka integration
- Portfolio analytics using expected return and Sharpe style ratios
- Monte Carlo style simulations for future outcomes
- Game theory based views using Nash equilibrium, Shapley values and auction style scenarios
- Marketing analytics style dashboards with ROI analysis and multi channel style views
Shared Platform Features:
- 15+ interactive dashboards with Power BI style visualizations
- CSV upload with automatic schema inference and domain detection
- Dashboard specific data file management so astronomy and finance do not interfere
- Interactive filters such as sliders, dropdowns, and date ranges that update all components on the page
- Real time style updates for streaming dashboards
- Professional UI with theme aware styling, astronomy uses cyan and finance uses green
- Explanation button for each plot & data graph
How I built it
Architecture
- Backend: Python + Flask REST API with separate astronomy and finance routes.
- Frontend: Vanilla JavaScript with reusable components and ECharts visualizations.
- Data: ETL style flow with Snowflake style schemas and hooks for Airflow or Prefect.
- ML: Separate astronomy and finance ML stacks, sharing loaders and preprocessing utilities.
Tech stack
- Backend and ML: Python, Flask, pandas, numpy, scikit-learn, XGBoost, LightGBM, simple time series models.
- Data engineering: Kafka style streaming pieces, Snowflake schemas, orchestration entry points.
- Frontend: HTML, CSS themes, JavaScript, ECharts and a bit of D3 style graphing.
- Data sources: yfinance for markets plus astronomy catalogs like NASA style exoplanet data.
Development Process
- Designed the dual mode architecture first, then mapped dashboards to API endpoints.
- Implemented ML pipelines, then wired them to JSON responses for the frontend.
- Built reusable UI components (KPI, charts, tables, networks) and plugged them into each dashboard.
- Added filtering, event based updates, and real data download scripts to make it feel like a real tool.
Challenges I ran into
- Managing many dashboards and datasets: Different dashboards needed different data and features. I solved this by mapping each dashboard to its own data context and CSV files so they do not interfere.
- Combining streaming and batch analytics: Integrating Kafka style streaming with batch trained models was tricky. I created a small streaming risk engine that applies pre trained models to incoming data.
- Keeping astronomy and finance cleanly separated: The domains use different features and models. I had to enforce strict separation in the ML and API layers while still reusing shared utilities where possible.
- Coordinating filters and components: Making filters update every card and chart at once required an event driven frontend pattern with a shared state and clear update flow.
- Making visualizations understandable: Cluster plots, correlation networks, and time series can be confusing without context, so I added clear labels, tooltips, and simple explanations for what each view shows.
Accomplishments that we're proud of
- Built a dual-domain platform that supports both astronomy and finance with many fully working dashboards, not just a single demo.
- Implemented real ML models (XGBoost/LightGBM, clustering, anomaly detection, simple game-theory views) instead of placeholders.
- Designed a professional, theme-aware UI with reusable components (KPI cards, charts, tables, networks, filters).
- Integrated real data sources (astronomy and finance) with a clean, scalable architecture that separates domains but shares infrastructure.
What we learned
- How to design end-to-end ML pipelines (data loading → preprocessing → training → inference → visualization).
- How to structure a frontend without a framework using a component-based approach in vanilla JavaScript.
- How to manage data and schemas for many dashboards across two very different domains.
- How much UX, clear labels, and explanations matter in making ML results understandable.
What's next for PolarisCapital Analytics
- How to design end-to-end ML pipelines (data loading → preprocessing → training → inference → visualization).
- How to structure a frontend without a framework using a component-based approach in vanilla JavaScript.
- How to manage data and schemas for many dashboards across two very different domains.
- How much UX, clear labels, and explanations matter in making ML results understandable.


Log in or sign up for Devpost to join the conversation.