Inspiration
Display the story in the dataset of pokemon where I represent the different types of pokemon in the bar chart and their speed in the form of a Histogram.
Built With
- matplotlib
- python
- seaborn
In this project, I have completed the task of Day 4 which is to represent a dataset (of your choice) pictorially using any data visualization library.
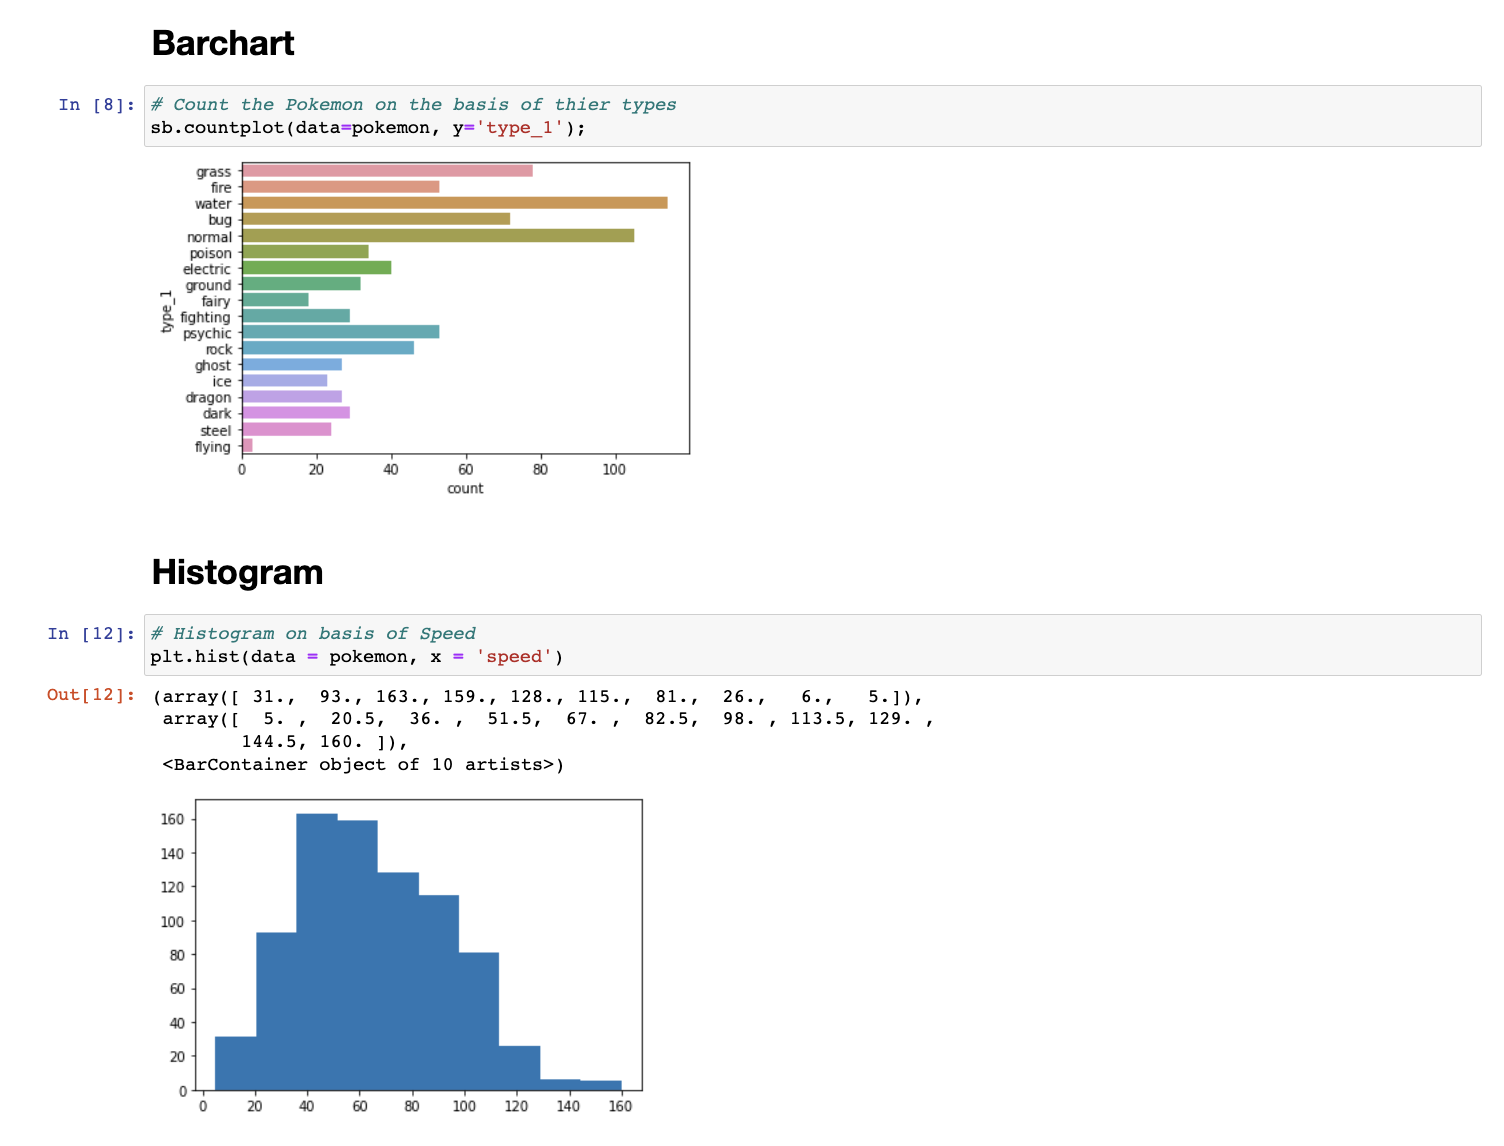
Display the story in the dataset of pokemon where I represent the different types of pokemon in the bar chart and their speed in the form of a Histogram.

Leave feedback in the comments!
Log in or sign up for Devpost to join the conversation.