
Inspiration
Drug discovery tooling is usually locked inside heavy desktop suites or server clusters. For students, clinicians, and early-stage startups, that creates a huge barrier: you need a workstation, a license, a GPU – just to answer a simple question like “Is this molecule likely to be soluble and non-toxic?”
PocketQSAR was born from the idea of putting QSAR in your pocket:
- Show that a modern ARM phone is powerful enough to run meaningful cheminformatics models fully on-device with ExecuTorch.
- Turn abstract ML metrics into visual, intuitive chemistry – chemical space maps, descriptor radar plots, and 2D structures you can tap.
- Provide an educational playground where anyone can feel how changes in MW, logP or TPSA move a molecule across developability space.
- Use the ARM AI challenge as a real-world testbed: not just “it runs on a phone”, but “here is the latency, cores, ABI and performance profile of this QSAR model on your device”.
In short: PocketQSAR is an experiment in democratizing molecular ML – making serious drug-discovery style analysis feel as simple as opening an app.
What it does
⚙️ What PocketQSAR Does
PocketQSAR is an on-device QSAR workbench for small molecules:
Runs a QSAR model on your phone
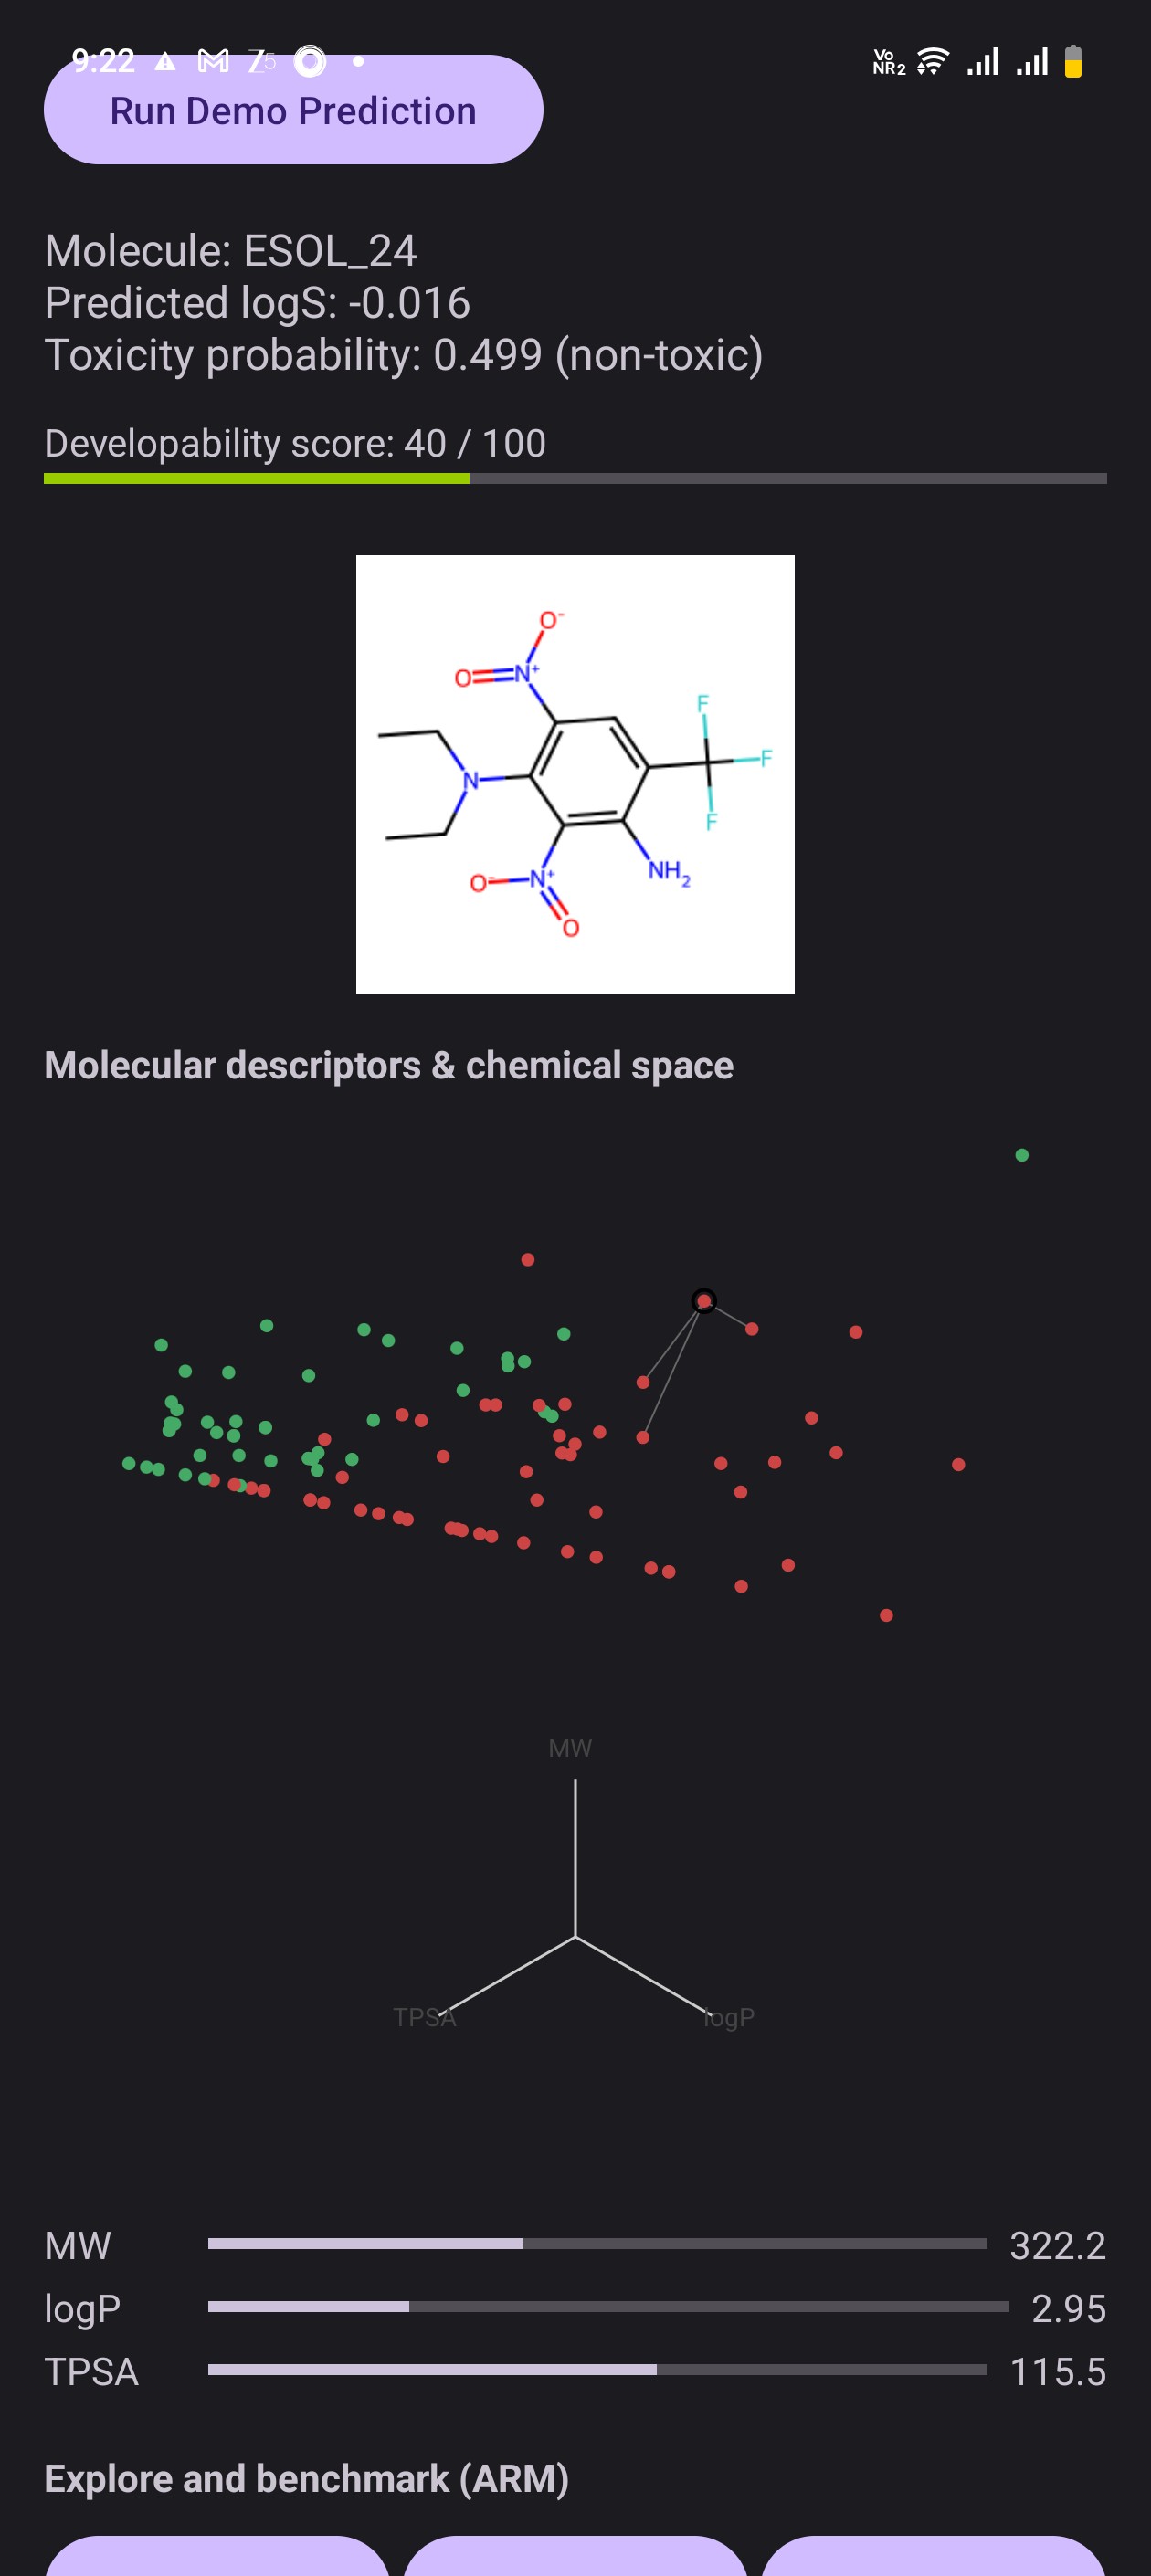
Uses an ExecuTorch.ptemodel to predict:- Aqueous solubility (logS)
- Toxicity probability
- A combined Developability score (0–100)
Visualizes chemical space
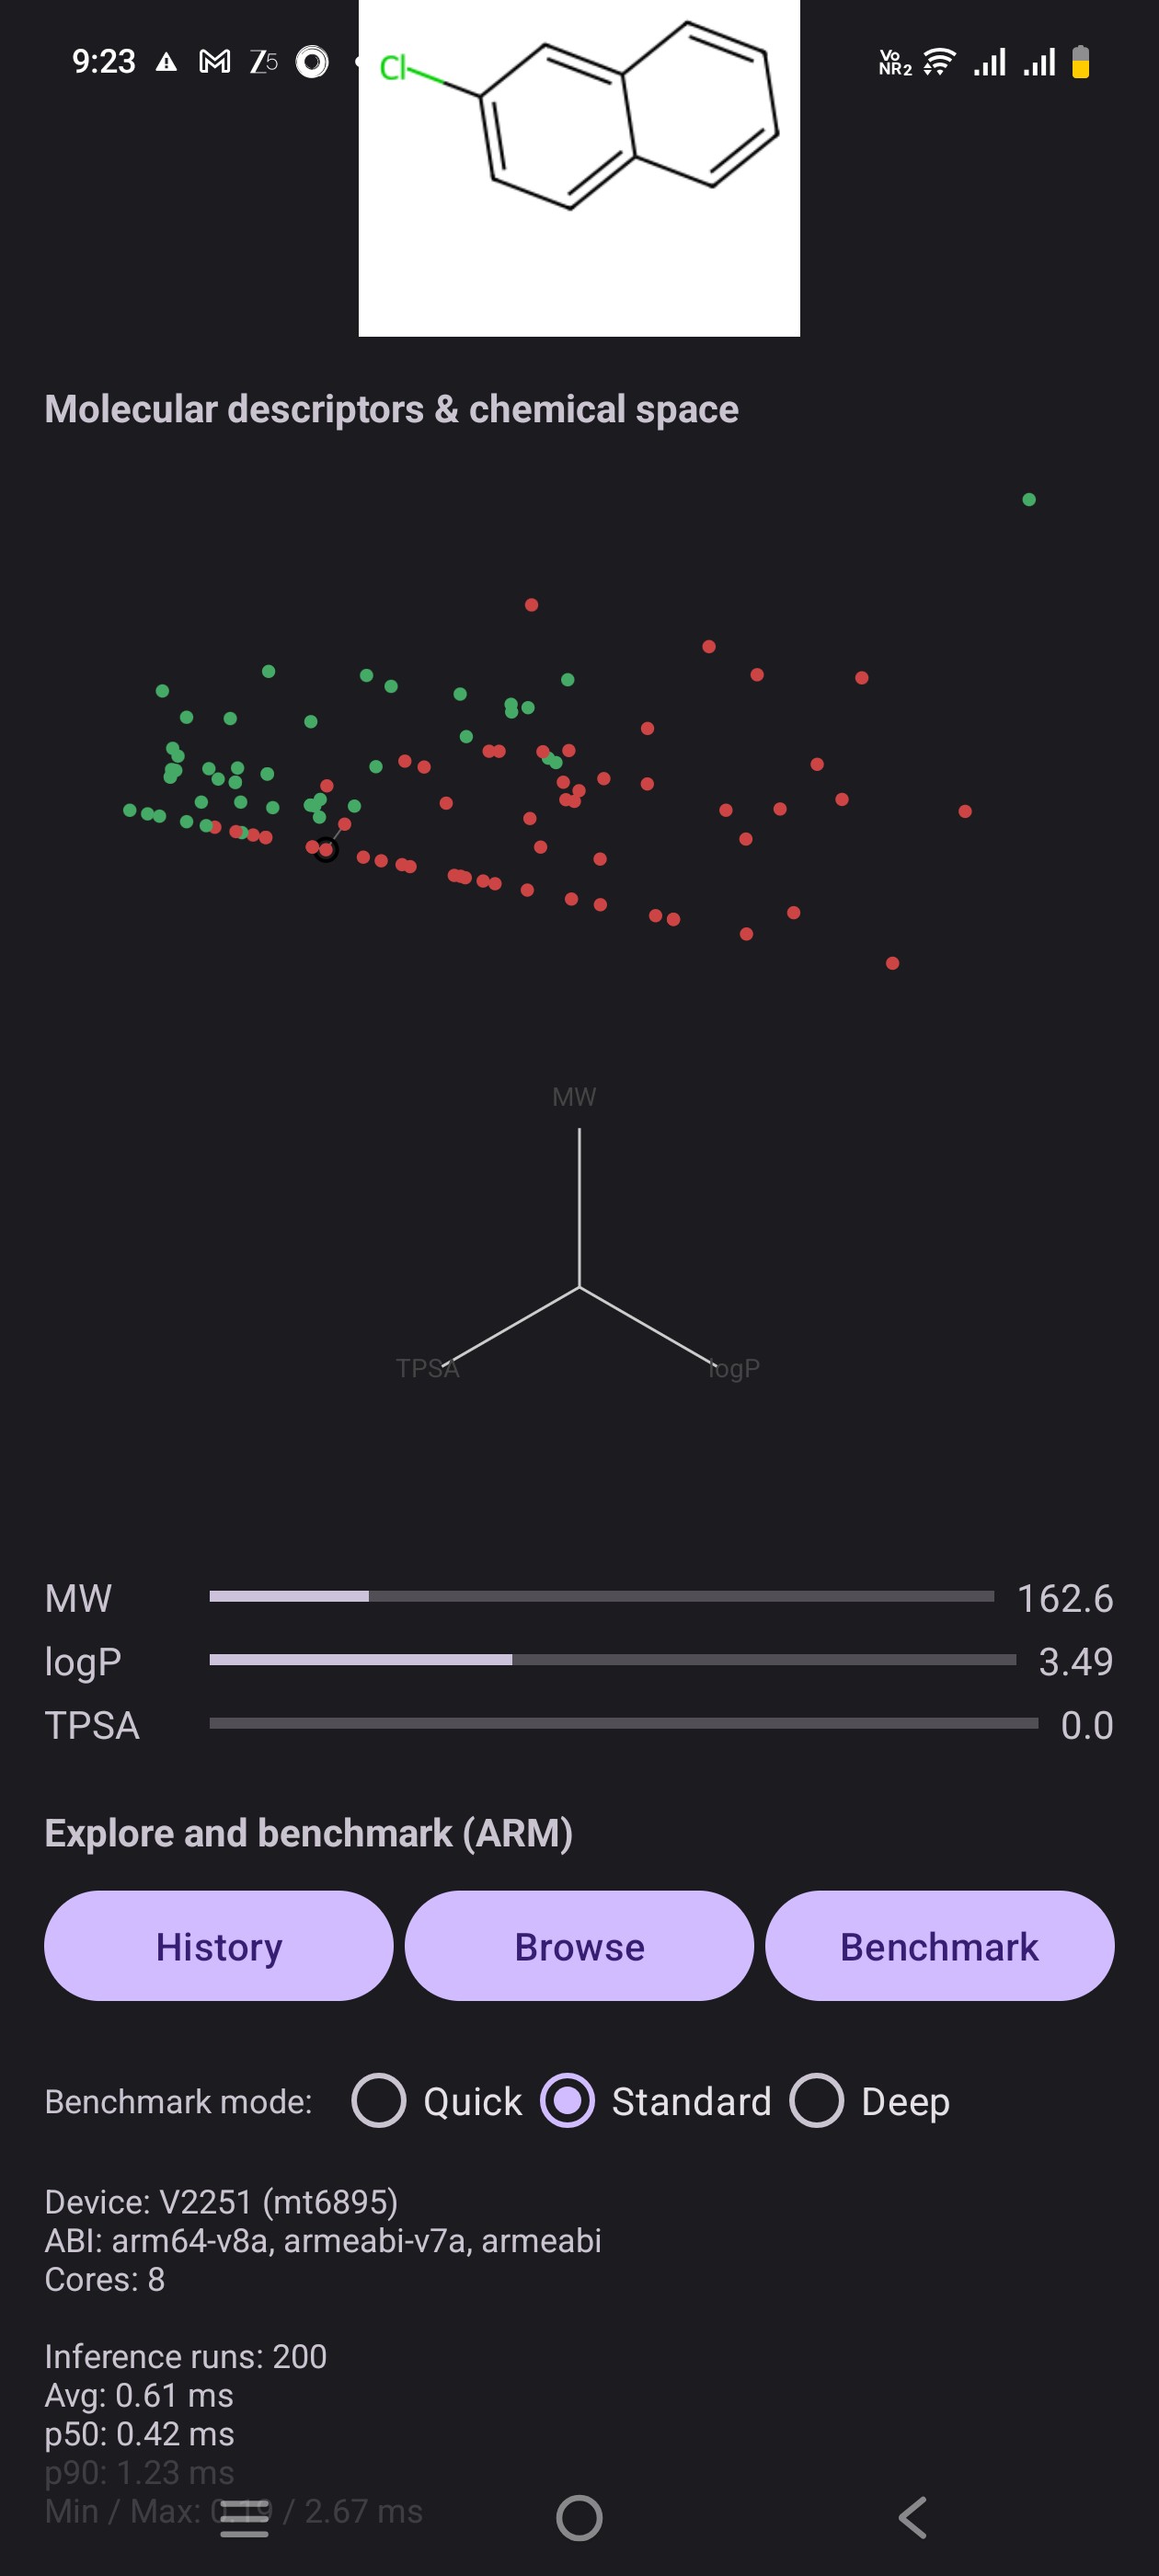
- Each demo molecule is a point in a 2D “chemical space” scatter plot.
- Tap a point to select that molecule, run inference, and see where it sits relative to others (green = friendlier / red = riskier).
- Each demo molecule is a point in a 2D “chemical space” scatter plot.
Shows 2D molecular structures
- For the selected molecule, the app loads a 2D structure image from
assets/mol_imgsand displays it next to the predictions.
- For the selected molecule, the app loads a 2D structure image from
Explains key descriptors
- MW, logP and TPSA are shown with progress bars and numeric values.
- A radar chart highlights how “balanced” the molecule is across these properties.
- MW, logP and TPSA are shown with progress bars and numeric values.
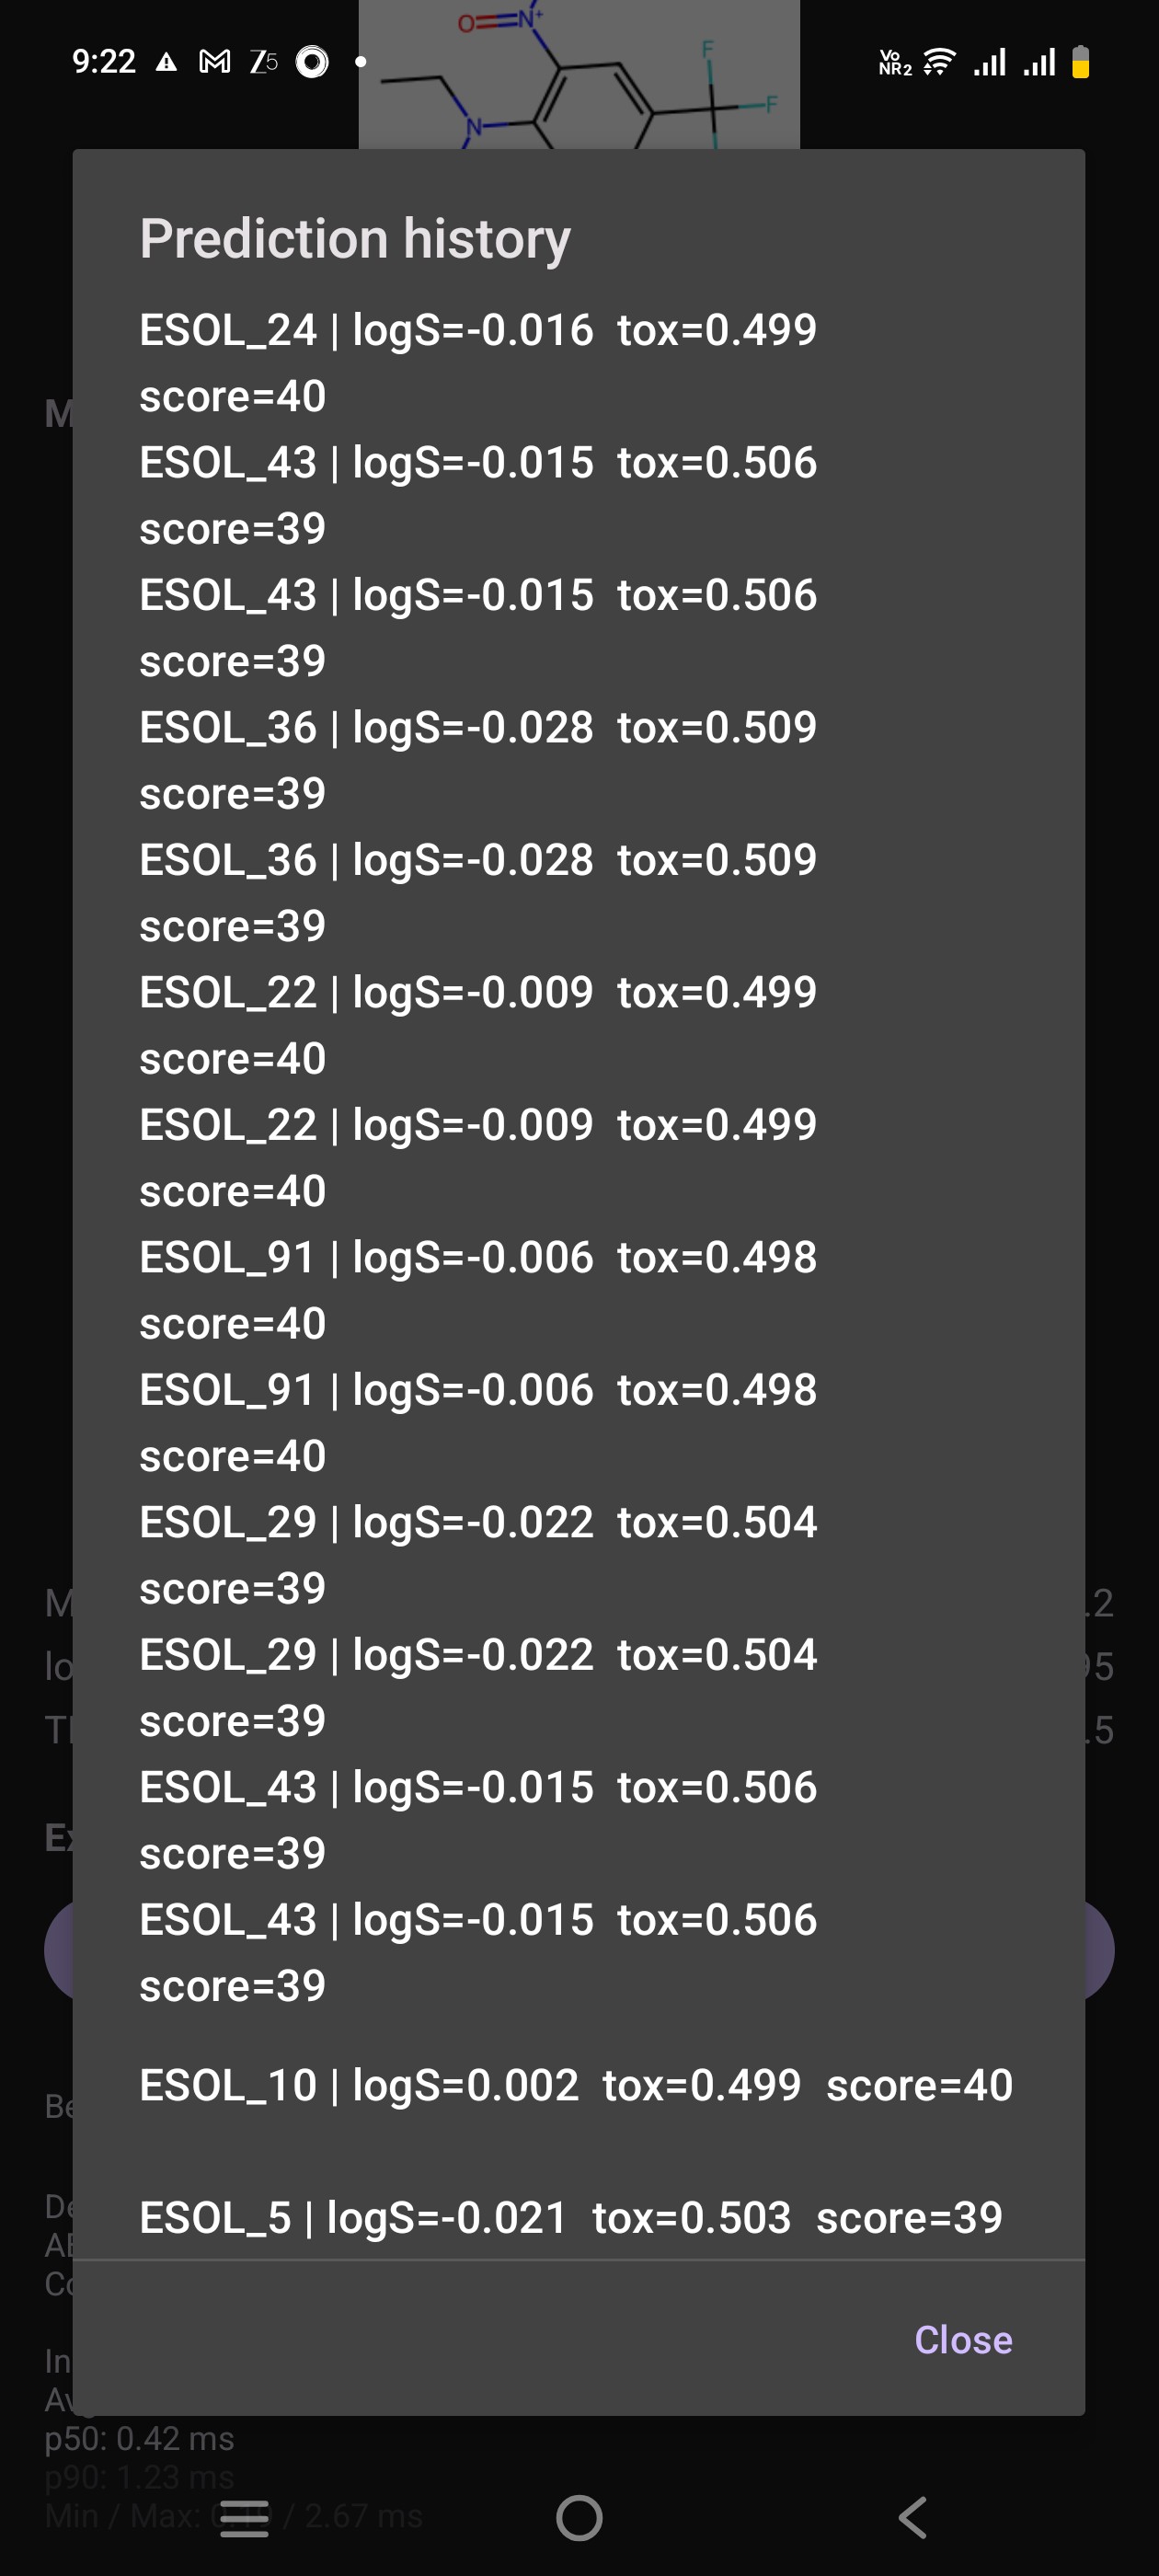
Keeps a prediction history
- Every run is stored in a lightweight in-memory log.
- A History dialog lets you quickly review past molecules and their scores.
- Every run is stored in a lightweight in-memory log.
Lets you browse the whole library
- The Browse molecules button opens a list of all demo compounds so judges can jump directly to any example.
Benchmarks ARM on-device performance
- A Run latency benchmark button runs many inferences on the current molecule and reports:
- Average, p50, p90, min, max latency (ms)
- Device model, hardware, ABI and core count
- This makes the app both a QSAR demo and a mini ARM AI benchmark tool.
How we built it
🛠 How We Built It
We split the work into two main pieces: a Python / ML pipeline and an Android / ExecuTorch app.
1. Data + Model in Python (Colab)
- Started from the ESOL (Delaney) aqueous solubility dataset.
- Used RDKit to:
- Parse SMILES
- Compute descriptors (MW, logP, TPSA, HBD, HBA, etc.)
- Generate model input features (2048-dim fingerprint-like vector).
- Trained a small PyTorch MLP that:
- Regresses logS (solubility).
- Predicts toxicity probability (binary output via sigmoid).
- Tuned basic hyperparameters (layers, hidden size, dropout) until it was stable on validation and small enough for on-device inference.
2. Preparing data for mobile
- Selected a curated subset of molecules for the demo.
- Built a mobile-friendly JSON (
mobile_molecules.json) with, for each molecule:id,namedescriptors(mw, logp, tpsa, hbd, hba, etc.)features(the exactFloatArraywe feed into ExecuTorch)embed2dcoordinates from a PCA/UMAP embedding to drive the chemical space scatterplot.
- Generated 2D PNG structures for each molecule using RDKit and saved them to
app/src/main/assets/mol_imgs/.
3. Exporting the model to ExecuTorch
- Took the trained PyTorch model and:
- Traced/exported it to an ExecuTorch-compatible representation.
- Targeted an XNNPACK / CPU backend suitable for ARM devices.
- Saved the final mobile model as
qsar_net_xnnpack.pte. - Placed the
.ptemodel underassets/models/and wrote a small helper (ModelFileHelper) to:- Copy it to internal storage on first run.
- Load it via
org.pytorch.executorch.Module.load().
4. Android app in Kotlin
- Built a single-activity app (
MainActivity) in Kotlin, wired to:QsarExecuTorch: thin wrapper around ExecuTorch model inference.DemoMoleculeRepository: loads and parsesmobile_molecules.json.
- Designed the UI in
activity_main.xml:- Run Demo Prediction button.
- 2D molecule image (
ImageView) that loads fromassets/mol_imgs. - ChemicalSpaceView: custom
Viewthat draws the 2D embedding; tap to select molecules. - DescriptorRadarView: custom
Viewfor MW/logP/TPSA radar plot. - Descriptor bars (MW, logP, TPSA) + a Developability score progress bar.
- History and Browse molecules buttons.
5. On-device ARM benchmarking
- Instrumented the model call in Kotlin with
SystemClock.elapsedRealtimeNanos(). - Added a “Run latency benchmark” section:
- Runs the model N times (e.g. 50 / 200 / 1000) on the current molecule.
- Collects per-run latency in ms, sorts, and computes:
- Average, p50, p90, min, max.
- Displays:
Build.MODEL,Build.HARDWARE,SUPPORTED_ABIS,availableProcessors(),- and the latency stats.
- This turns PocketQSAR into both:
- A scientific demo (QSAR + descriptors + chemical space), and
- A practical ARM ExecuTorch benchmark on real devices.
6. Packaging & testing
- Built debug and release APKs from Android Studio.
- Tested on:
- Emulator (x86_64, for layout & logic),
- Real ARM phones (for actual latency and power of ExecuTorch on-device).
- Captured screenshots and benchmark outputs for the ARM AI challenge submission.
Challenges we ran into
🚧 Challenges We Ran Into
We hit real-world problems at almost every layer of the stack:
1. Getting from PyTorch → ONNX → ExecuTorch
Exporting the QSAR model wasn’t trivial:
- The first ONNX export failed because we accidentally wrapped the model in a
plain function, and
torch.exportrequires an actualnn.Module. - We also saw dynamic shape / opset warnings (17 vs 18) and had to adjust the export call and simplify the model so ExecuTorch could run it reliably on mobile.
Once we finally had a .pte file, we still had to confirm that input tensor
shapes and dtypes matched exactly on Android.
2. Feature dimension mismatch (2048 vs 2055)
On device we hit:
Attempted to resize a static tensor. Expected shape (1, 2048), but received (1, 2055).
This forced us to go back and “audit” the full pipeline:
- Check how features were built in Python.
- Confirm the model’s first layer input size.
- Make sure the JSON feature vectors and the Kotlin
inputDimwere in sync.
After aligning everything to 2048 and regenerating the assets, ExecuTorch finally ran without shape errors.
3. Android + ExecuTorch integration and assets
We hit several small but painful Android issues:
- Making sure the
.ptemodel was correctly copied fromassets/to internal storage before callingModule.load(). - Getting the package name / namespace / paths consistent so Java/Kotlin
code, XML views and custom views (
ChemicalSpaceView,DescriptorRadarView) all worked together. - Dealing with
NullPointerExceptionwhen the custom views orfindViewByIddidn’t match the XML layout IDs.
4. Rendering molecules & matching images
For the 2D structures:
- Filenames generated offline didn’t always match our in-app IDs / names.
- We had to implement a fuzzy matching loader that tries multiple patterns:
id.png,name.png, lowercased, underscores, etc. - Also handle the “no image found” case gracefully so the app doesn’t show stale or broken images.
5. Making the UI both scientific and mobile-friendly
We wanted:
- Chemical space scatter,
- Descriptor bars,
- Radar plot,
- Structure image,
- Prediction text,
- History, browsing, and benchmark controls…
…all on a phone screen.
Balancing information density vs readability was a challenge:
- We moved to a scrollable layout, simplified labels, and used small custom views instead of heavy chart libraries to keep performance snappy on ARM.
6. On-device benchmarking nuances
Measuring latency correctly isn’t as simple as end - start:
- We had to add a warm-up pass so that we don’t benchmark the first-time JIT / cache effects.
- Use
SystemClock.elapsedRealtimeNanos()instead ofcurrentTimeMillis. - Sort latencies and report avg / p50 / p90 / min / max so judges see stable, distribution-aware numbers, not just a single noisy value.
All of these challenges shaped PocketQSAR into something that is not only a working demo, but also a realistic snapshot of what running molecular ML on ARM phones actually feels like.
Accomplishments that we're proud of
1. Turning a phone into a mini medicinal chemistry lab
We didn’t just show a number on screen – we built a full QSAR workbench:
- On-device prediction of logS and toxicity probability using ExecuTorch.
- A derived Developability score (0–100) that combines solubility, toxicity, and simple Lipinski-style rules.
- Linked 2D structures, descriptors, chemical space, and scores in one coherent workflow that feels like a pocket-sized drug discovery UI.
2. Rich, explainable visualizations on mobile
On a small ARM device, we still managed to pack:
- An interactive chemical space view where each molecule is a point you can tap.
- A descriptor radar plot for MW/logP/TPSA to give quick “shape” intuition.
- Live descriptor bars and a clear progress-based developability gauge.
- Instant feedback when switching molecules, so the model feels tangible and not like a black box.
3. Three-tier on-device benchmark system
We’re especially proud of the built-in ARM benchmarking, designed for judges:
Quick benchmark (e.g. 50 runs)
- Fast sanity check while demoing.
- Shows how ExecuTorch responds even under light load.
Standard benchmark (e.g. 200 runs)
- Balanced mode for screenshots and fair comparisons between devices.
- Enough runs to stabilize average and median latency.
Deep benchmark (e.g. 1000 runs)
- Serious, statistically meaningful measurement for the ARM challenge.
- Reports:
- Average latency
- p50 and p90
- Min / Max
- Device model, hardware, ABI, and CPU core count
All three modes share the same UI and use real ExecuTorch inference on the actual device, so PocketQSAR doubles as a QSAR demo and a portable ARM AI benchmarking tool.
4. A complete end-to-end pipeline, not just a demo screen
We’re proud that PocketQSAR covers the full path:
- Data curation (ESOL), descriptor engineering, and model training in PyTorch.
- Model export to ExecuTorch and careful input-shape alignment.
- JSON + image asset pipeline for molecules, descriptors, and embeddings.
- Kotlin/Android integration with custom views, history, browsing, and benchmarking.
It’s a project that touches ML, cheminformatics, mobile engineering, and performance profiling – all running smoothly on a single ARM phone.
What we learned
1. Bridging ML and mobile is more than “export and run”
We learned that taking a PyTorch model to a phone is not a one-click step:
torch.onnx.export/torch.exportare sensitive to how the model is wrapped – you really do need a cleannn.Module.- Input shapes and dtypes must match exactly from Python → JSON → Kotlin → ExecuTorch; even a small mismatch (2048 vs 2055) blows up at runtime.
- Designing the network with mobile in mind (size, ops, output heads) up front saves pain later.
2. ExecuTorch is powerful but strict
Working with ExecuTorch taught us:
- Keep the model graph simple and well-behaved – avoid exotic layers or unsupported ops when planning for mobile.
- Asset handling matters: the
.ptefile must be copied correctly fromassets/to internal storage and loaded from the right path. - When ExecuTorch fails, the errors are usually telling you something real about shapes, static tensors, or unsupported behavior.
3. On-device benchmarking needs rigor, not just a stopwatch
We learned how tricky “just benchmark it” can be:
- You need warm-up runs to avoid counting JIT / cold-start overhead.
- Using
elapsedRealtimeNanos()and multiple runs gives you stable distributions (avg, p50, p90, min, max), not just one noisy number. - Different run counts (quick / standard / deep) are useful for different audiences: live demo vs serious analysis.
4. Good UX makes ML feel understandable
We also learned how much visual design affects understanding:
- Chemical space plots + radar charts + descriptor bars make the model’s behavior feel more intuitive than raw numbers.
- Small details (colors for risk, smooth layout in a scroll view, clear labels) matter when you’re trying to explain ML decisions to non-ML users.
- Tapping points and instantly seeing predictions and structures is a powerful way to build trust in a model.
5. Mobile constraints force clarity
Working within a phone’s constraints taught us to:
- Keep the model compact and efficient enough for real-time use.
- Avoid overcomplicated charts / libraries and instead build lightweight custom views that are fast and easy to control.
- Think end-to-end: training, export, assets, Android lifecycle, and user experience all have to line up for the app to feel “simple” to the user.
Overall, we came away with a much clearer idea of what it takes to turn a research QSAR model into a real, shippable, on-device experience on ARM.
What's next for PocketQSAR: On-Device Drug Discovery with ExecuTorch
PocketQSAR is a first step toward serious cheminformatics on ARM phones. There are several directions we’re excited to explore:
1. Richer models and endpoints
- Add more prediction heads beyond logS + toxicity:
- Permeability, clearance, hERG risk, basic ADMET flags.
- Experiment with multi-task learning so one compact model can power several medicinal chemistry questions at once.
- Integrate uncertainty estimation (MC dropout / ensembles) so the app can say “I don’t know” when far outside its training domain.
2. SMILES input and lightweight editing
- Let users type or paste SMILES and run on-the-fly predictions.
- A simple “edit mode” to tweak fragments or R-groups and instantly see how developability shifts.
- Highlight counterfactual suggestions (e.g., “reduce logP”, “lower MW”) based on descriptor patterns.
3. More advanced chemical space analytics
- Ship UMAP + Louvain / Leiden clusters precomputed for larger libraries, so users can explore pockets of similar chemotypes on-device.
- Allow switching between PCA, UMAP, and maybe t-SNE views.
- Add simple cluster-level summaries: typical MW/logP/TPSA ranges and risk profiles per cluster.
4. Deeper ARM + ExecuTorch benchmarking
- Extend the current three benchmark modes with:
- Optional throughput mode (molecules per second).
- Battery / thermal awareness (not full profiling, but user-facing hints).
- Compare different ExecuTorch backends (where available) or model variants to illustrate accuracy vs latency trade-offs on ARM.
- Export benchmark reports (e.g., JSON) that can be aggregated across devices for larger studies.
5. Domain adaptation for specific projects
- Allow loading different
.ptemodels (e.g., “oncology set”, “CNS set”) so PocketQSAR becomes a front-end shell for multiple specialized pipelines. - Explore on-device fine-tuning or calibration on small local datasets (where feasible) to adapt scores to specific labs or chemotypes.
6. Educational and collaboration features
- Add an “Explain this prediction” screen:
- Show descriptor contributions, thresholds, and rule-of-five style messages.
- Include a teaching mode for students with guided examples (“find a more soluble analogue”, “minimize toxicity at fixed MW”).
- Optional export of session history (molecules + scores + timings) that teams can share or attach to reports.
In short, PocketQSAR can evolve from a single-app demo into a modular, ARM-first platform for interactive, explainable, and benchmarkable molecular ML on everyday devices.
Built With
- exectorch
- kotlin
- pytorch


Log in or sign up for Devpost to join the conversation.