Pneumonia Detection Using CNN + LSTM Hybrid Model
This project implements a hybrid deep learning model to detect pneumonia from pediatric chest X-ray images. By combining Convolutional Neural Networks (CNNs) and Long Short-Term Memory (LSTM) networks, the model captures both local spatial features and global contextual dependencies across lung regions. Built using TensorFlow/Keras, it includes visualizations, performance metrics, and a user-friendly interface for real-world deployment. Dataset
We use the Pediatric Chest X-ray Dataset from Kaggle, which includes labeled chest X-ray images categorized as:
- NORMAL
- PNEUMONIA
Folder Structure:
Pediatric Chest X-ray Pneumonia/
├── train/
│   ├── NORMAL/
│   └── PNEUMONIA/
├── test/
│   ├── NORMAL/
│   └── PNEUMONIA/
Deep Learning Architecture Convolutional Neural Networks (CNNs)
CNNs extract spatial features such as edges, textures, and shapes from X-ray images.
Key Components:
Conv2D: Learns visual patternsMaxPooling2D: Reduces dimensionalityReLU: Adds non-linearityHe Initialization: Stabilizes gradient flow
Why CNN? CNNs are ideal for medical imaging tasks due to their ability to learn hierarchical spatial features. Long Short-Term Memory (LSTM)
LSTMs capture long-range dependencies across reshaped image sequences.
Key Components:
- Memory Cell: Retains historical context
- Gates: Control information flow
LSTM Layer: Processes feature sequences
Why LSTM? By reshaping CNN outputs into sequences, LSTMs can learn spatial relationships across lung regions—critical for detecting pneumonia spread. CNN + LSTM Hybrid Model
Architecture Flow:
Input Image (224x224x3)
↓
CNN Layers → Feature Maps
↓
Reshape → Sequence Format
↓
LSTM Layer → Contextual Understanding
↓
Dense Layers → Classification
↓
Softmax → Output: NORMAL or PNEUMONIA
Advantages:
- CNN: Captures local lung features
- LSTM: Understands global spatial dependencies
Model Compilation & Training
Training Details:
- Loss Function:
sparse_categorical_crossentropy - Optimizer:
Adam - Metric:
accuracy - Normalization: Pixel values scaled to [0, 1]
- Epochs: 20
- Validation Split: 20% Evaluation Metrics
Metrics Used:
- Accuracy: Overall prediction correctness
- Confusion Matrix: TP, FP, TN, FN breakdown
- Classification Report: Precision, Recall, F1-score
Visualization
Tools Used:
Matplotlib: For plotting training curvesSeaborn: For heatmaps and confusion matrix
Grad-CAM Integration:
- Highlights lung regions influencing predictions
- Builds trust and interpretability for clinicians Summary of Key Concepts
| Concept | Purpose |
|---|---|
| CNN | Extract spatial features from X-ray images |
| LSTM | Understand spatial dependencies across image regions |
| Reshape Layer | Convert CNN output to sequence format for LSTM |
| Dense + Softmax | Final classification into NORMAL/PNEUMONIA |
| Image Normalization | Scale image pixels to [0,1] for stable training |
| Model Evaluation | Accuracy, confusion matrix, precision, recall |
| Visualization | Helps interpret model performance visually |
| Grad-CAM | Visual explanation of model predictions |
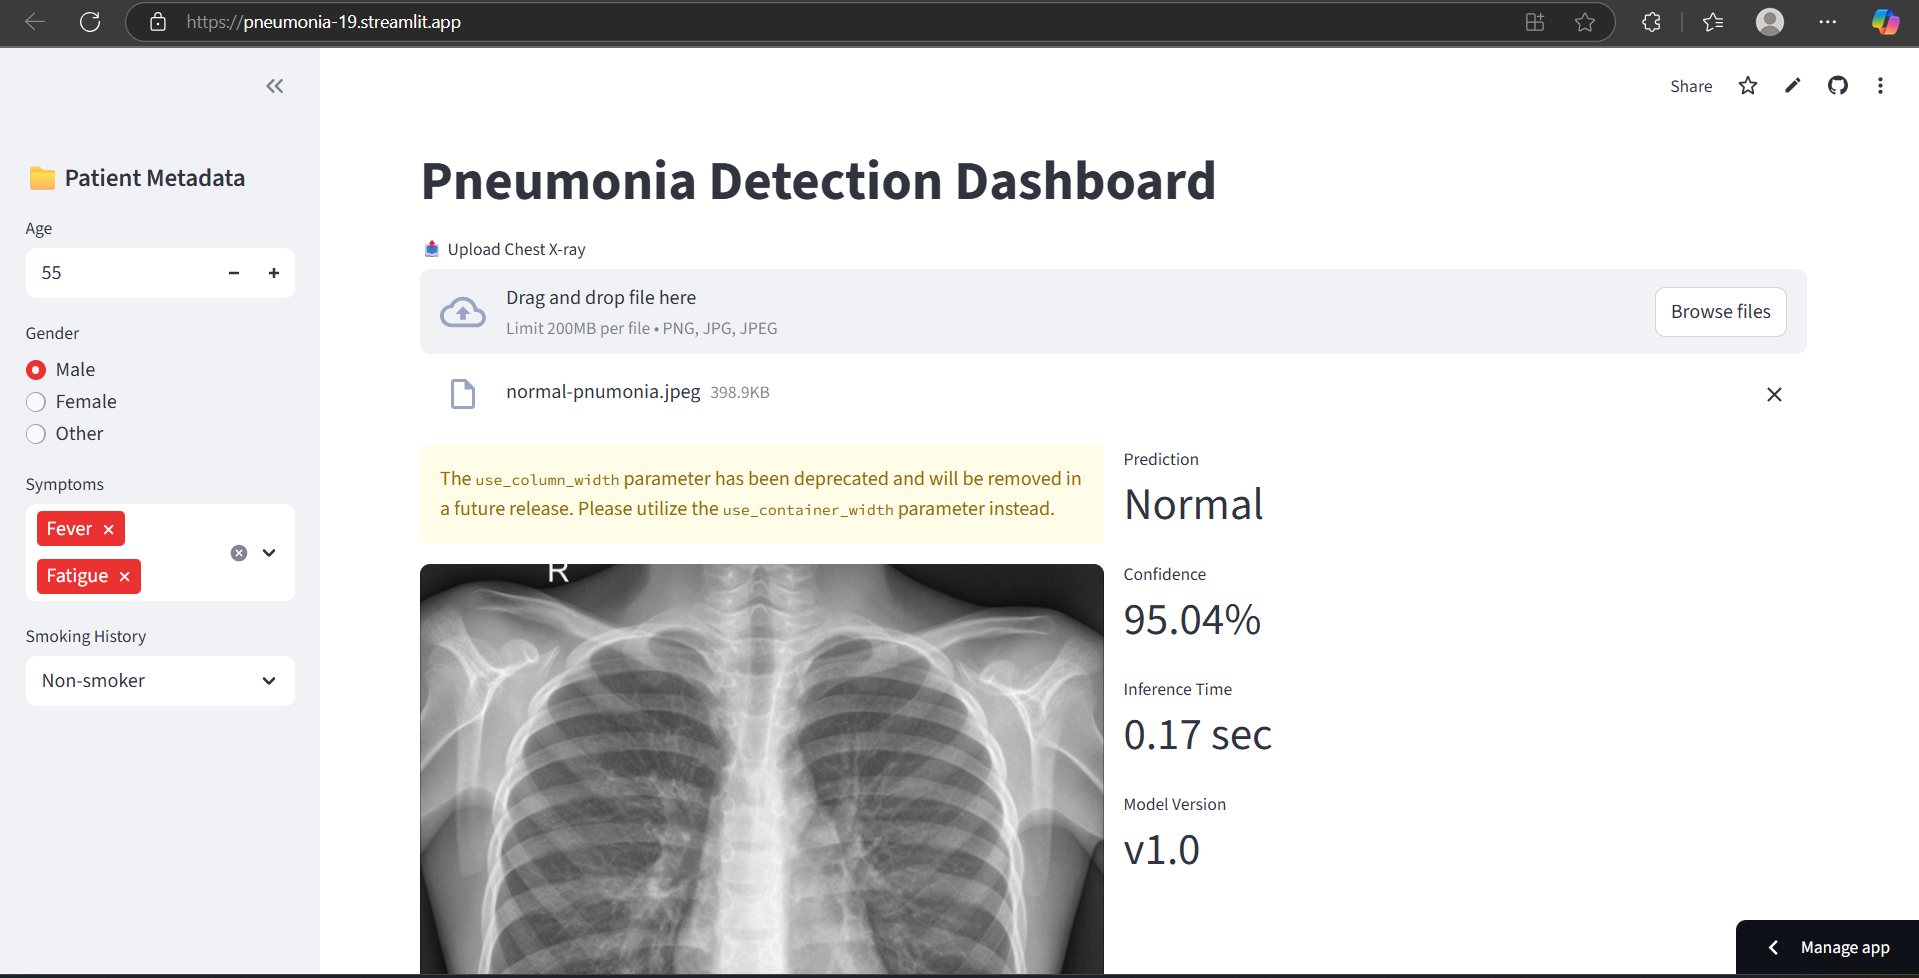
The app lets users export a detailed PDF report containing patient metadata, prediction results, and visual Grad-CAM overlays. This feature supports clinical documentation and easy sharing with healthcare professionals or patients. With one click, users can securely download the report for offline review or integration into medical records.
Built With
- python
- streamlit
- tensorflow

Log in or sign up for Devpost to join the conversation.