-
-
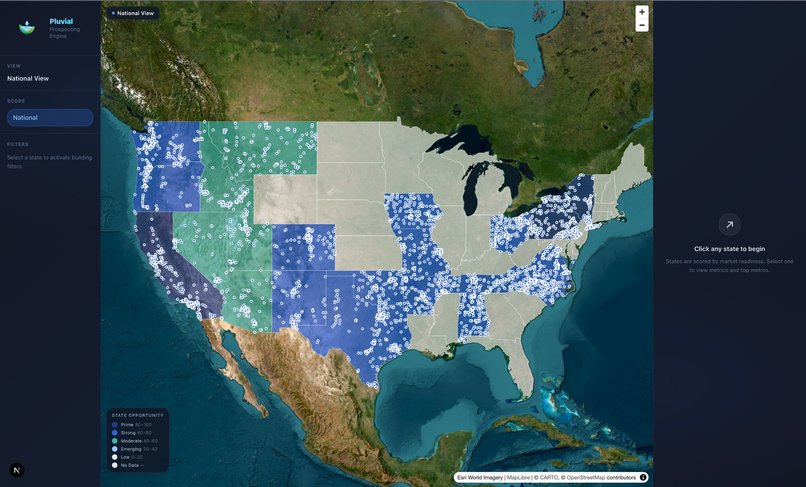
National Map View
-

-
-
-
-


Inspiration
It started with a simple question: why does so much water just… go to waste?
When we visited SMU and heard the speaker, we learned that a single large rooftop can capture hundreds of thousands of gallons of rainwater every year. In that moment, it stopped feeling like just a sustainability issue and started to look like a massive, overlooked opportunity hiding in plain sight.
That realization is what led us to build Pluvial.
Pluvial makes that invisible opportunity visible, helping companies clearly see the water they can capture, the savings they can unlock, and the environmental impact they’ve been leaving on the table.
What it does
Pluvial is a three-feature web platform built around a single data object: the Building Candidate Record. Every screen reads from the same pre-scored record, the map explores it, the ROI calculator quantifies it, and the AI brief sells it.
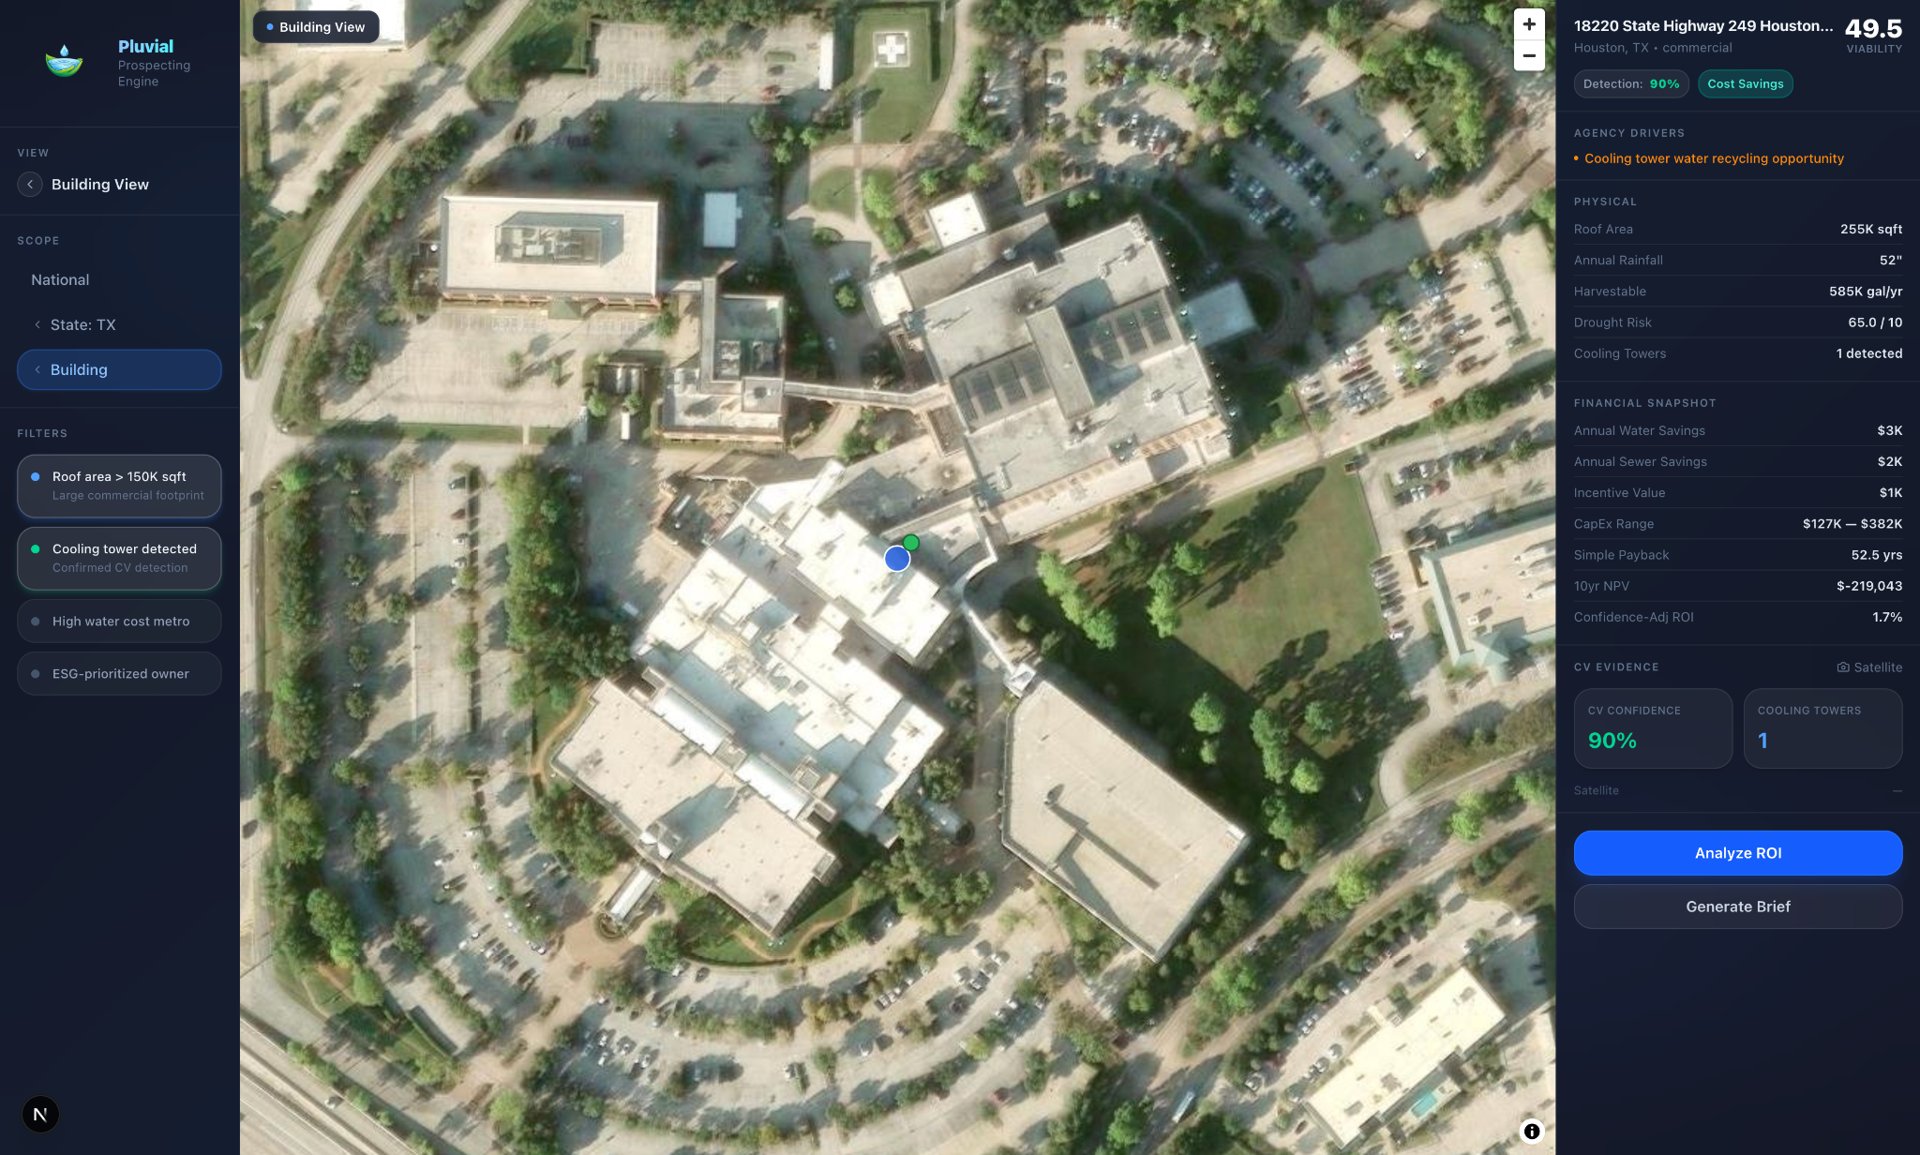
1. National Opportunity Map
An interactive Leaflet.js US choropleth where each state is shaded by aggregated market viability. Users drill down from country → state → metro → individual building. At the building level, markers encode viability scores and cooling tower detections from satellite imagery analysis. A filter panel narrows candidates by roof size (>50K sqft), cooling tower presence, water cost (≥$10/kgal), and ESG commitment (SBTi, LEED, or ESG score >80).
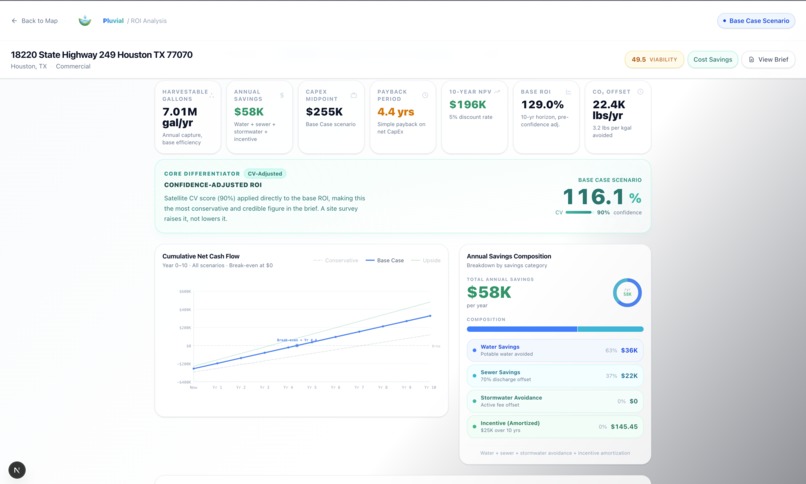
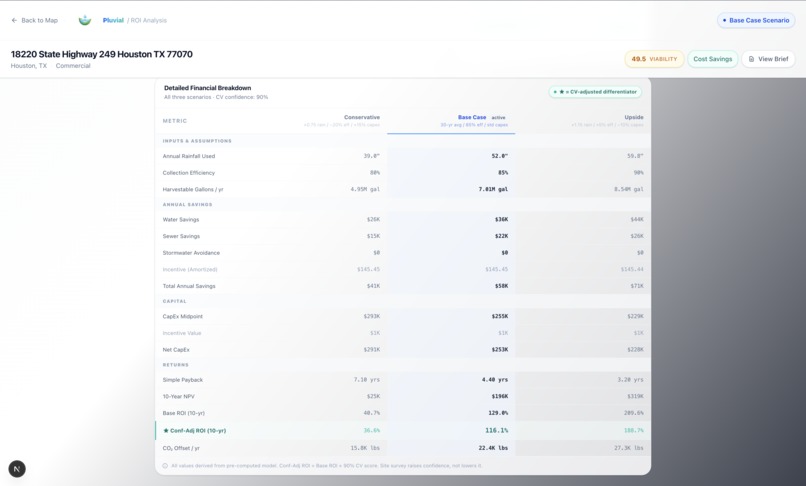
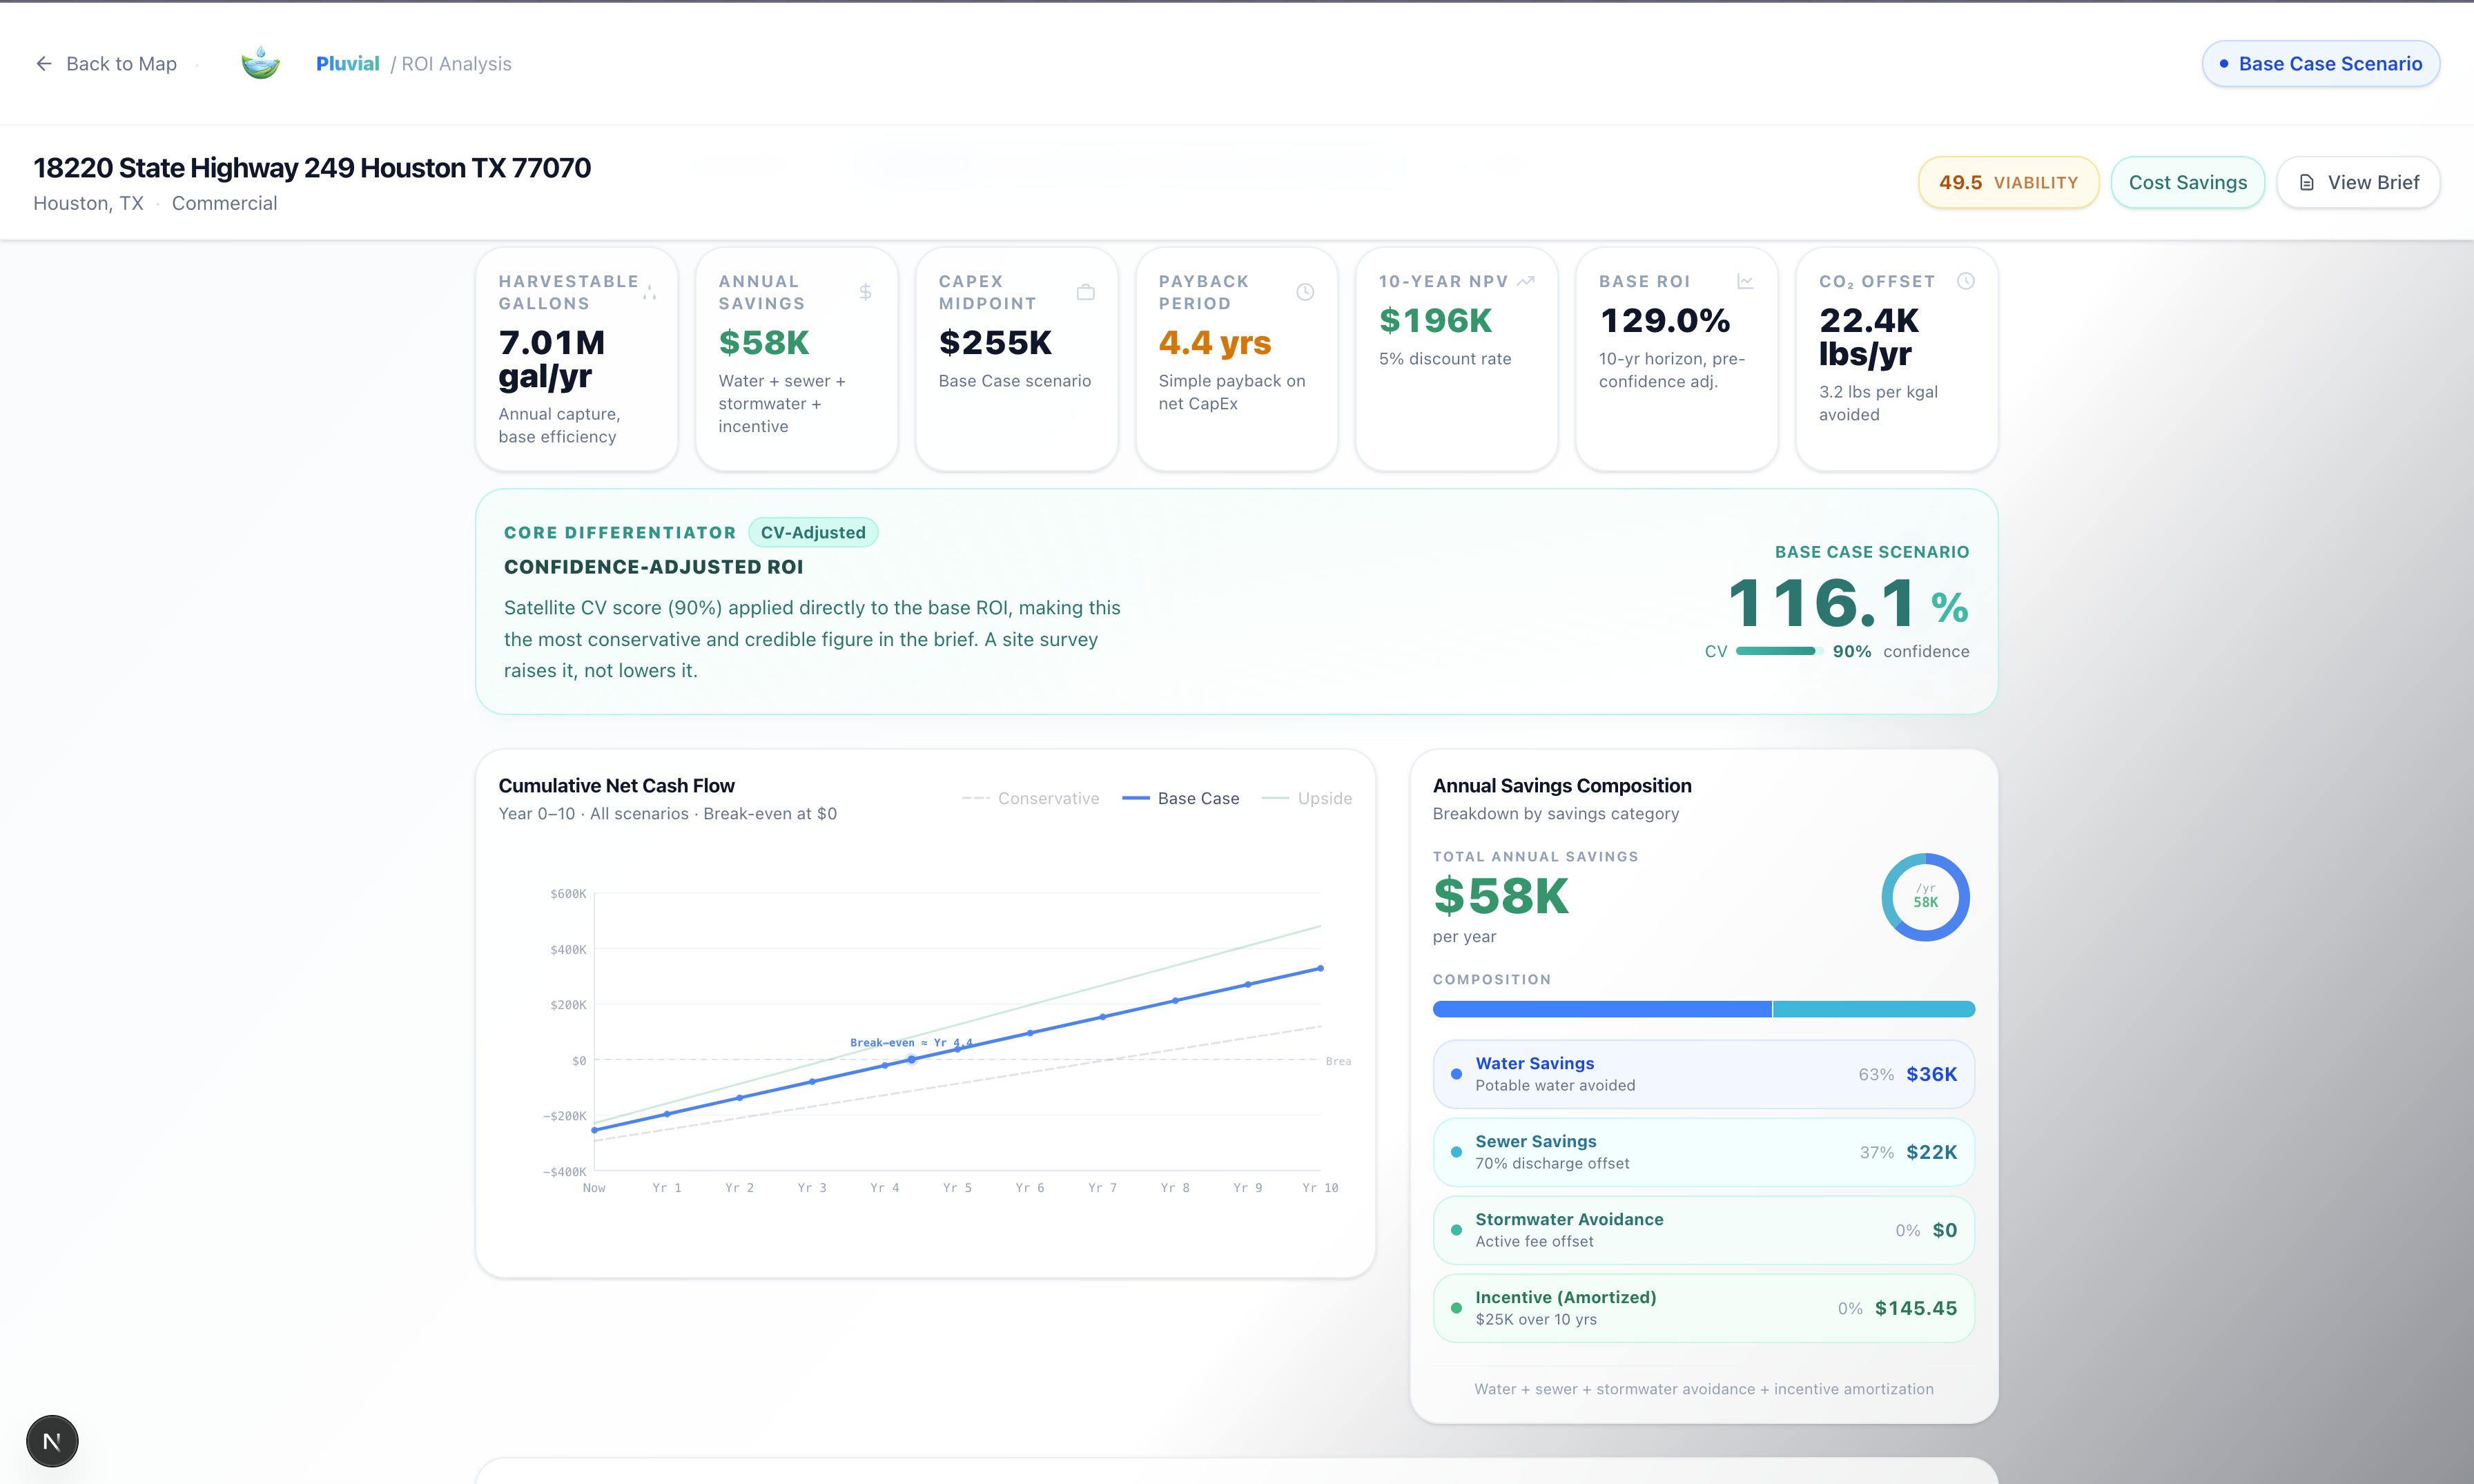
2. Smart ROI Calculator
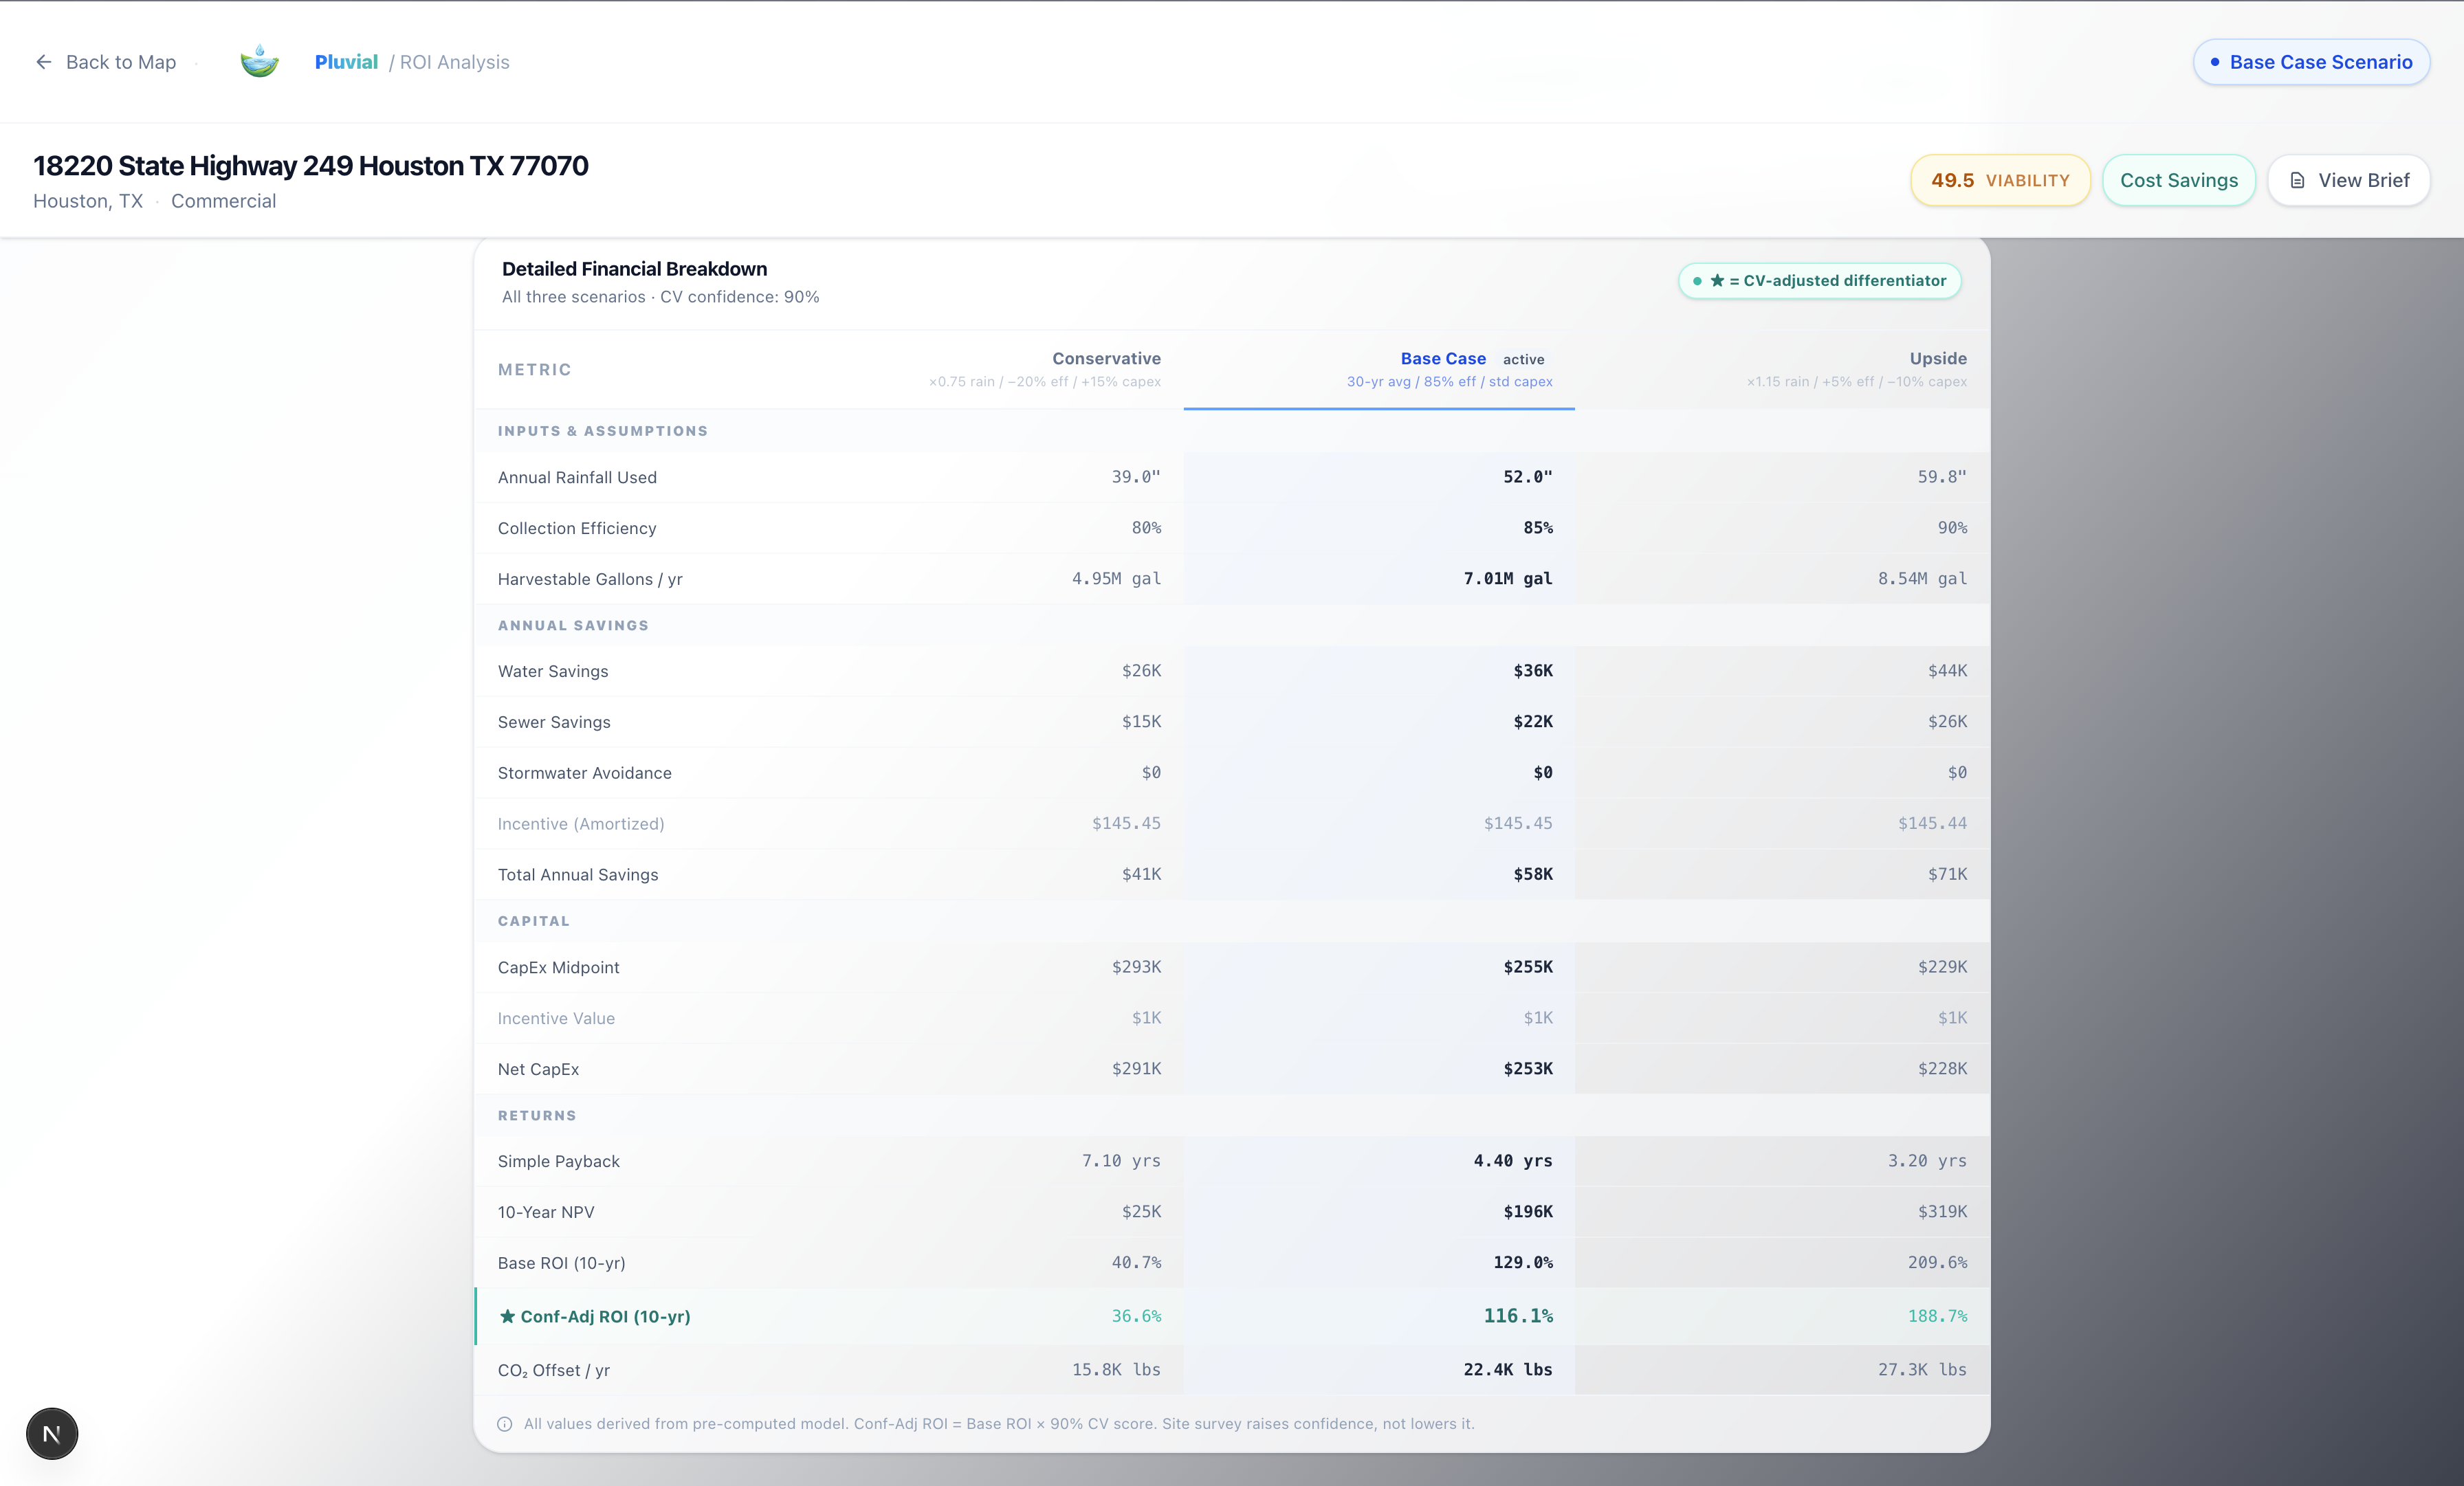
Auto-populated from the selected building across three scenarios (conservative / base/upside). Outputs decision-grade financial metrics using a multi-component savings model:
- Harvestable gallons = Roof area (sqft) × Rainfall (in) × 0.623 × efficiency
- Annual savings = Water savings + Sewer savings + Stormwater avoidance + Incentive amortization
- Confidence-adjusted ROI = Base ROI × CV Detection Confidence Score
The key differentiator: the CV confidence score discounts financial projections, tying geospatial uncertainty directly into the business case. Outputs include simple payback, 10-year NPV, and CO₂ offset.
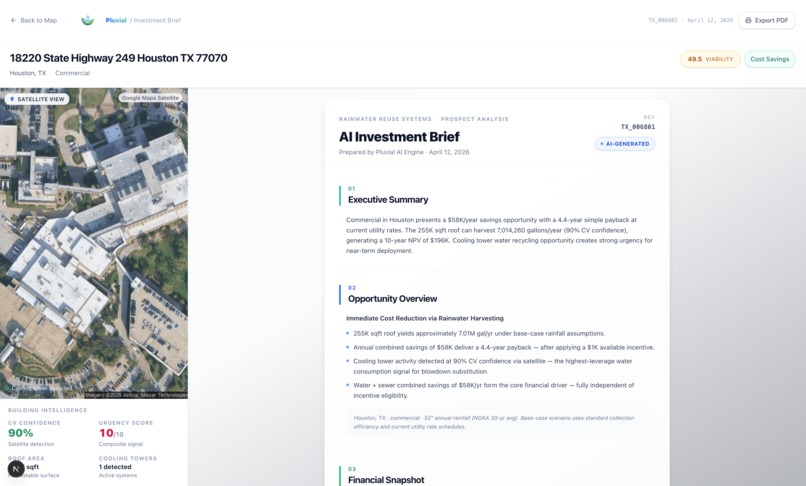
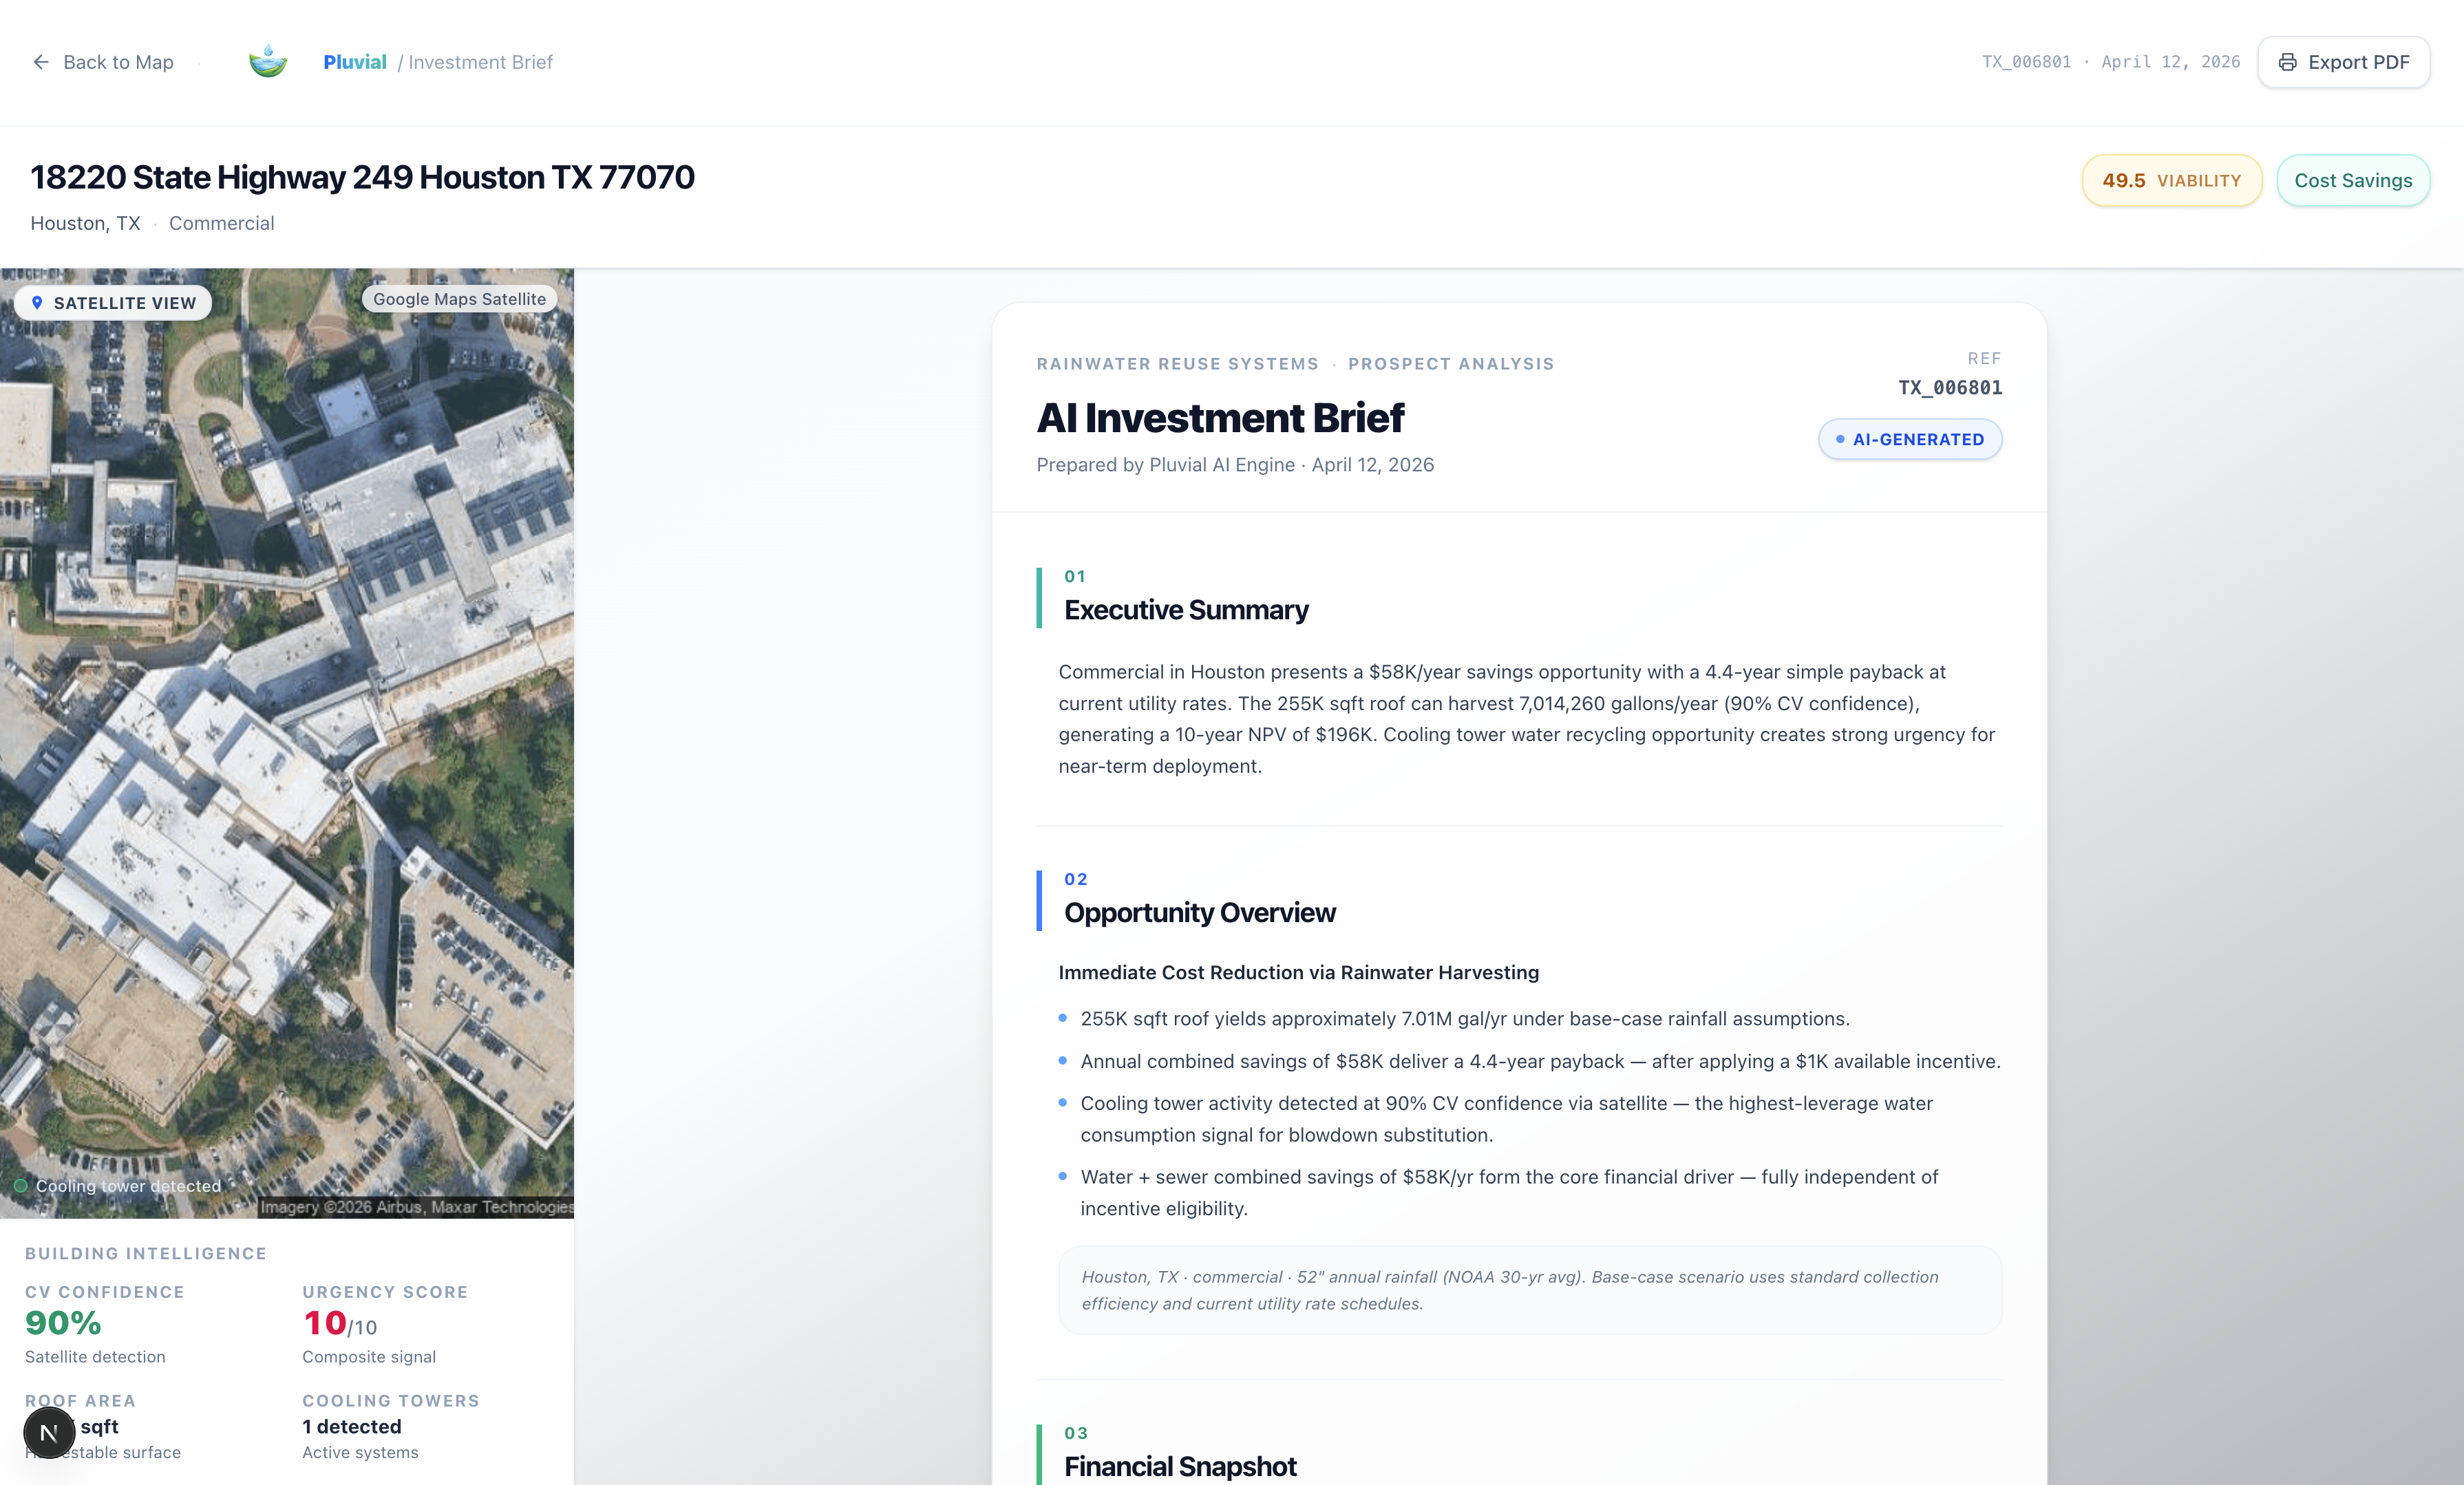
3. AI Investment Brief
Generates a sales-ready brief powered by Google Gemini 2.5 Flash with RAG context grounded in TCEQ regulations, ARCSA standards, and SBTi guidance. The brief selects a recommended sales angle (cost savings, resilience, regulatory compliance, or ESG credibility) based on building signals, then produces a structured narrative with urgency drivers, confidence caveats, and a 6-week action plan ready to hand to a facility manager.
How we built it
Frontend: Built with Next.js (App Router) and React 19, styled with Tailwind CSS 4 and shadcn/ui components. The interactive map runs on MapLibre GL with a Carto Positron basemap, switching to an Esri World Imagery satellite layer at the building level. Building satellite thumbnails are pulled from the Google Maps Static API at zoom 18. All map filtering (roof size, cooling tower, water cost, ESG) happens client-side for instant responsiveness across 10K+ building records.
Backend: FastAPI serves three core endpoints: building lookup, ROI calculation, and brief generation. The ROI engine (roi_engine.py) is a pure Python calculation layer that takes a building record and scenario parameters and returns a full financial model. All three scenarios (conservative, base, upside) are pre-computed on page load and cached in React state, so scenario toggles are instant.
AI Brief: Powered by Google Gemini 2.5 Flash with a structured JSON response schema enforced via a Pydantic BriefResponse model. Rather than prompting with raw building data alone, we built a lightweight RAG layer (rag_retrieval.py) that selects up to four relevant reference chunks from a curated corpus of regulatory documents: TCEQ rules, ARCSA/ASPE standards, SBTi guidance, Texas HB 3391, based on building signals (state, recommended angle, drought risk, ESG flags). This keeps the brief legally grounded without hallucinating statutes. If Gemini is unavailable, a deterministic fallback template generates a brief from the data directly.
Data Pipeline: The buildings.json dataset encodes roof area, annual rainfall, utility rates, cooling tower detection confidence, ESG commitments, and pre-computed viability scores for each building. State-level choropleth scores are aggregated into state_scores.json. The CV confidence score from satellite analysis feeds directly into the ROI model to discount projections based on detection certainty.
Challenges we ran into
Figuring out how to visually represent cooling tower detections on the map without cluttering building markers, we ended up using pseudo-random offset positioning to spread indicators around each building centroid.
Loading and filtering 50,000+ building records entirely in the browser without freezing the map required careful thought around data structure and client-side performance.
Getting Gemini to reliably return structured, usable output took significant prompt engineering. We ended up enforcing a strict JSON schema via Pydantic to prevent the model from going off-format.
Accomplishments that we're proud of
Building an end-to-end working prototype that takes a user from discovering a building on a national map all the way to a sales-ready investment brief in under a minute.
The CV-to-ROI confidence chain is real. This isn't a demo gimmick — satellite detection certainty flowing into a financial model is a genuine technical contribution. When you show a VP of Facilities that the projected ROI is confidence-adjusted for physical signal quality, and that a site visit would reduce that uncertainty, you're giving them a reason to act rather than a number to argue with.
The RAG corpus is grounded in primary sources. TCEQ regulatory guidance, ARCSA/ASPE 78-2021, DOE FEMP methodology, SBTi/SBTN freshwater standards, Philadelphia stormwater billing tables. The brief doesn't invent regulatory context, it retrieves and cites it.
What we learned
Data quality is the real constraint. The model is only as good as the input data. Address matching from Overture is imperfect. EPA NAICS codes are a proxy for cooling tower presence, not a direct measurement. NOAA rainfall normals are 30-year averages, not forecasts. Designing the system to be explicit about these limitations — rather than hiding them — is what makes the confidence score meaningful.
The sales framing matters as much as the analysis. We spent real time on the brief template structure, not because it's technically interesting, but because a Sales representatives need to walk out of a meeting with a document a VP of Facilities will share with their CFO. "Consulting deliverable" is a UX requirement.
What's next for Pluvial
Expand the CV pipeline to all 48 continental states with live Google Earth Engine inference
Adding user accounts so sales teams can save building shortlists, track outreach status, and share briefs with colleagues, turning the platform into a full prospecting workflow tool.
Built With
- duckdb
- epa-frs
- fastapi
- gemini
- geopandas
- maplibregl
- maps
- microsoft-building-footprints
- next.js
- noaa
- openai
- overture-maps
- pydantic
- pyproj
- python
- rag
- react
- sbti
- shadcn/ui
- tailwind
- typescript


Log in or sign up for Devpost to join the conversation.