-
-
finding
-
facility
-
take-action
-
measure-next
-
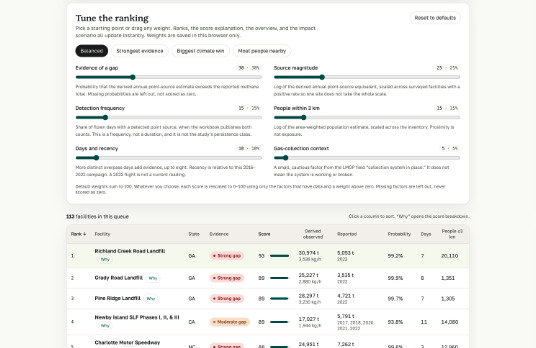
priority
Inspiration
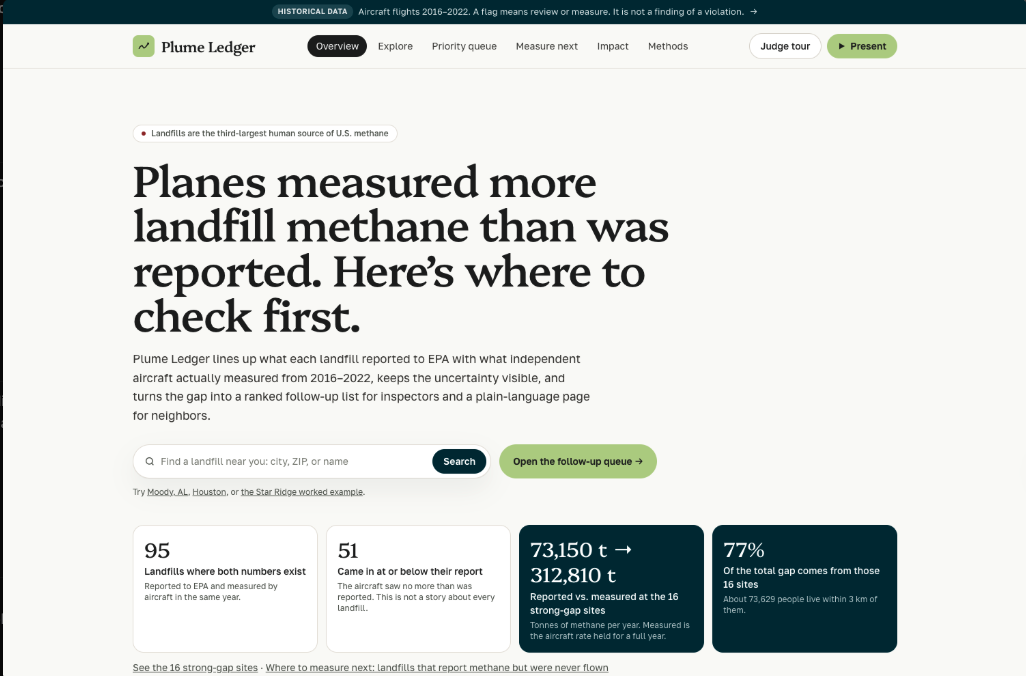
Landfills are the third-largest human source of methane in the U.S., and methane traps about 80 times more heat than CO₂ over 20 years. But the official landfill numbers are estimates that operators report to EPA themselves. In 2024, a study in Science (Cusworth et al.) flew aircraft over U.S. landfills and found more methane, on average, than was reported. The measurements were published as a spreadsheet. We wanted to know which specific landfills that applied to, and what someone could actually do about it.
What it does
Plume Ledger matches EPA's Greenhouse Gas Reporting Program totals to the published aircraft measurements, landfill by landfill, using only report years when a plane actually flew.
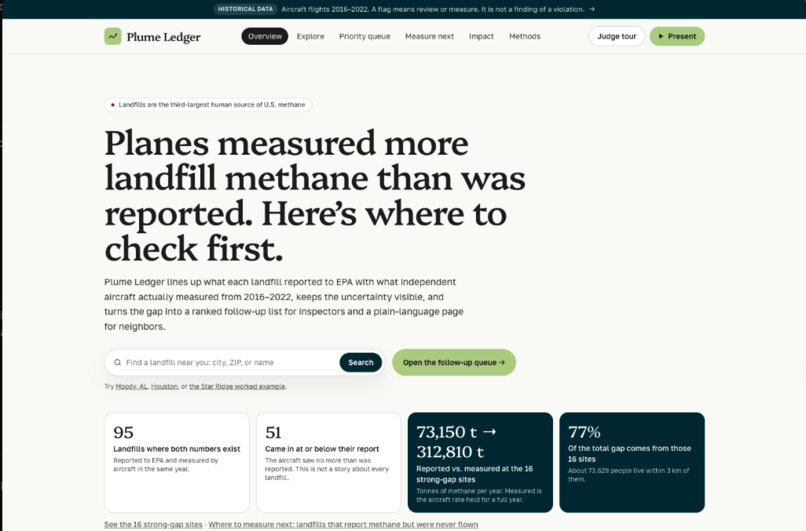
- The finding: Of 95 landfills with both numbers, 51 came in at or below their report. But 16 "strong-gap" sites reported 73,150 tonnes of methane a year while the aircraft rate works out to 312,810. Those 16 sites carry 77% of the total gap, and about 73,600 people live within 3 km of them.
- Find your landfill: search by city, ZIP, or name, or use "Landfills near me" on the map.
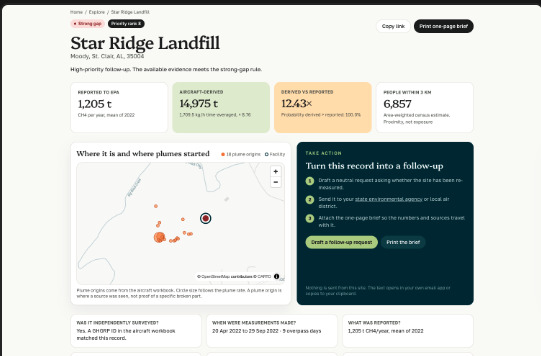
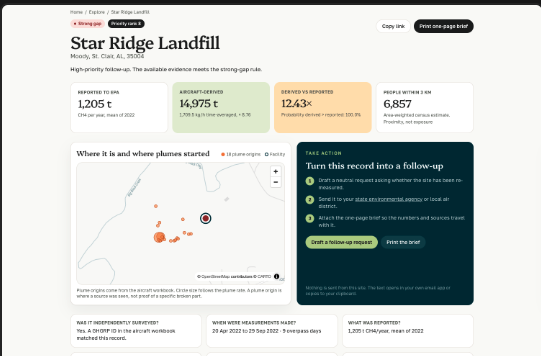
- Facility pages show what was reported, what the plane saw and on which days, where plumes started, the probability of a real gap, and who lives nearby, in plain language.
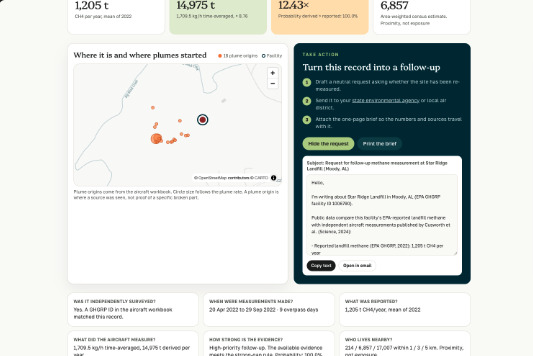
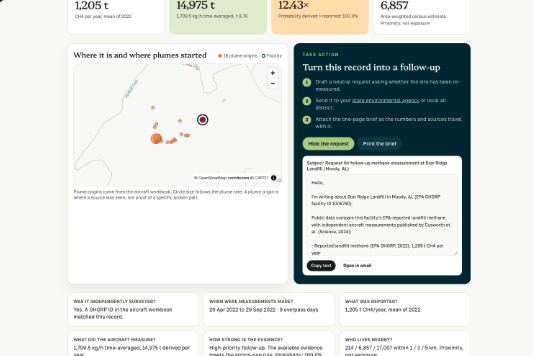
- Take action: every facility page drafts a neutral follow-up request to the state environmental agency, with the numbers and overpass dates filled in. Copy it or open it in email, and attach the printable one-page brief. It asks questions; it doesn't allege violations.
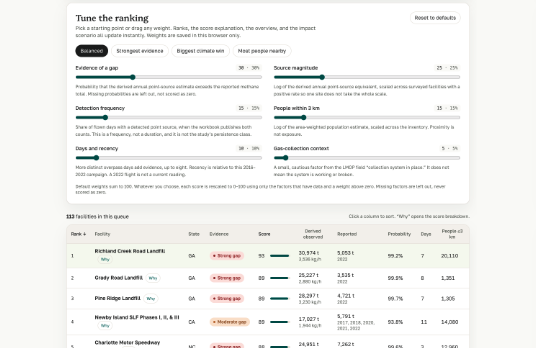
- Priority queue with presets (Balanced, Strongest evidence, Biggest climate win, Most people nearby), an explanation for every rank, and CSV export.
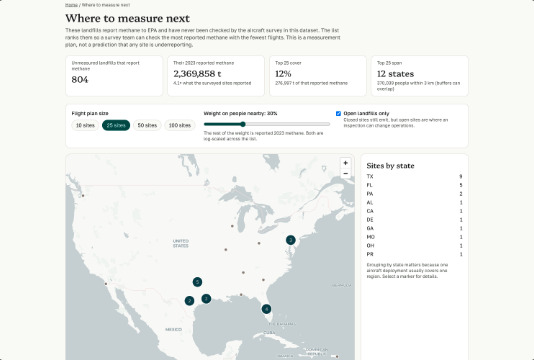
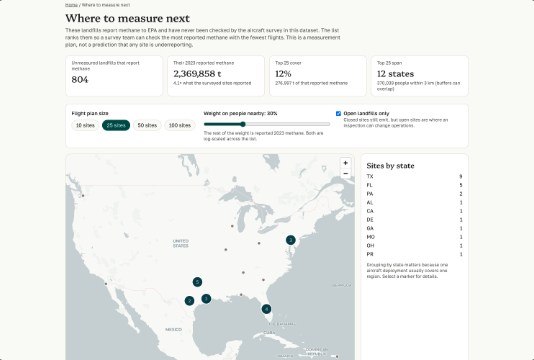
- Measure next: 804 open landfills report methane but were never measured in this dataset. Together they reported 2.37 million tonnes in 2023. Plume Ledger ranks them into an exportable flight plan grouped by state.
- Impact scenario: choose how many top sites get fixed and what share of each plume a repair removes, and see avoided methane, CO₂e, and car equivalents, with every assumption on screen.
Example: Star Ridge Landfill in Moody, Alabama reported 1,205 t of methane for 2022. Aircraft flew it on 9 days that year and measured 1,709.5 kg/h, about 14,975 t/year. In 10,000 simulations it beat the report every time.
How we built it
- Python pipeline (pandas, geopandas, numpy, scipy): downloads the EPA ScienceHub aircraft workbook, EPA's Landfill Methane Outreach Program inventory, and GHGRP summary files; joins on exact facility IDs; converts CO₂-equivalent back to methane; and estimates nearby population from Census ACS 2023 block groups.
- Statistics: the annual figure is $t/\text{yr} = \text{kg/h} \times 8.76$. For each landfill we run 10,000 Monte Carlo draws from the aircraft's published uncertainty, with a fixed seed per facility so results are reproducible. A strong gap requires $P(\text{measured} > \text{reported}) \ge 0.95$ and at least 3 overpass days. We set the thresholds before seeing results and never tuned them.
- Web app (Next.js, TypeScript, Tailwind, MapLibre, Recharts, GSAP): runs entirely from static JSON on Vercel. Scoring, the flight plan, and the drafted request run in the browser, with no server or login. It also has a built-in presentation mode driven by live data.
- Testing: Vitest unit tests, pytest for the pipeline, and typecheck, lint, and production build checks.
Challenges we ran into
- Three EPA datasets use different IDs, units, and years. We matched on exact IDs only and documented the one aircraft ID we couldn't match instead of guessing.
- EPA reports CO₂-equivalent using an older warming factor (GWP 25). Recovering landfill methane without counting other sources took care.
- Missing data: filling blanks with zero would make unmeasured landfills look clean. Every missing value stays missing, and the app says so.
- Not overclaiming: aircraft see concentrated plumes, not every emission, so the test only runs one direction. We built the product around asking for follow-up, not accusing operators.
Accomplishments that we're proud of
- A specific, checkable result: 16 sites carry 77% of the gap, while about half of landfills match or beat their report.
- Turning a research paper into actions anyone can take: a ranked list, a ready-to-send request, and a flight plan.
- Everything is reproducible from public data with one command, and we didn't force our numbers to match the paper (we got 1.64× overall vs. its ~1.4×).
What we learned
How climate data actually gets made: self-reported inventories, aircraft measurements, uncertainty ranges, and why "no data" is different from "zero." And that a tool matters only if it ends in an action someone can take.
What's next
- Send requests for the strongest sites to two state agencies and track responses.
- Add EPA enforcement history (ECHO) so the queue shows whether a site was inspected after the flights.
- Pull in newer satellite detections (Carbon Mapper, MethaneSAT) so "Measure next" updates itself.

Log in or sign up for Devpost to join the conversation.