Inspiration
Methane traps roughly 30 times more heat than CO₂ over a century, and a small number of large point sources drive a disproportionate share of emissions from oil and gas infrastructure. The observations already exist. Carbon Mapper, NASA EMIT, and UNEP IMEO publish plume detections publicly and for free.
The problem is that the published record is far harder to read than it looks. We pulled a single plume from the Carbon Mapper STAC API and got back seven records for one observation: different products, different processing versions, different asset roles. An analyst searching that catalog sees seven results. It is one measurement.
That is how you end up with an evidence file that looks stronger than it is. We built Plume to fix it.
What it does
Plume is an open-source workspace that turns published satellite methane observations into an investigation someone else can verify.
It counts measurements, not records. Plume resolves catalog records back to their underlying acquisition and tracks four counts separately: publications, distinct acquisitions, distinct plumes, and distinct detection days. A reprocessed version never inflates an acquisition count. Two publications of one measurement never become two pieces of evidence. This is the core of the product and, as far as we can tell, nothing else in the public methane ecosystem does it.
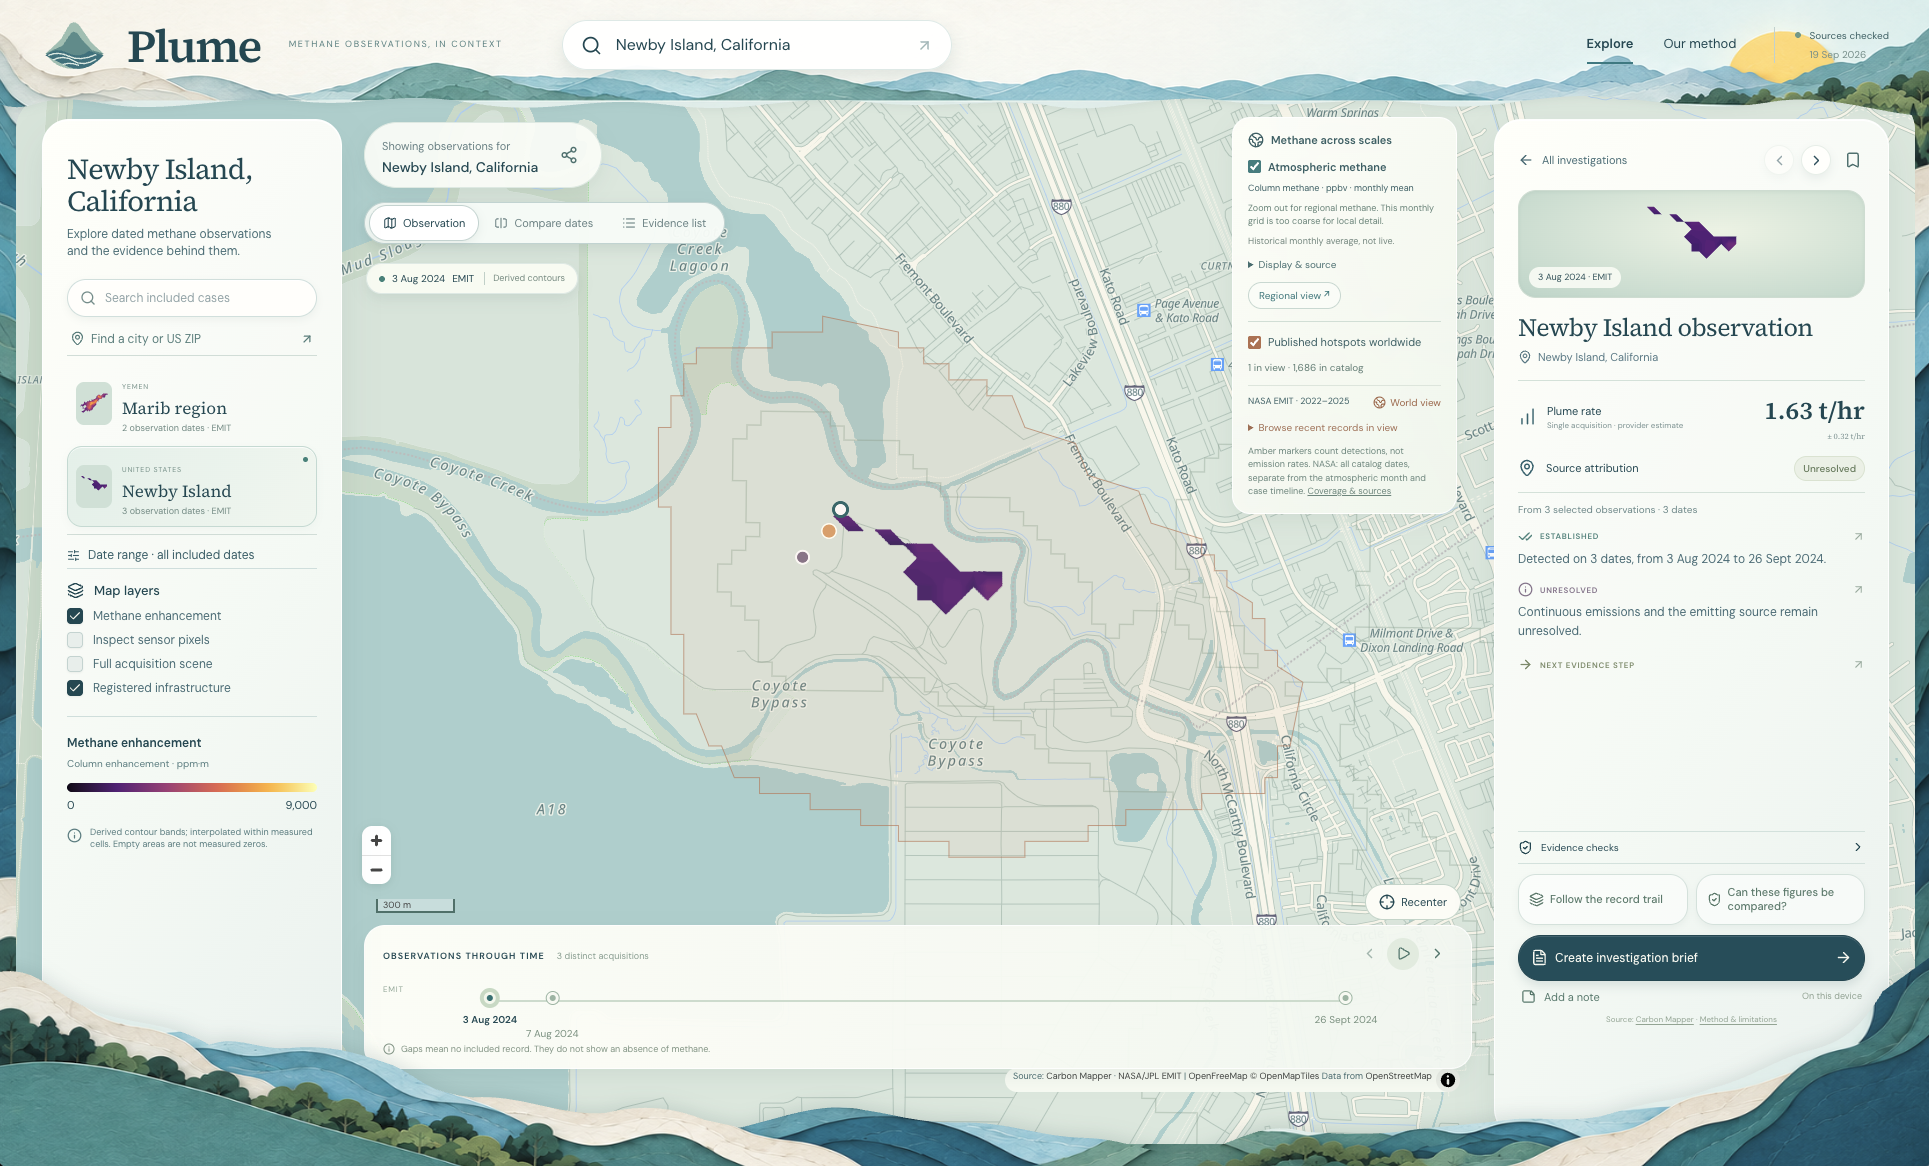
It shows dated evidence, not a heatmap. Real georeferenced enhancement rasters on a persistent acquisition timeline, with visible gaps. Every pixel on the map traces to a specific acquisition at a specific UTC timestamp.
Findings show their work. Every claim on screen links to the records supporting it. Deselect a date and the finding recomputes live: two dates dropping to one converts a recurrence claim into a single-observation statement, automatically.
It knows what cannot be compared. Plume can explain, condition by condition, exactly why a satellite observation of a single acquisition cannot be measured against an annual reported inventory figure. Most tools produce the number anyway. Ours produces the reasoning.
It exports. A readable PDF brief plus a structured evidence package containing record IDs, geometries, relationships, claim provenance, and SHA-256 checksums for every file.
The whole thing runs from a frozen, versioned snapshot. No login, no API keys, no live satellite dependency. Clone it and it runs.
How we built it
Frontend: React, TypeScript, Vite, MapLibre GL JS, Tailwind. Zod schemas validate every snapshot and every piece of shared URL state. The evidence engine is pure TypeScript shared between the UI and the export worker, so the PDF and the screen compute identical claims from the same canonical input.
Data preparation: Python with rasterio, GDAL, pyproj, and NumPy. Retrieval, mask and CRS validation, reprojection, legend preparation, and hashing all run offline and publish an immutable snapshot.
Sources: Carbon Mapper catalog and STAC APIs for plume records, products, and assets; NASA EMIT metadata through CMR; GeoNames for place lookup; OpenStreetMap vector tiles for the basemap.
Exports: generated entirely client-side in a Web Worker, with a canonical evidence fingerprint so the same selection always produces the same claims.
Featured investigation: two real acquisitions recorded 2024-04-20 10:14:48 UTC and 2024-10-23 08:37:41 UTC, with published plume rates of 3,056 and 4,944 kg/h and provider uncertainties of 444 and 661 kg/h. Both rasters are in EPSG:32638 at roughly 59 m sampling.
Challenges we ran into
Zeros are not nodata. The visualization rasters contain 303 and 205 valid zero-valued pixels sitting alongside NaN nodata. Treating them identically silently corrupts the mask and every downstream number. Working out which zeros were real measurements took longer than any interface work in the project.
Two products, two grids. The visualization and quantification crops for the same plume have different extents. We reprojected onto the crop grid and validated sample by sample: all 166 and 133 valid samples matched with zero numeric difference. That check is why we trust what the map shows.
Provider documentation that disagrees with provider data. NASA's portal documentation states that emission rates are not provided. The current public map feed contains rate estimate fields. Instead of guessing, we built the pipeline to validate quantity availability per product and per version, which turned a contradiction into a rule the system enforces.
A number that invites the wrong conclusion. Our two observations are 3,056 and 4,944 kg/h, six months apart. That looks like a 62% increase. It is not: these are instantaneous estimates from single acquisitions, each reflecting conditions at one moment. So we made refusal a feature. Plume will not compute a percentage change between instantaneous rates, and it says why on screen. Anticipating the wrong inference and engineering against it turned out to be the most interesting design problem in the build.
Accomplishments we're proud of
- A real, working acquisition-lineage layer validated against live provider data, not a mockup
- Seven catalog records correctly resolved to one measurement, on screen, in under two seconds
- Findings that recompute from selected evidence with full provenance, down to the individual record ID
- A PDF and structured export that are provably derived from the same canonical evidence as the interface
- An application that runs offline from a versioned snapshot with one command
What we learned
None of us had worked with satellite data before this. Our background is application and frontend engineering, so nearly everything here was new: reading GeoTIFF and netCDF products, coordinate reference systems and affine transforms, mask and nodata semantics, uncertainty definitions, and how much of a scientific product's meaning lives in metadata rather than pixels.
We also learned the value of checking an assumption before building on it. We originally planned to process raw Sentinel-5P TROPOMI data and find persistent sources by stacking hundreds of overpasses. Before writing code, we ran the numbers. A 10 t/hr source produces roughly a 5 ppb column enhancement against about 12 ppb of single-pixel noise, and stacking reduces noise as
$$\sigma_{\text{stacked}} = \frac{\sigma}{\sqrt{N}} = \frac{12}{\sqrt{50}} \approx 1.70\ \text{ppb}$$
giving an SNR near 2.9 at fifty observations. That put the realistic detection floor well above what we had assumed, in territory the published catalogs already cover. So we pivoted to the problem nobody was solving: making the existing published record readable without miscounting it. An hour of arithmetic saved the project.
What's next
Extending lineage resolution across providers, adding validated attribution cases, and connecting the comparison assessment to US reported inventory records where facility-level data exists.
All code in this repository was written during NextStep Hacks 2026.
Built With
- carbon-mapper
- maplibre-gl
- next.js
- python
- react
- typescript


Log in or sign up for Devpost to join the conversation.